Fair Value Gaps, Volume Imbalance, and Gap Ups in the Stock Market: Understanding Market Imbalance, Liquidity Dynamics, and Price Action Explained
Financial markets do not move in smooth uninterrupted curves; they move in bursts, pauses, retracements, and accelerations driven by an ongoing negotiation between buyers and sellers. At times, price rotates slowly in balanced trading ranges where both sides participate and where supply and demand match closely. At other times, price travels rapidly in one direction when one side overwhelms the other, leaving behind regions of “unfinished business” on the chart where the market failed to trade efficiently. These moments of imbalance are not accidental; they reflect the urgent entry of institutional orders, sudden liquidity shortages, gaps in order book participation, or emotional reactions among market participants. Three concepts help traders identify and understand these imbalances more clearly: Fair Value Gaps (FVG), Volume Imbalance, and Gap Ups. Each represents a specific way that price outruns balance, leaving traces that price often reacts to later. Although they appear differently on a chart — one in candle displacement, one in volume distribution, and one in price gaps between trading sessions — all three arise from the same core principle: when the auction system becomes temporarily inefficient, price tends to return later to restore fairness. When these concepts are mapped into market structure, price action reveals not chaos, but the logical movement of liquidity through imbalanced and balanced regions.
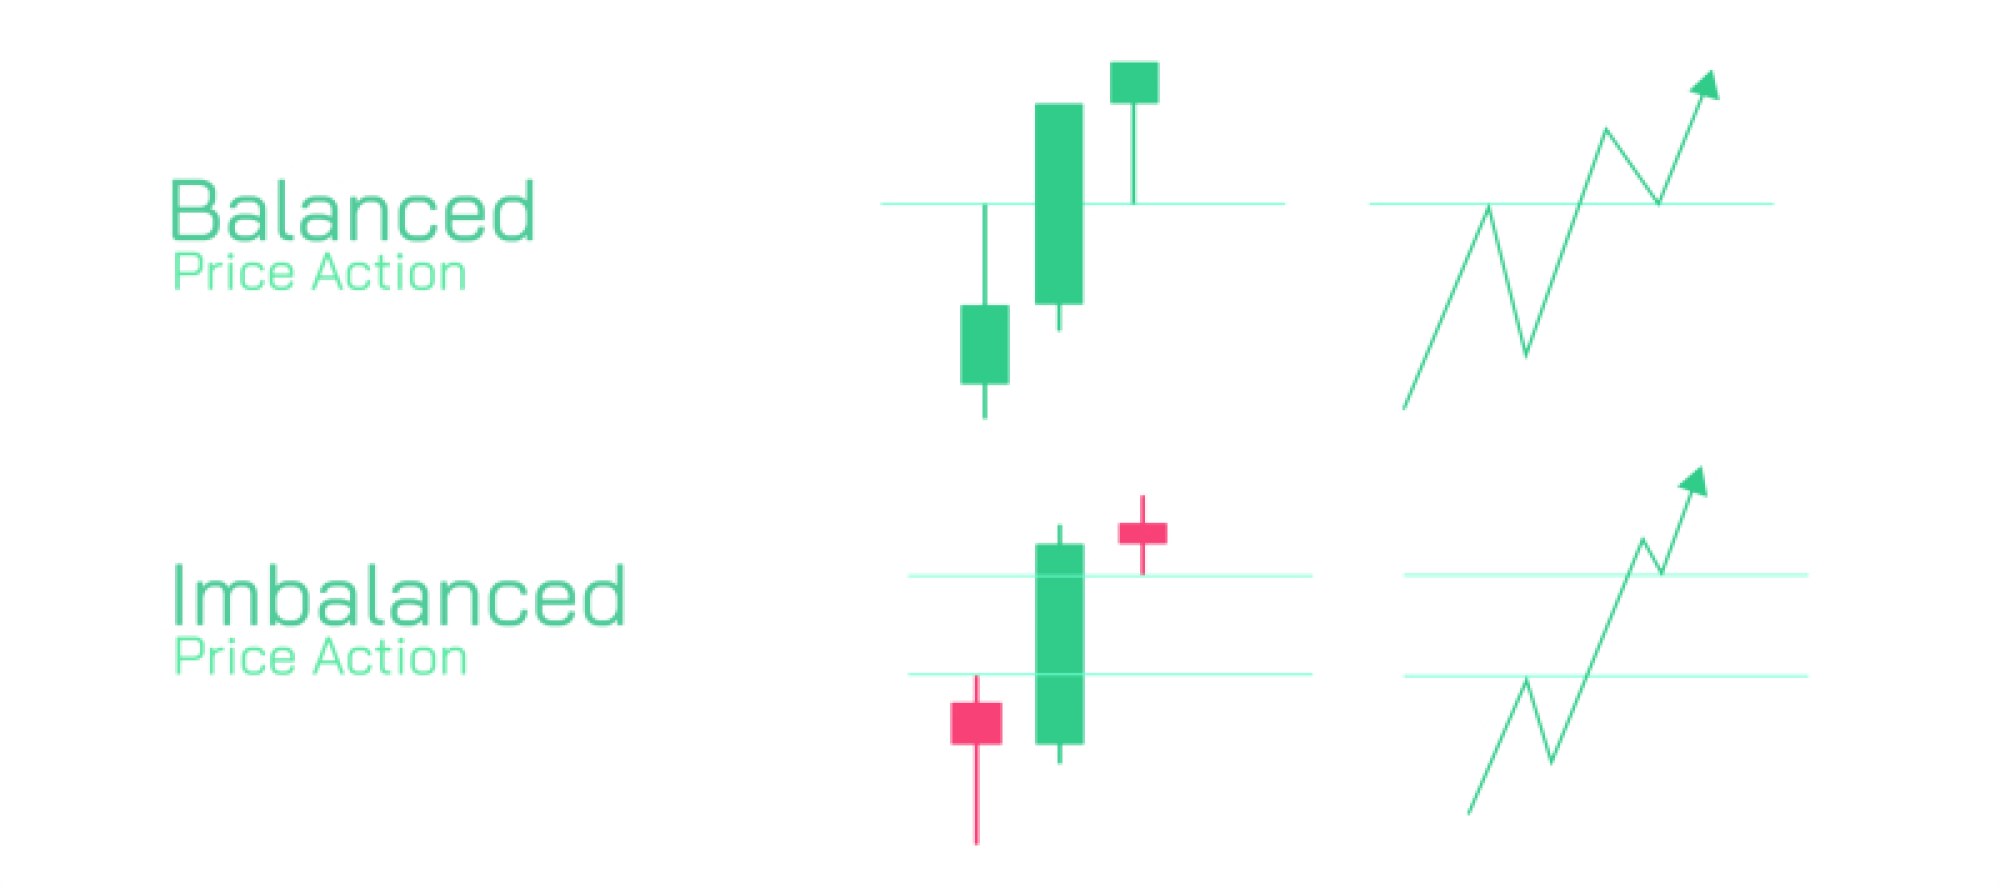
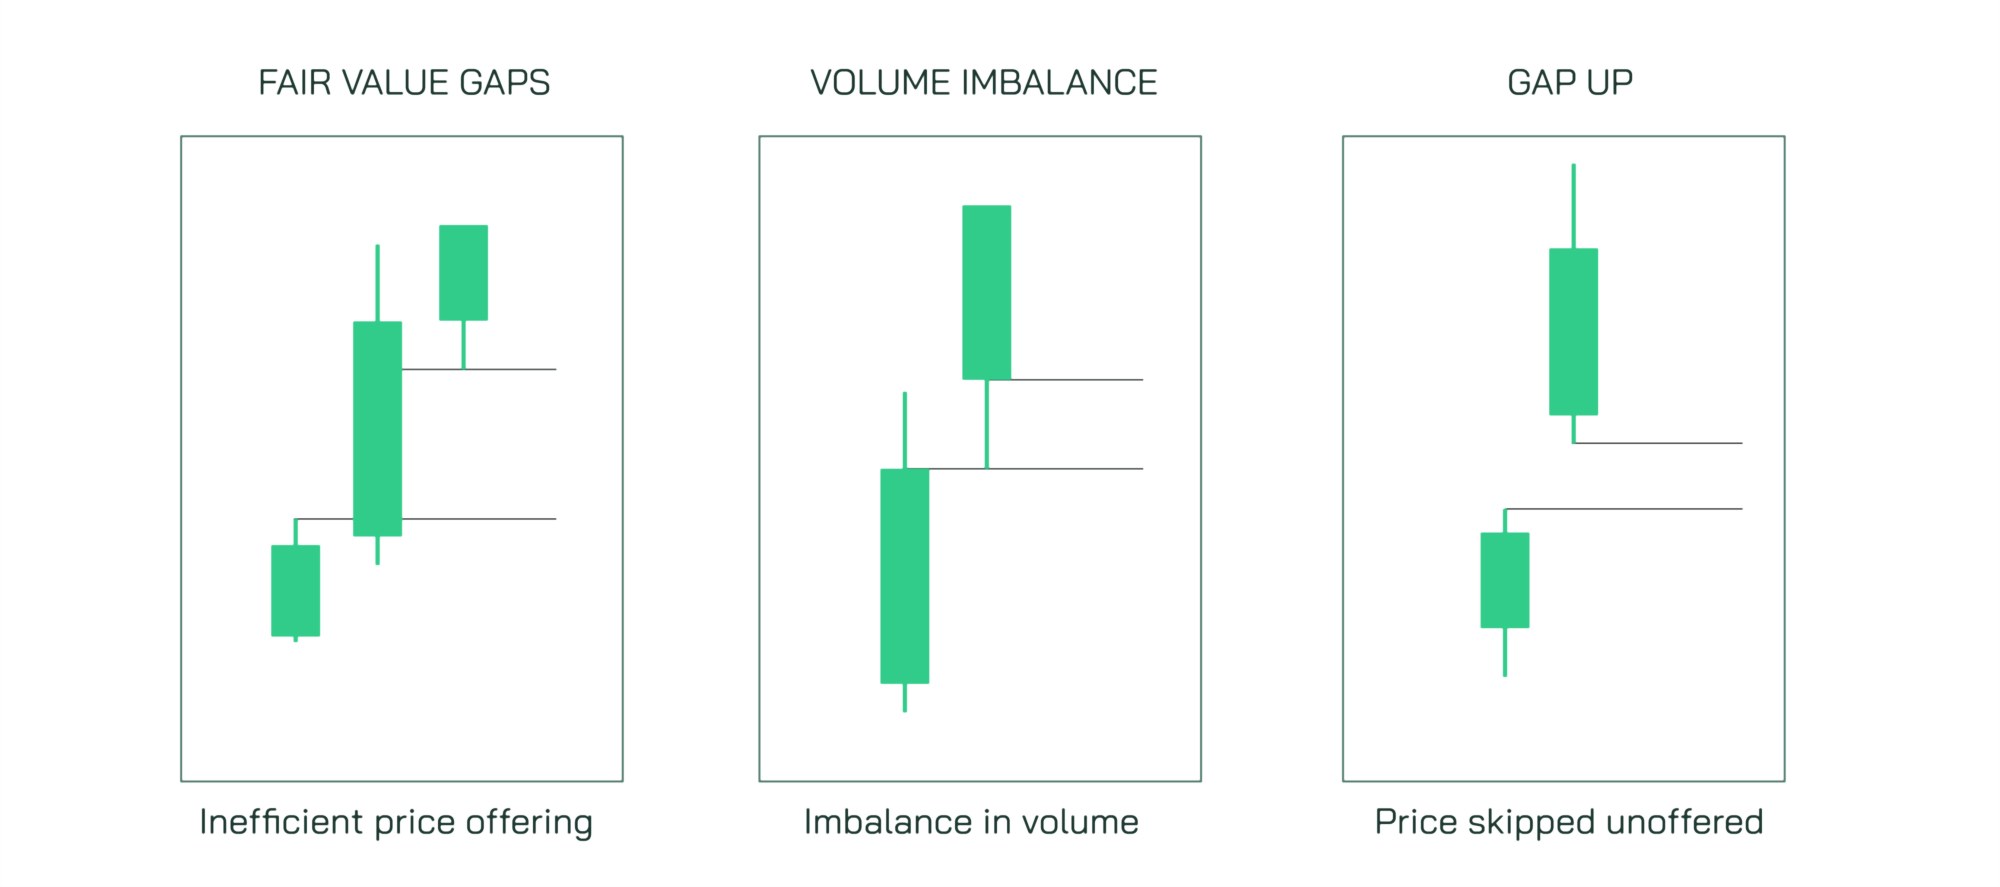
A Fair Value Gap (FVG) is created when price moves so aggressively that one side of the auction process does not participate. In visual terms, an FVG is most commonly seen as a three-candle formation in which the wicks of the first and third candles do not overlap the wick or body of the middle candle. The middle candle — usually long and directional — represents a strong displacement in which buying pressure overwhelms selling pressure in a bullish move or selling pressure overwhelms buying pressure in a bearish move. Because price moves too quickly for both sides to engage, the market fails to trade through a “fair” range, leaving behind an area where orders were skipped rather than matched. This region becomes a liquidity void — a zone where the auction never occurred and where price frequently returns later to re-establish balance. In trending markets, price often rallies upward, leaves a bullish FVG behind, then revisits it later to fill inefficiency before resuming the trend. In falling markets, price may collapse with such force that a bearish FVG remains above, later acting as a magnet when price retraces to rebalance before continuing downward. Fair Value Gaps do not guarantee reversals or corrections, but they offer insight into how price may behave once the imbalance reaches a point of exhaustion and equilibrium is required.
A Volume Imbalance arises from the same principle of unequal participation but is identified not by candle geometry, rather by the distribution of executed volume at a given price level. In a healthy auction, buyers and sellers interact across a range of prices, generating a relatively symmetrical volume footprint. When price races through levels with overwhelming urgency, volume clusters disproportionately at certain prices while being nearly absent at others. This absence of two-sided volume indicates that the market did not have time to facilitate fair trade at that level. Volume Imbalances often appear at breakout points where institutional buying or selling overwhelms resting opposing orders, forcing price to skip levels where trades normally would have occurred. Later, when the market stabilizes or reverses, price frequently gravitates toward these low-volume nodes because they represent uncompleted exchanges. Volume Imbalances therefore function similarly to Fair Value Gaps, but they measure imbalance through executed order flow rather than visual distance between candlesticks. A candle may appear visually balanced but still show extreme volume imbalance internally; therefore, recognizing volume-based inefficiencies adds precision to understanding where price may later react.
A Gap Up (or Gap Down in bearish cases) is the clearest and most dramatic sign of imbalance because it occurs between trading sessions rather than within one. When price opens at a significantly higher value than the previous close, a Gap Up is formed; this indicates that buying pressure from overnight news, earnings, institutional demand, or futures market movement has overwhelmed both supply and resting liquidity. A Gap Up leaves a void on the chart because no transactions occurred in the price region between the previous closing price and the new opening price. The absence of trading means that no bid–ask matching occurred in that range, producing a zone that the market often returns to later to test. Some gaps fill quickly because traders rush to neutralize positions; others may remain open for weeks or months if the imbalance reflects genuine repricing based on strong fundamental catalysts. Just like FVGs and Volume Imbalances, Gap Ups represent a form of skipped auction — a price region where execution did not unfold in the usual incremental fashion.
Although Fair Value Gaps, Volume Imbalances, and Gap Ups look different, they share a common logic rooted in the auction model of market behavior. When price moves vertically rather than horizontally, the market shifts from balance to imbalance — from negotiation to urgency. A large institution executing a buy program may aggressively lift offers until enough liquidity is filled, leaving behind a gap in trading activity. Similarly, fear-driven selling may sweep through multiple price levels where no buyers remain, creating bearish FVGs or dramatic Gap Downs. These imbalances are not anomalies; they are signals of dominant directional pressure during that moment. However, the market is not designed to remain permanently imbalanced. Eventually, price seeks out these regions because they contain clusters of unfilled orders, trapped positions, or inefficiently delivered value that the auction must resolve. This is why imbalances often become future reaction zones, and why traders use them strategically to anticipate pullbacks or continuation setups rather than to chase runaway momentum.
The difference between the imbalance types lies not in the underlying principle but in their context and timescale. Fair Value Gaps most frequently appear within trending intraday or swing structures when displacement accelerates. Volume Imbalances can develop at any time — even in visually small candlesticks — because the imbalance is hidden in tape activity rather than price movement. Gap Ups typically reflect external catalysts and session-to-session repricing rather than intraday order flow. Yet all three reveal similar trader psychology: urgency replaces negotiation, emotion replaces patience, and liquidity is consumed faster than it can replenish. Whether this urgency comes from institutional buying pressure, panic selling, short squeezes, news shocks, or forced liquidation, price movement becomes temporarily inefficient until the auction resets.
These imbalance concepts gain deeper meaning when combined with market structure. When price is trending upward, Fair Value Gaps below the trend often become discount retracement zones where buyers re-enter without chasing price. When a bearish imbalance forms above price during a downtrend, retracements into the gap become premium distribution zones where sellers optimize entry. Volume Imbalances within displacement legs likewise serve as checkpoints where price often reacts. Gap Ups frequently become support zones if the bullish trend remains intact because institutional orders that caused the gap generally remain interested in defending those levels. Understanding market structure allows traders to see where imbalances align with continuation (trend-friendly) or reversal (trend-exhaustion) conditions.
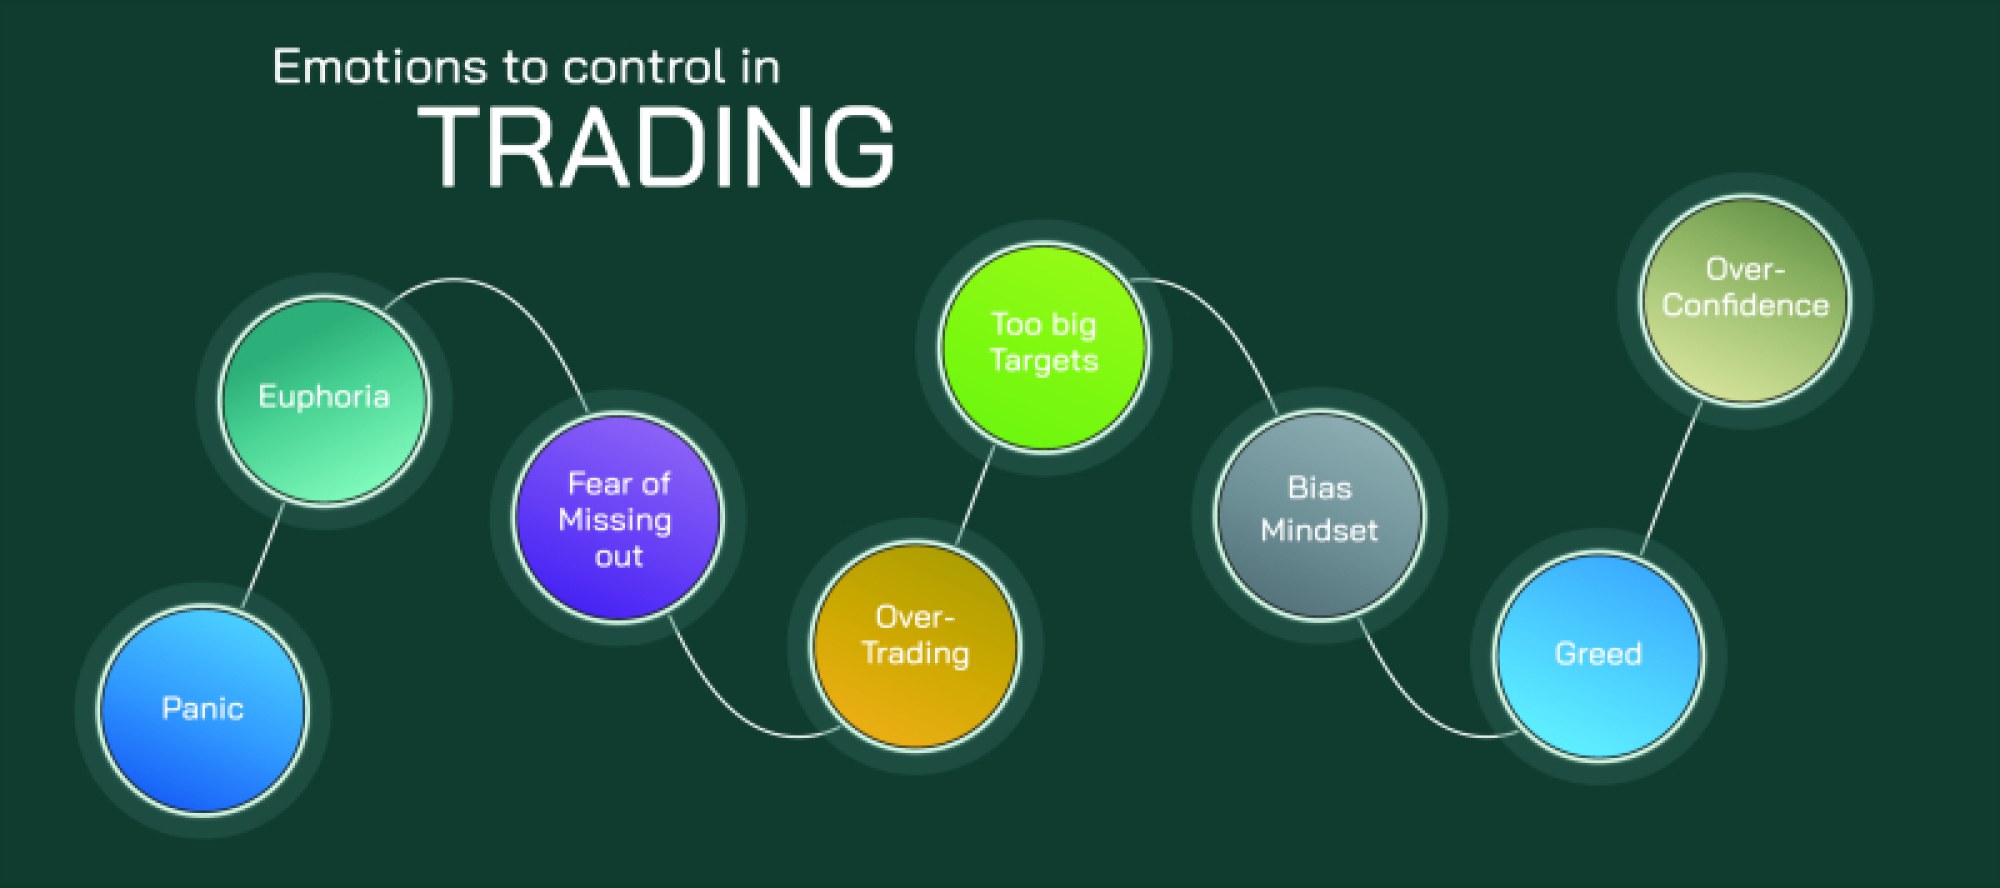
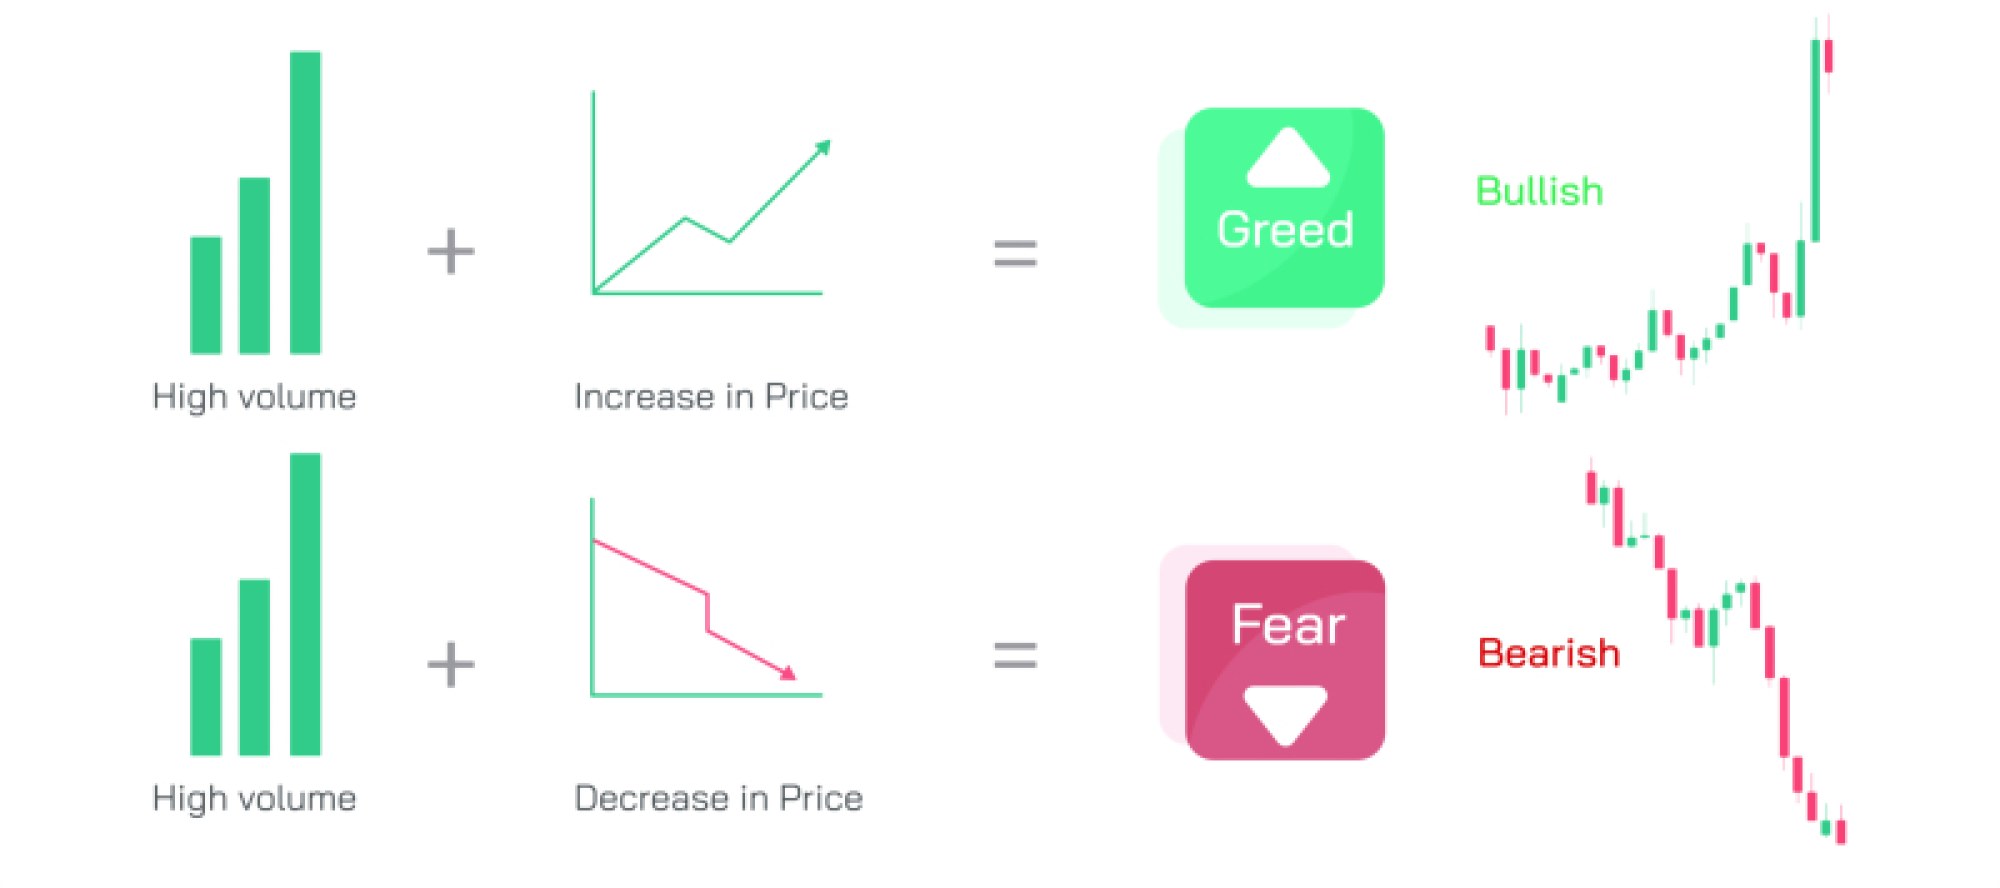
The psychological dimension of imbalance helps explain why price does not travel in straight lines forever. After an explosive move, traders who missed the move experience frustration, traders already in profit experience greed, and traders stuck on the wrong side experience fear. These conflicting emotions create liquidity because different participants either chase, take profit, or stop out. The market uses imbalance zones as destinations to trigger these emotional decisions, gather liquidity, and build energy for the next displacement. Imbalances therefore do not merely highlight where price moved quickly; they highlight where the crowd will likely respond when price returns.
Taken together, Fair Value Gaps, Volume Imbalances, and Gap Ups paint a cohesive picture of how price behaves when equilibrium temporarily breaks. Fair Value Gaps show visually skipped price delivery inside the session. Volume Imbalances show skipped auction internally through order distribution. Gap Ups show skipped price delivery across sessions due to overwhelming overnight urgency. All three reveal the fingerprints of institutional involvement and the temporary abandonment of balance, and all three become magnets for price later because markets continuously rotate between imbalance and equilibrium as part of natural liquidity cycles. When traders understand this rhythm, charts stop appearing as a confusing sequence of unpredictable candles and instead become structured maps of where liquidity was skipped and where liquidity may next be delivered — revealing the deeper logic behind price action rather than the surface noise of volatility.