Three Black Crows Candlestick Pattern — Bearish Reversal Signal in Stock Market Charts Explained
The Three Black Crows candlestick pattern is one of the most powerful and widely respected bearish reversal signals in technical analysis because it captures a decisive shift in control from buyers to sellers over a sequence of three consecutive trading sessions. Rather than signaling a gradual and subtle change in price behavior, the pattern conveys a sharp psychological reversal: a market that once reflected optimism, rising prices, and confident buying momentum suddenly turns into an environment of heightened selling pressure, weakening sentiment, and fading bullish conviction. What makes the pattern meaningful is not merely the appearance of three red candles in a row, but the way they form in relation to trend, structure, and market psychology. When the Three Black Crows appear, they do not simply show declining price—they reflect an aggressive transition in which buyers not only fail to lift price but lose control of the auction to persistent and organized selling. Because the pattern unfolds at the top of an uptrend or near a resistance zone after sustained bullish sentiment, it provides traders with an early indication that the prior uptrend is likely ending and that a bearish leg or deeper correction may be unfolding.
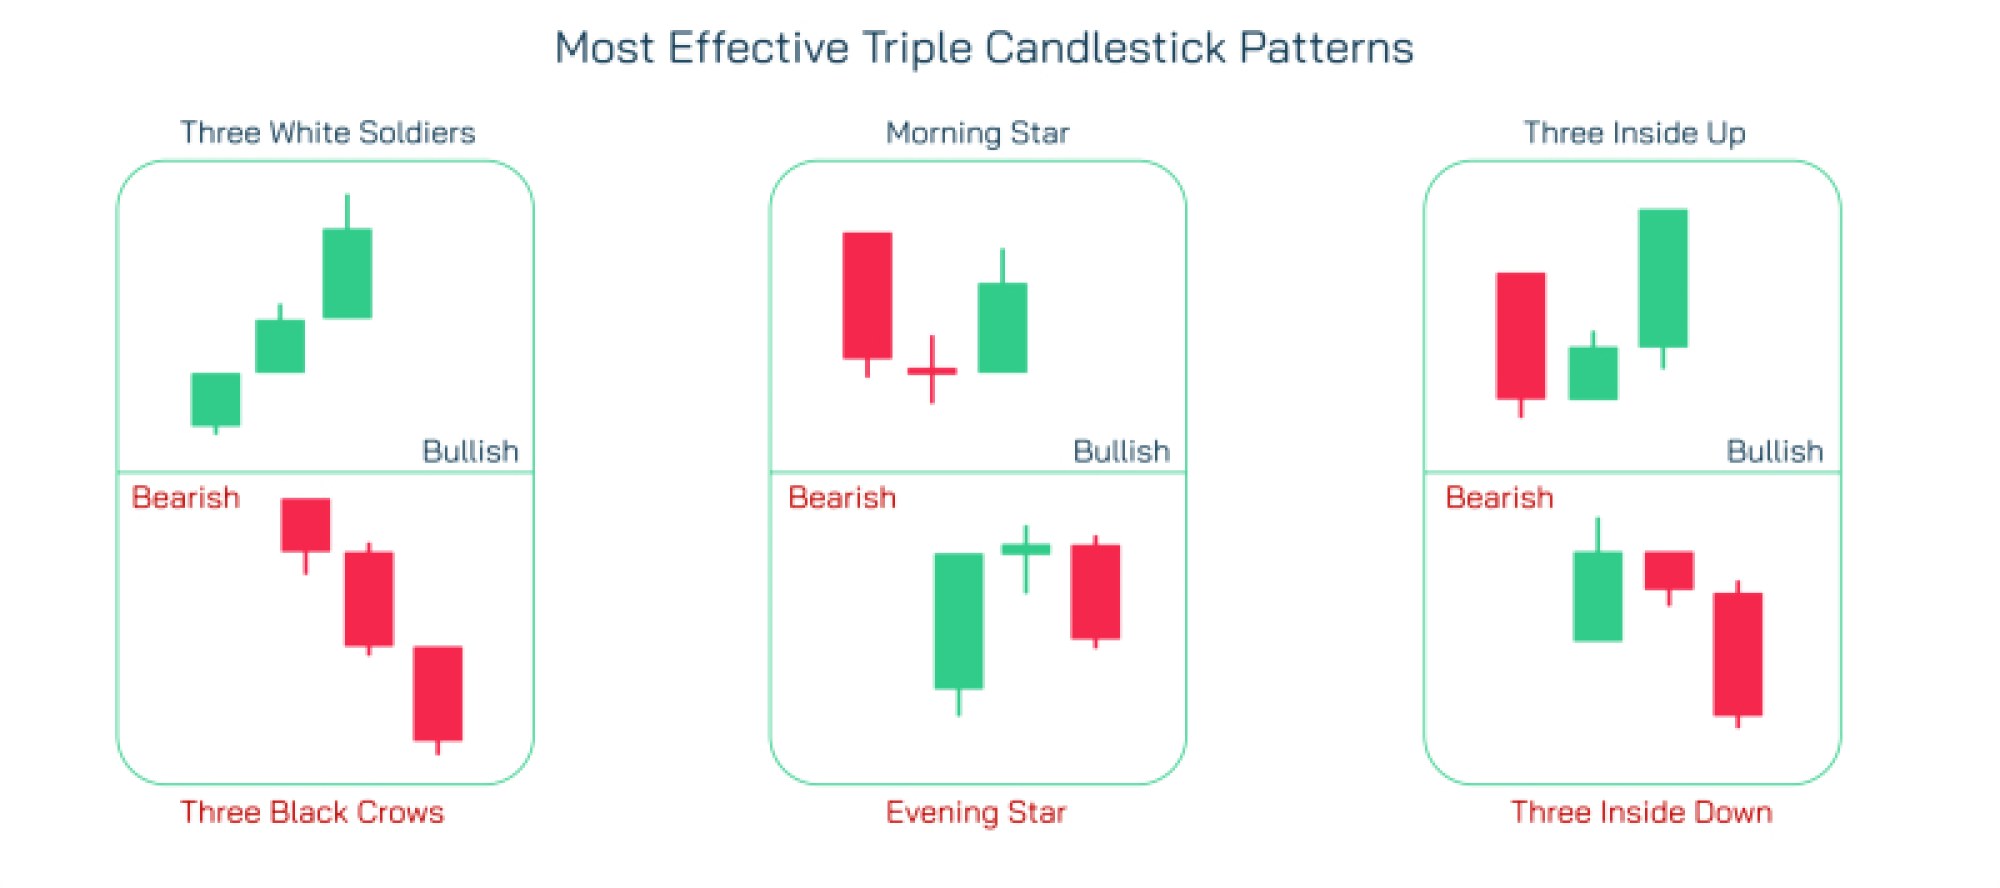
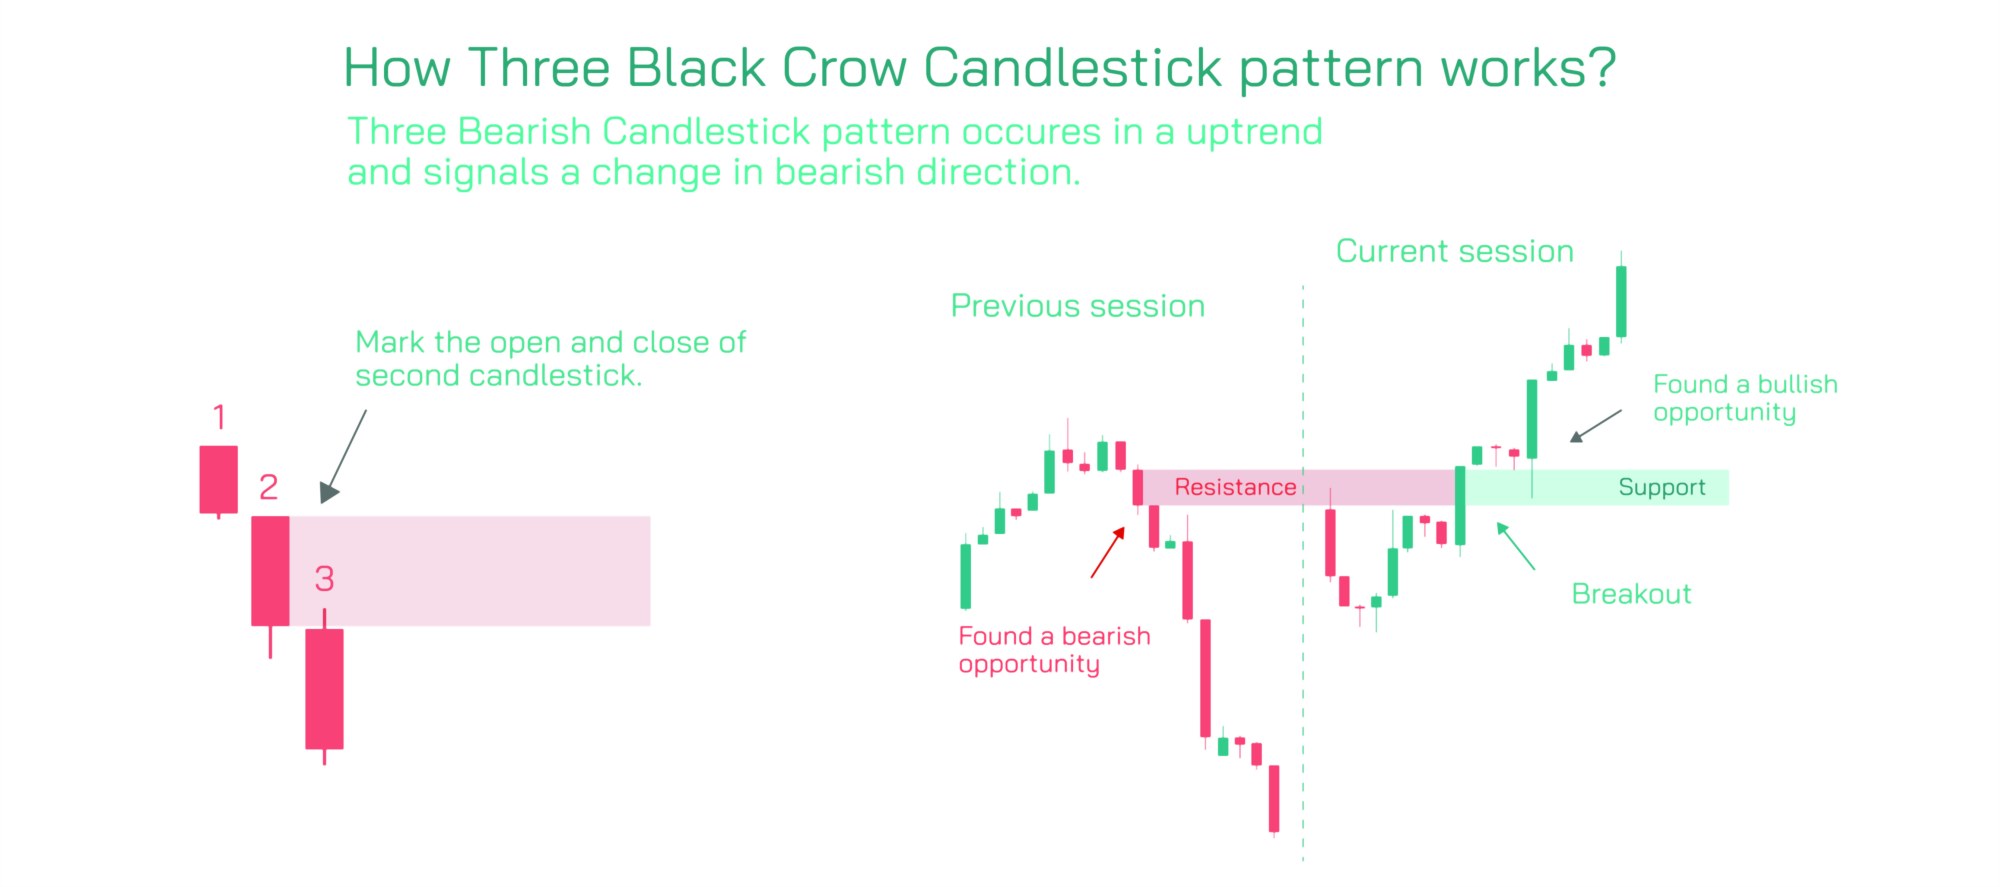
At the structural level, the Three Black Crows formation is defined by three large consecutive bearish candles that open within or slightly above the body of the previous candle and close near or at their lows. Each candle should display full-bodied bearishness, meaning little to no lower wick, because a small or absent lower shadow demonstrates that sellers remained in control throughout the session rather than losing pressure near closing time. The size and consistency of these candles carry psychological meaning: the first candle shows that sellers have disrupted the bullish trend by overwhelming buying pressure and closing significantly lower; the second candle confirms that the shift is not temporary, demonstrating that buyers attempted but failed to recover price; and the third candle amplifies the bearish sentiment by showing that not only are sellers in control, but buyers have now lost confidence and are stepping away from active participation. The cumulative effect of three such candles draws a clear contrast to the prior bullish activity, illustrating that demand is no longer willing or strong enough to support higher prices.
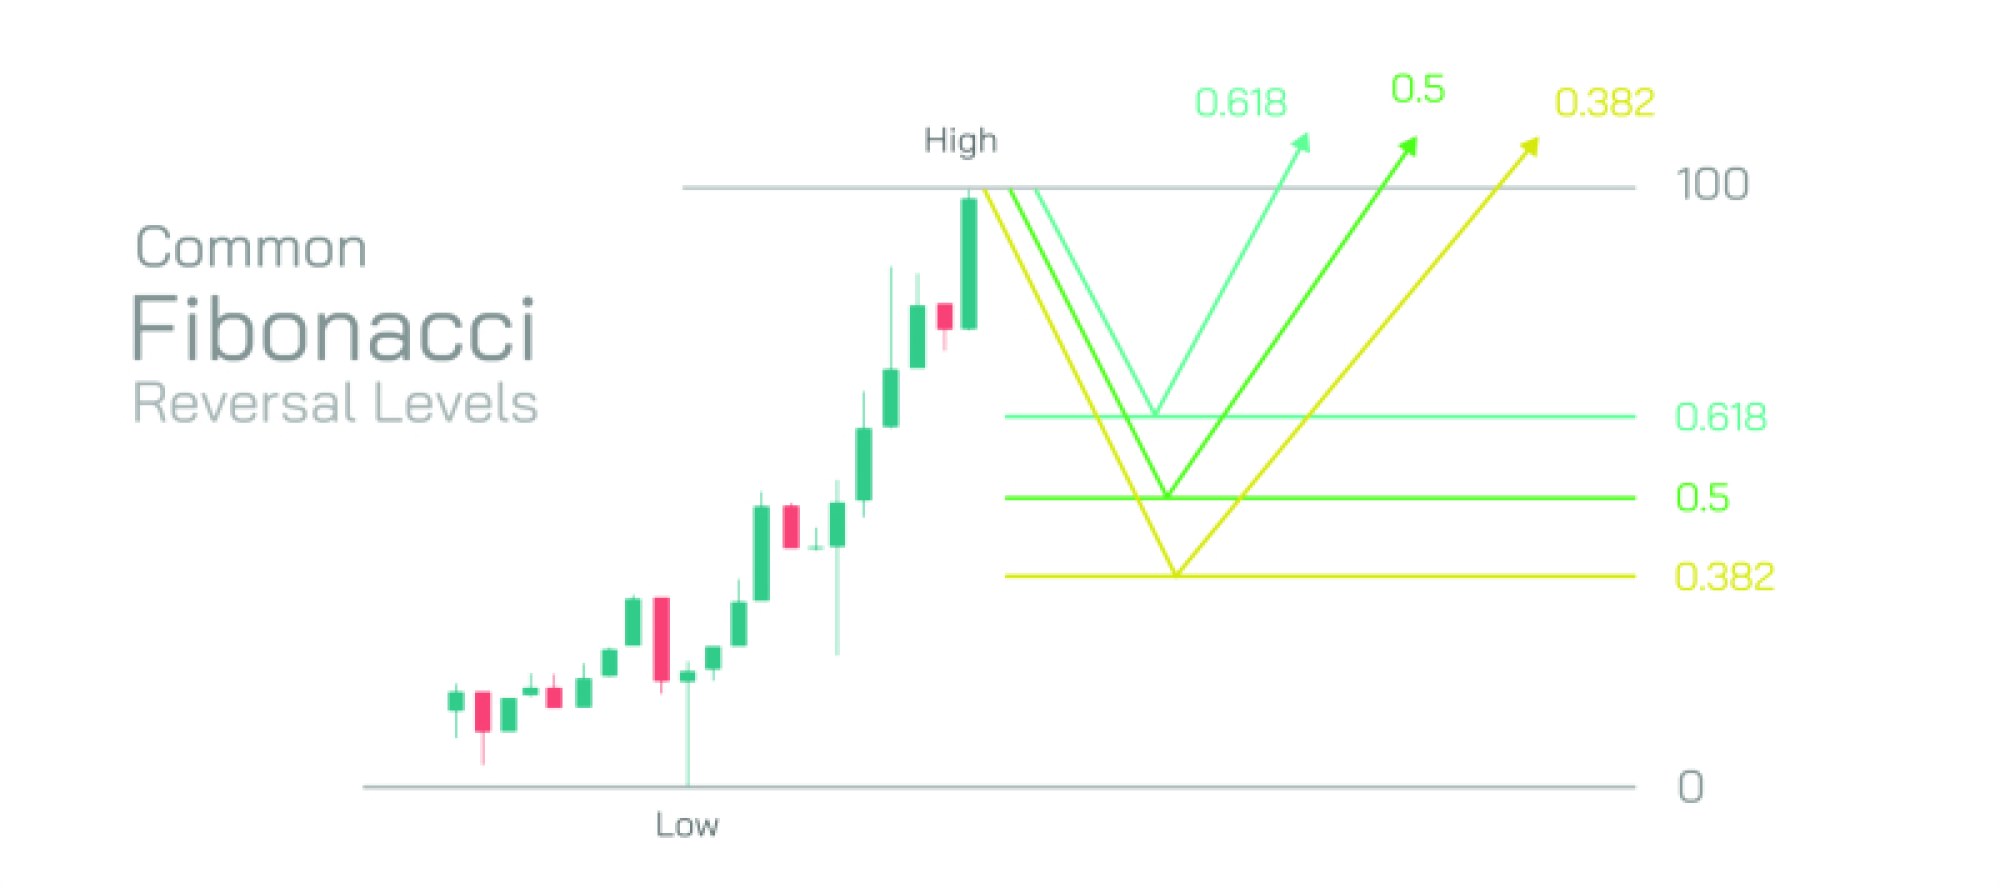
However, the Three Black Crows pattern cannot be evaluated in isolation, because its interpretation depends heavily on context. The most reliable signal occurs when the pattern develops after a prolonged uptrend, after a breakout attempt that fails, or after an overbought market condition where price has extended too far, too fast. In these circumstances, the Three Black Crows serve as a narrative of trend exhaustion: bullish traders who were comfortably in profit begin taking gains, late buyers who entered near the top are now trapped in losing positions, and short sellers recognize weakening sentiment and begin entering with increasing confidence. If the pattern appears near a well-defined resistance level such as a previous swing high, Fibonacci extension, supply zone, psychological round number, or major moving average, the pattern gains even greater weight because it coincides with a location where sellers historically emerge. The pattern therefore represents not simply three candles but an alignment of structure, psychology, and liquidity in which buyers lose conviction and sellers gain dominance.
Behind the visual structure of the pattern lies a deeper psychological story. The first large bearish candle is the emotional turning point where overconfidence begins to crack. Buyers who were comfortable holding positions now experience discomfort as price closes sharply lower. Some bullish participants choose to ignore the signal, rationalizing the drop as a temporary dip, but others begin to exit, adding to selling pressure. The second bearish candle shatters hope of an immediate rebound, as buyers attempt to rally the price early in the session but fail to hold momentum. By the end of the second candle, confidence among bullish traders weakens dramatically because the idea of a small correction now evolves into the possibility of trend reversal. The third bearish candle completes the psychological shift by demonstrating that sellers remain dominant and that buyers have little willingness to defend support levels. After this third candle, many traders who delayed exiting positions begin closing them, accelerating downward momentum and fueling the reversal further. In effect, the Three Black Crows reflect not just a chart formation but a behavioral loop where hesitation becomes fear and fear becomes capitulation.
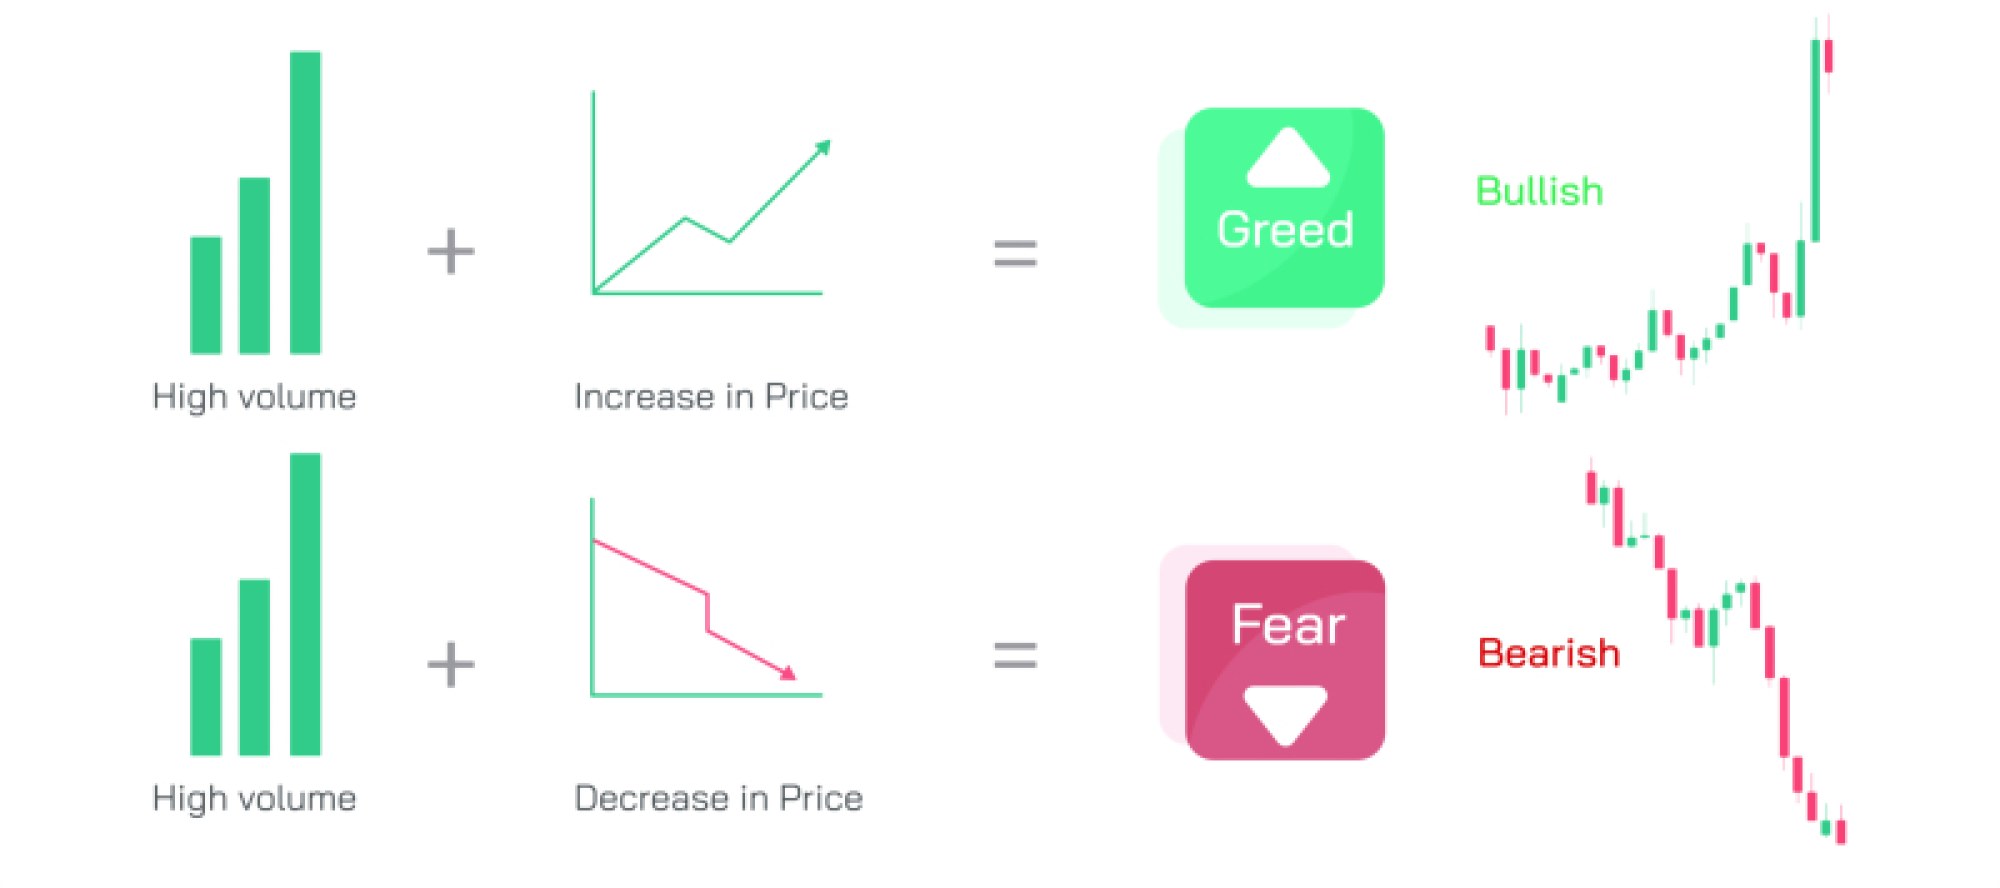
The Three Black Crows pattern also interacts with liquidity and volume behavior in ways that deepen its reliability. When volume increases during the formation of the pattern, the bearish reversal signal becomes far more convincing because selling pressure is backed by real capital, not just temporary price fluctuation. In contrast, if the pattern forms on unusually low volume, the signal may reflect a lack of buyers rather than active selling—an important distinction because declines driven by inactivity may fade quickly once buyers return. Similarly, if the pattern forms after a liquidity grab or a stop-hunt event—such as a breakout above previous highs that quickly reverses—the pattern becomes especially potent because it shows that institutions may have used the breakout to trap late buyers before aggressively absorbing liquidity on the sell side. When Three Black Crows appear immediately after a false breakout, the pattern exposes a failed bullish continuation attempt and transitions into a bearish trending move powered by trapped traders and renewed momentum.
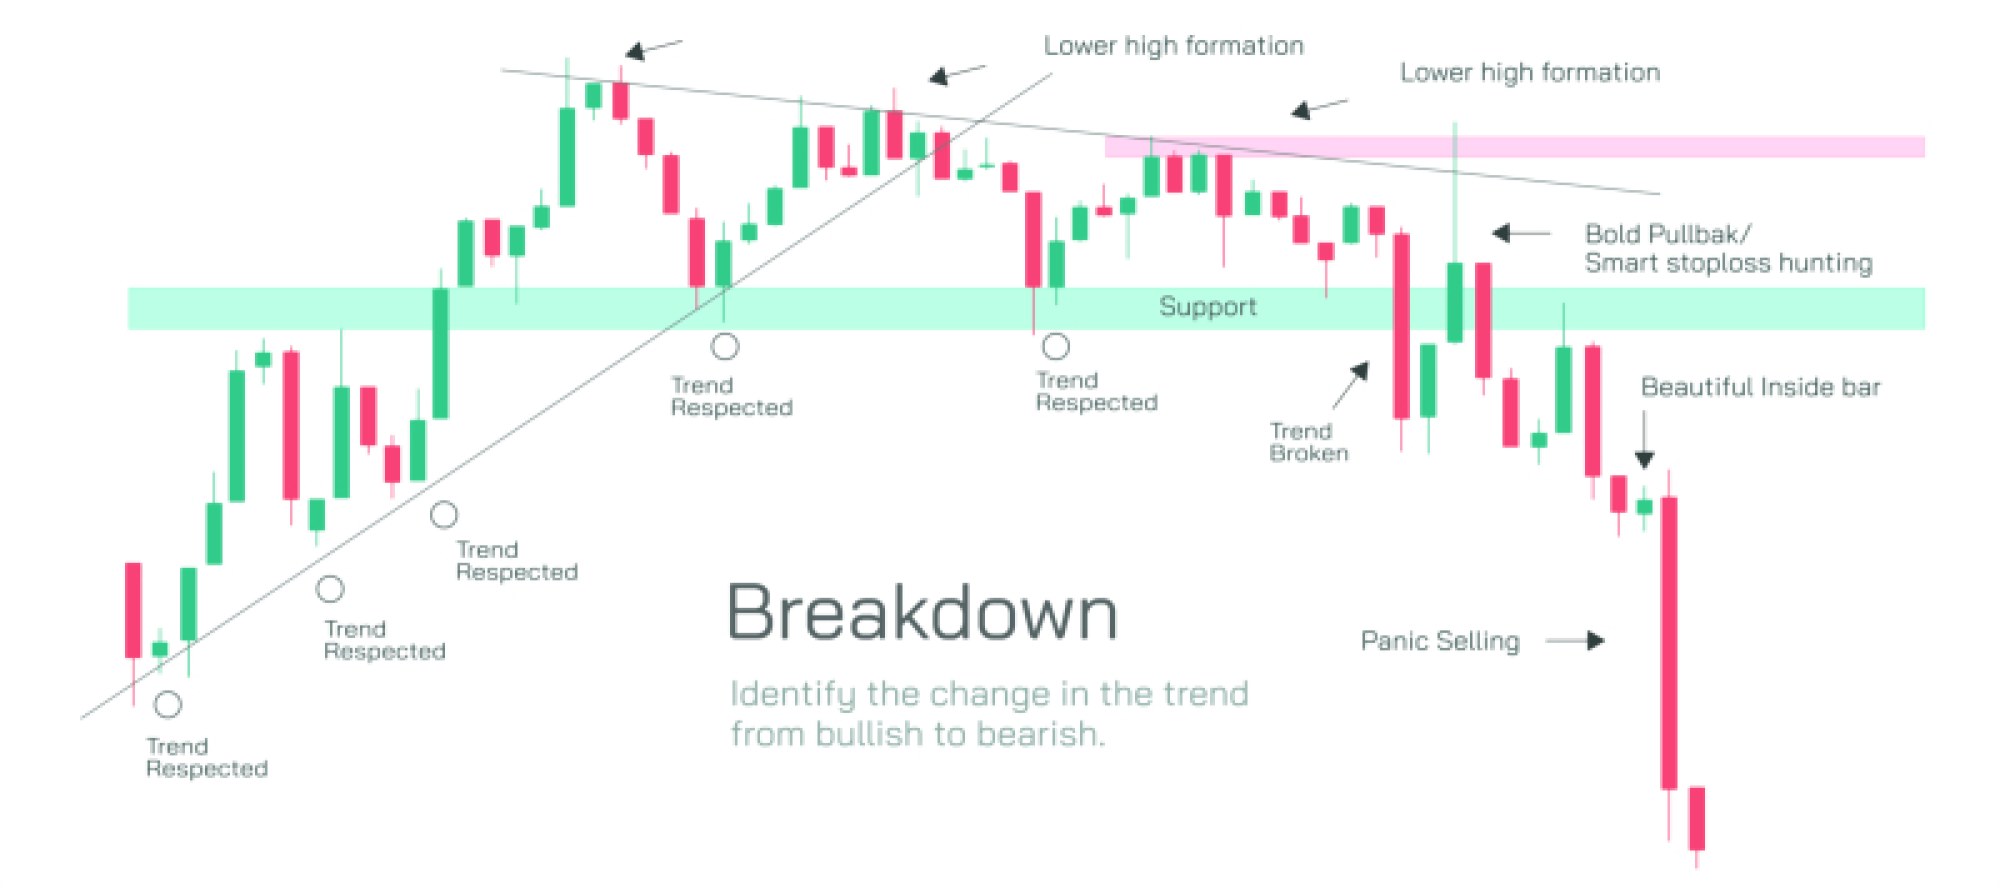
Although the Three Black Crows pattern signals bearish strength, professional traders avoid entering blindly on the third candle because the sequence itself may leave the market temporarily oversold. Momentum-based entry without structure may result in poor timing because after three large bearish candles, price may consolidate, form a pullback, or retest broken support before continuing lower. For this reason, traders combine the pattern with confirmation factors such as market structure breaks, pullback rejection, supply zone reaction, moving average crossovers, or retests of previous support becoming resistance. When price pulls back modestly after the Three Black Crows and fails to produce bullish follow-through, the reversal becomes even more credible. Likewise, breaking the previous swing low or trendline validates that the prior uptrend is no longer intact. In other words, the Three Black Crows pattern signals internal weakness, and subsequent structural confirmation signals external breakdown.
The pattern’s reliability also depends on the character of the preceding uptrend. If the prior bullish leg was steep and emotional—driven by news hype, rapid buying, greed, or speculative momentum—the Three Black Crows often mark the beginning of a sharp correction because emotional trends unravel quickly once sentiment flips. If the prior bullish leg was measured, gradual, and supported by steady volume, the Three Black Crows may instead signal the beginning of a slower downtrend or extended consolidation because the initial buying pressure was grounded rather than euphoric. Regardless of the speed of decline, the psychology remains the same: the pattern marks a turning point toward increasing risk aversion among buyers and rising confidence among sellers.
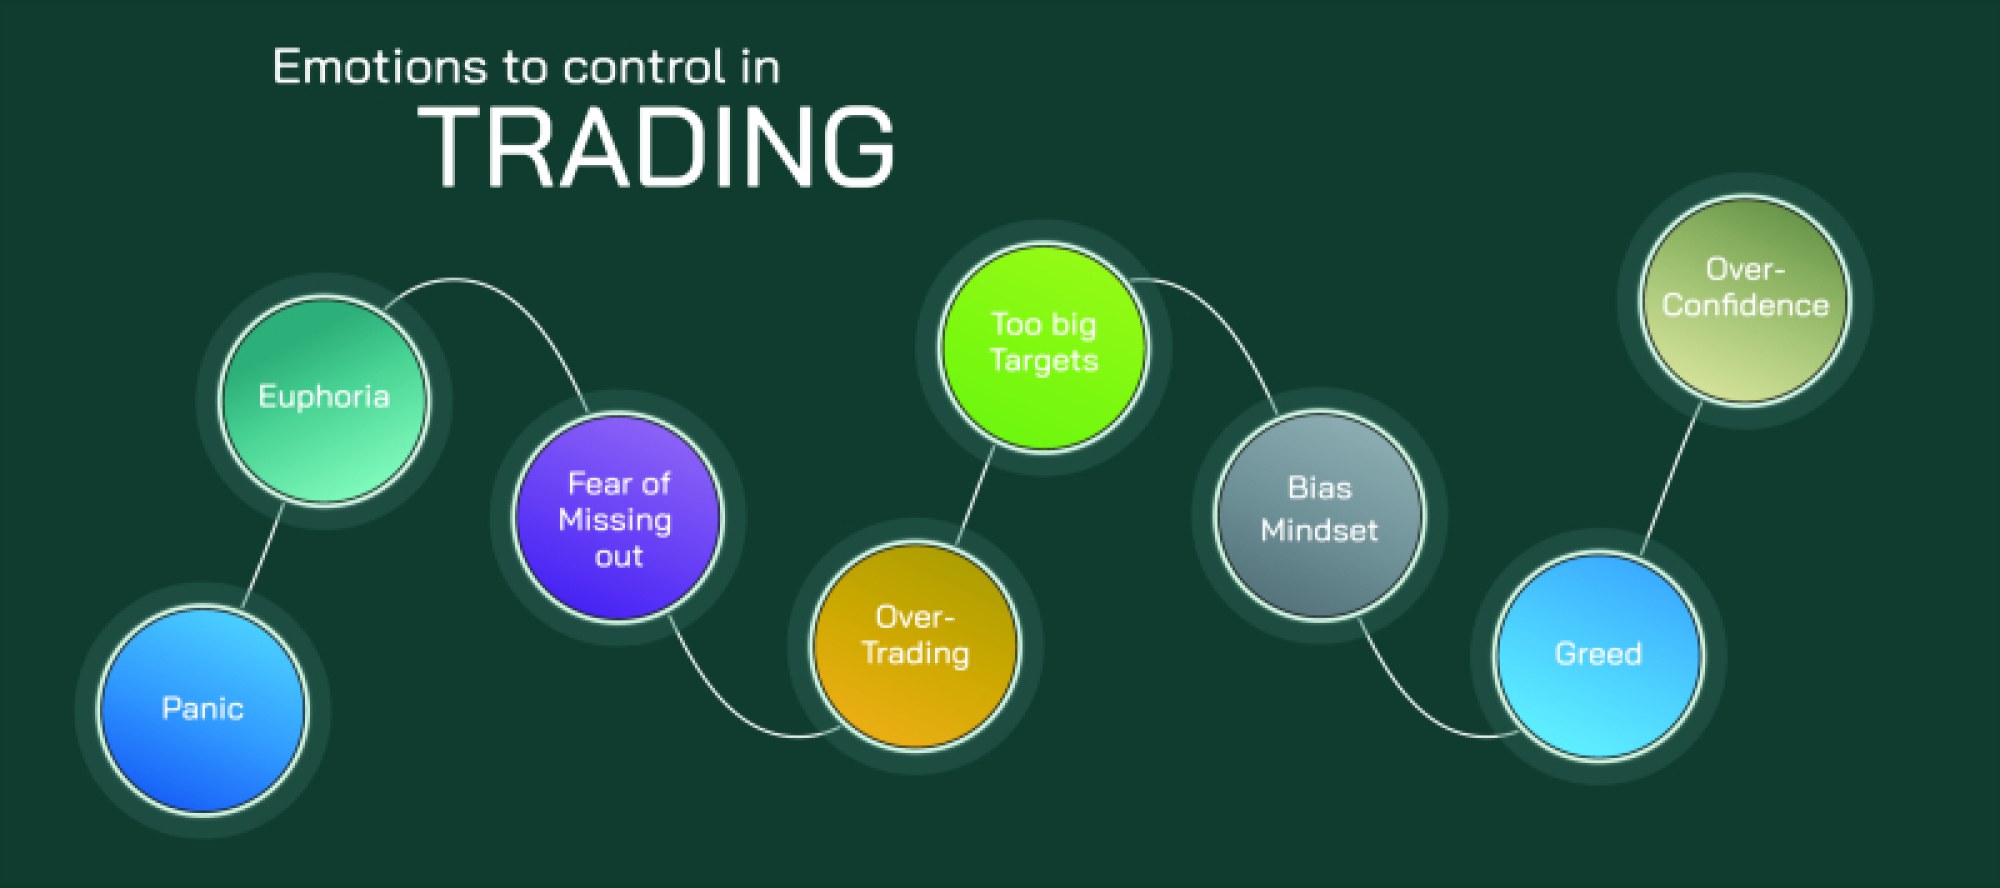
Understanding the Three Black Crows also helps traders avoid common behavioral traps. Many inexperienced traders mistake the first bearish candle as a simple dip to buy, the second bearish candle as a “discount opportunity,” and the third candle as the last chance before the trend “resumes.” This mindset, fueled by the fear of missing out, pushes them into trades at exactly the wrong time. By the time the third crow completes, bearish sentiment has already taken control and these late buyers become liquidity for sellers. Meanwhile, disciplined traders either exit long positions early in the sequence or use pullbacks after the pattern to initiate short positions with defined risk. The difference between success and failure in this context is less about indicator complexity and more about psychological awareness—recognizing when price action tells a story of momentum changing hands rather than clinging to past expectations.
Ultimately, the Three Black Crows candlestick pattern is not simply a signal—it is the visual representation of a shift in dominance, sentiment, liquidity, and market structure. It encapsulates the moment when optimism turns into caution, caution turns into fear, and fear turns into selling pressure. By identifying the pattern within its context—strong preceding uptrend, key resistance level, high volume, structural rejection, or false breakout—traders gain insight not only into price direction but into the psychology and motivation driving the move. Used with confirmation and strong risk management, the Three Black Crows becomes a powerful tool for anticipating bearish reversals and navigating transitions from bull trends into downtrends, revealing how markets repeatedly cycle between confidence and uncertainty as participants compete for value in an ever-shifting landscape.