Stock Market Simple Moving Average (MA) vs Volume Weighted Average Price (VWAP): Trend, Volume, and Institutional Price Analysis Explained
In technical trading, one of the most revealing ways to study the behavior of price is to observe how it fluctuates around statistical averages—not because the market is bound to mathematics, but because averages represent consensus. They show where buyers and sellers agree on value in the midst of volatility. Among the most widely used tools for this purpose are the Simple Moving Average (MA) and the Volume Weighted Average Price (VWAP). Although both appear as smooth lines overlaid on price charts, their meaning, calculation logic, and trading implications differ significantly. The simple moving average shows how price drifts over time by assigning equal weight to every candlestick within a lookback period. VWAP, on the other hand, blends price with volume and shows the average price at which most trading has actually occurred during a session. This difference transforms the application of each indicator within price action. The simple moving average is a tool for observing trend direction, identifying pullbacks, and smoothing the noise of volatility across time. VWAP is a tool for evaluating institutional participation, determining fair value within the current session, recognizing premium and discount conditions, and mapping whether price is auctioning above or below the mean where the majority of trades have taken place. Both serve as anchors for market interpretation, yet each reveals a different version of truth: MA reflects directional drift over time, while VWAP reflects where the market has committed actual capital.
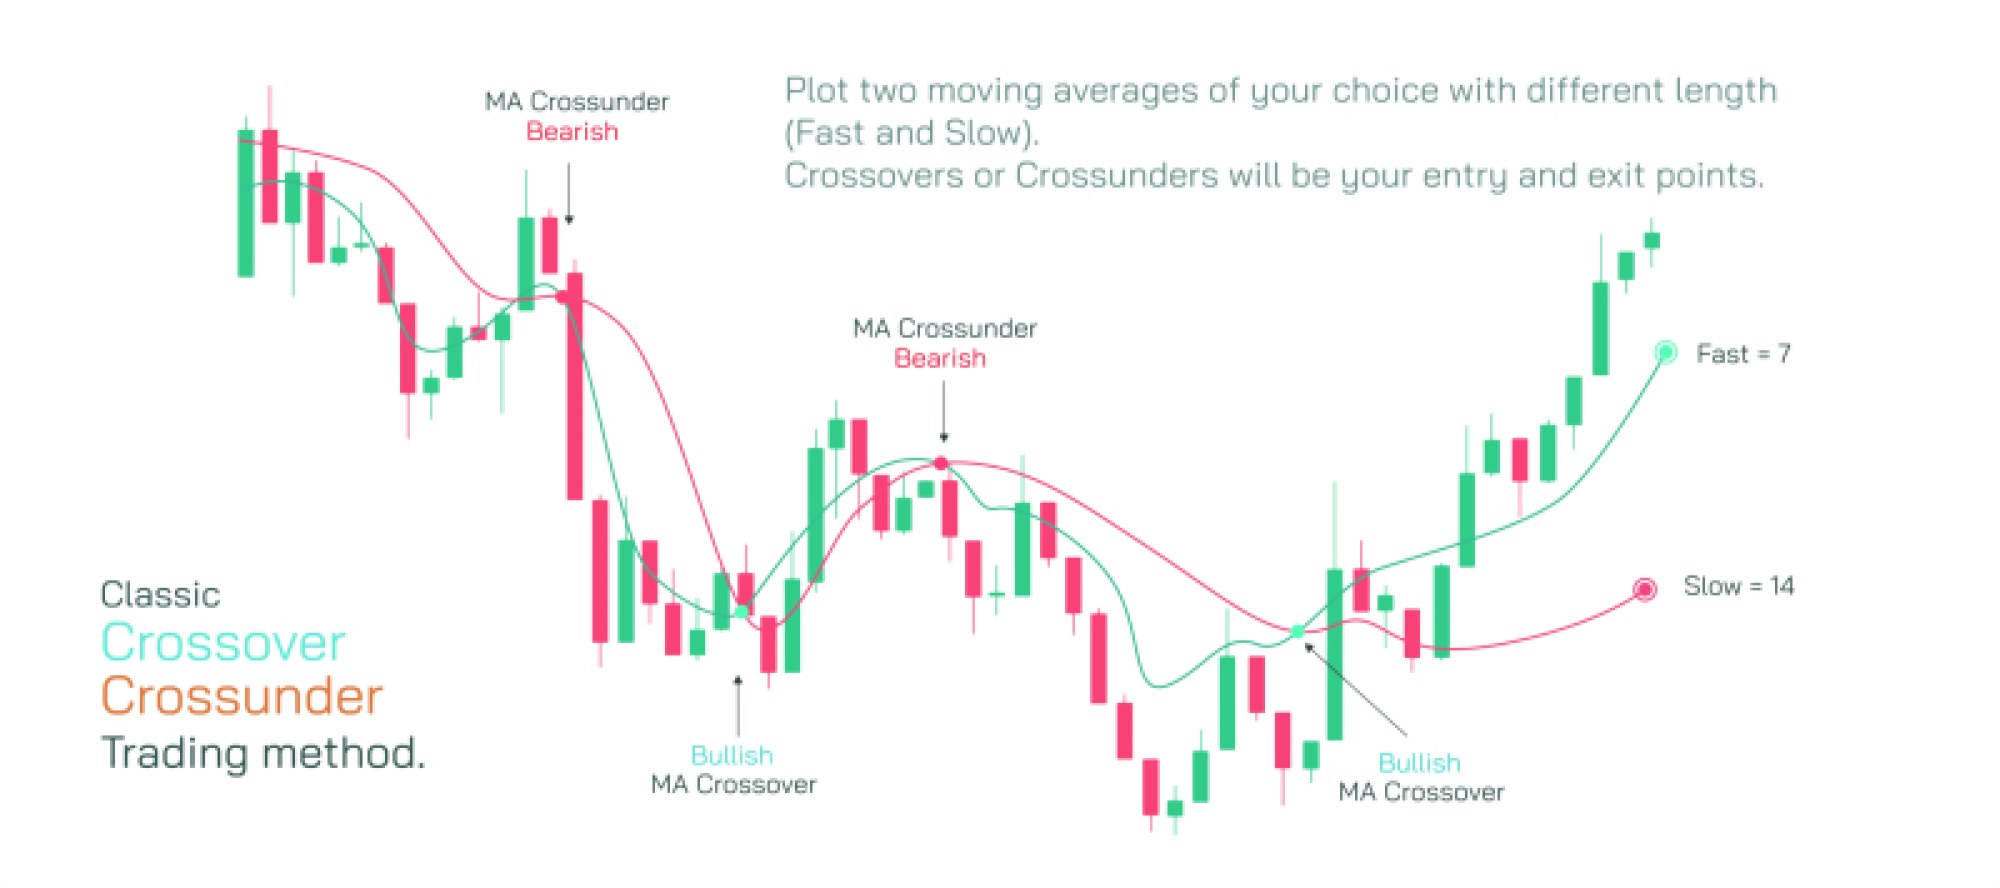
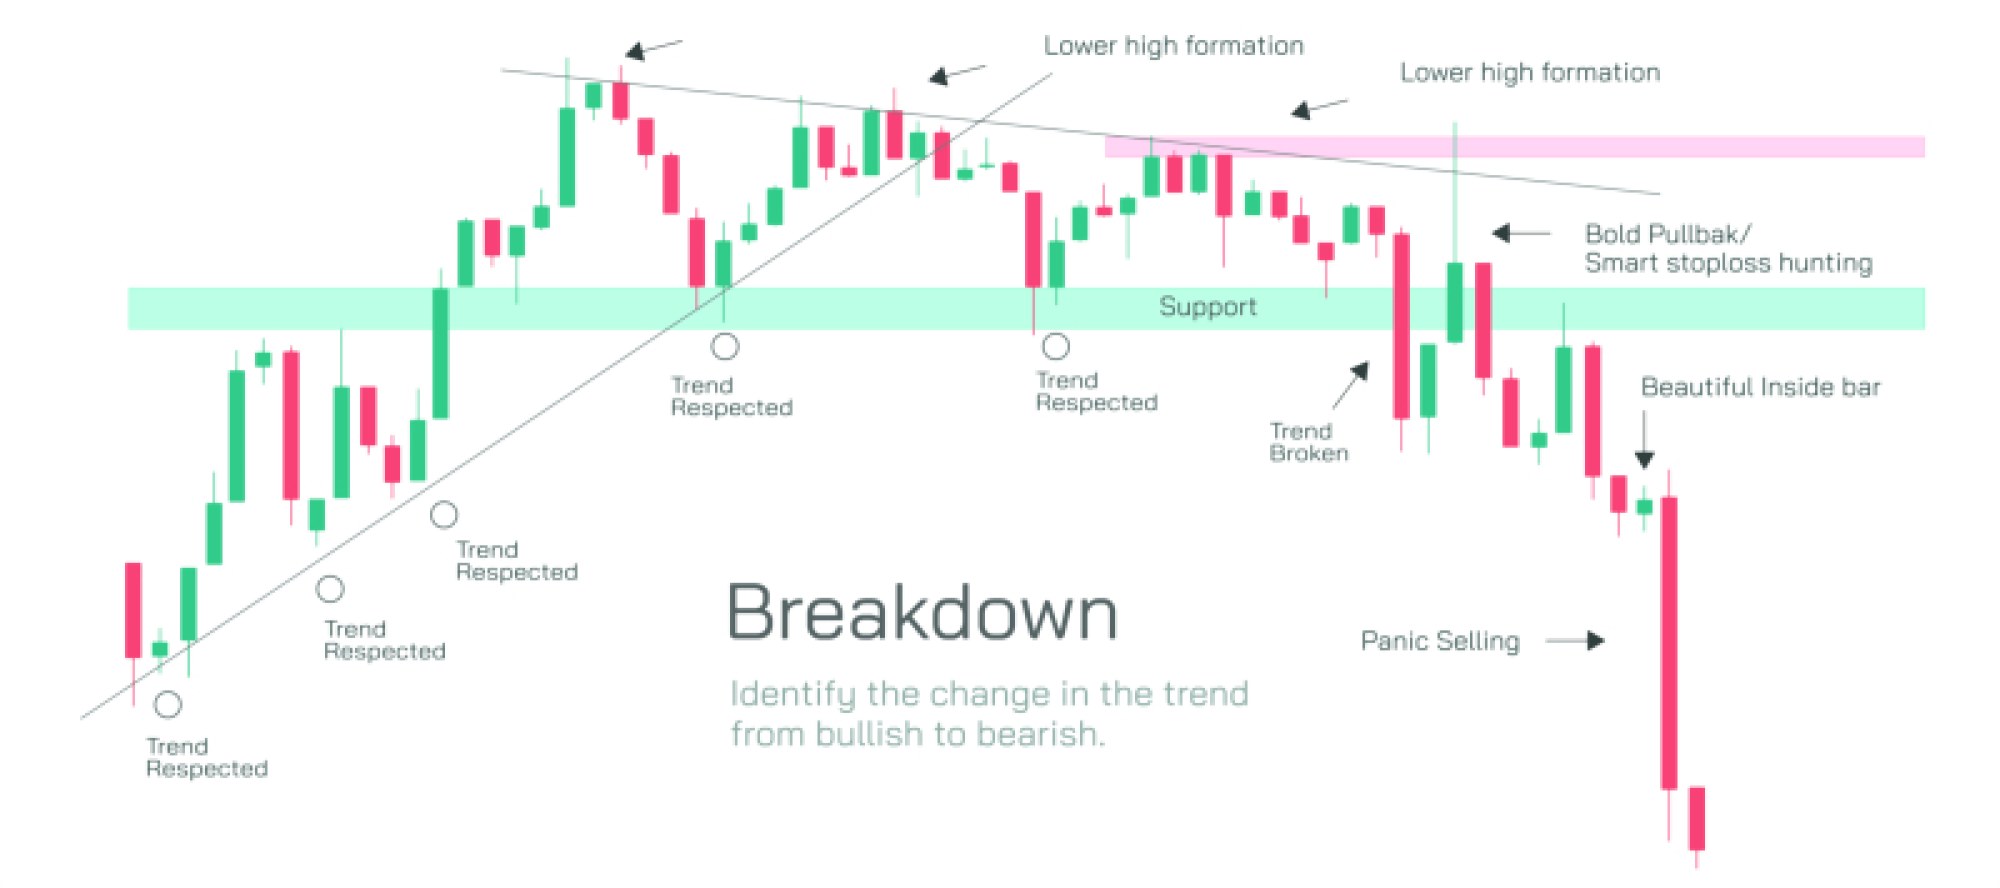
200. Because each price point in the calculation carries equal weight, the MA smooths short-term fluctuations and highlights the broader directional tendency of the market. Traders look at the slope of the MA to gauge the trend. If the MA is rising, price is generally trending upward; if it is declining, price is trending downward. The position of current price relative to the MA adds valuable context. When price floats above the MA in an uptrend, retracements back toward the average often act as swing entry opportunities for trend continuation. When price sits below the MA in a downtrend, rallies into the average often function as selling zones for continuation. The MA itself does not force price to reverse, but it reflects where many buyers and sellers recalibrate expectations, creating rhythm in trending markets. Because different lookback periods produce different responses, short MAs track recent momentum while long MAs track overall market bias, and the interaction between the two commonly forms the basis of crossover signals.
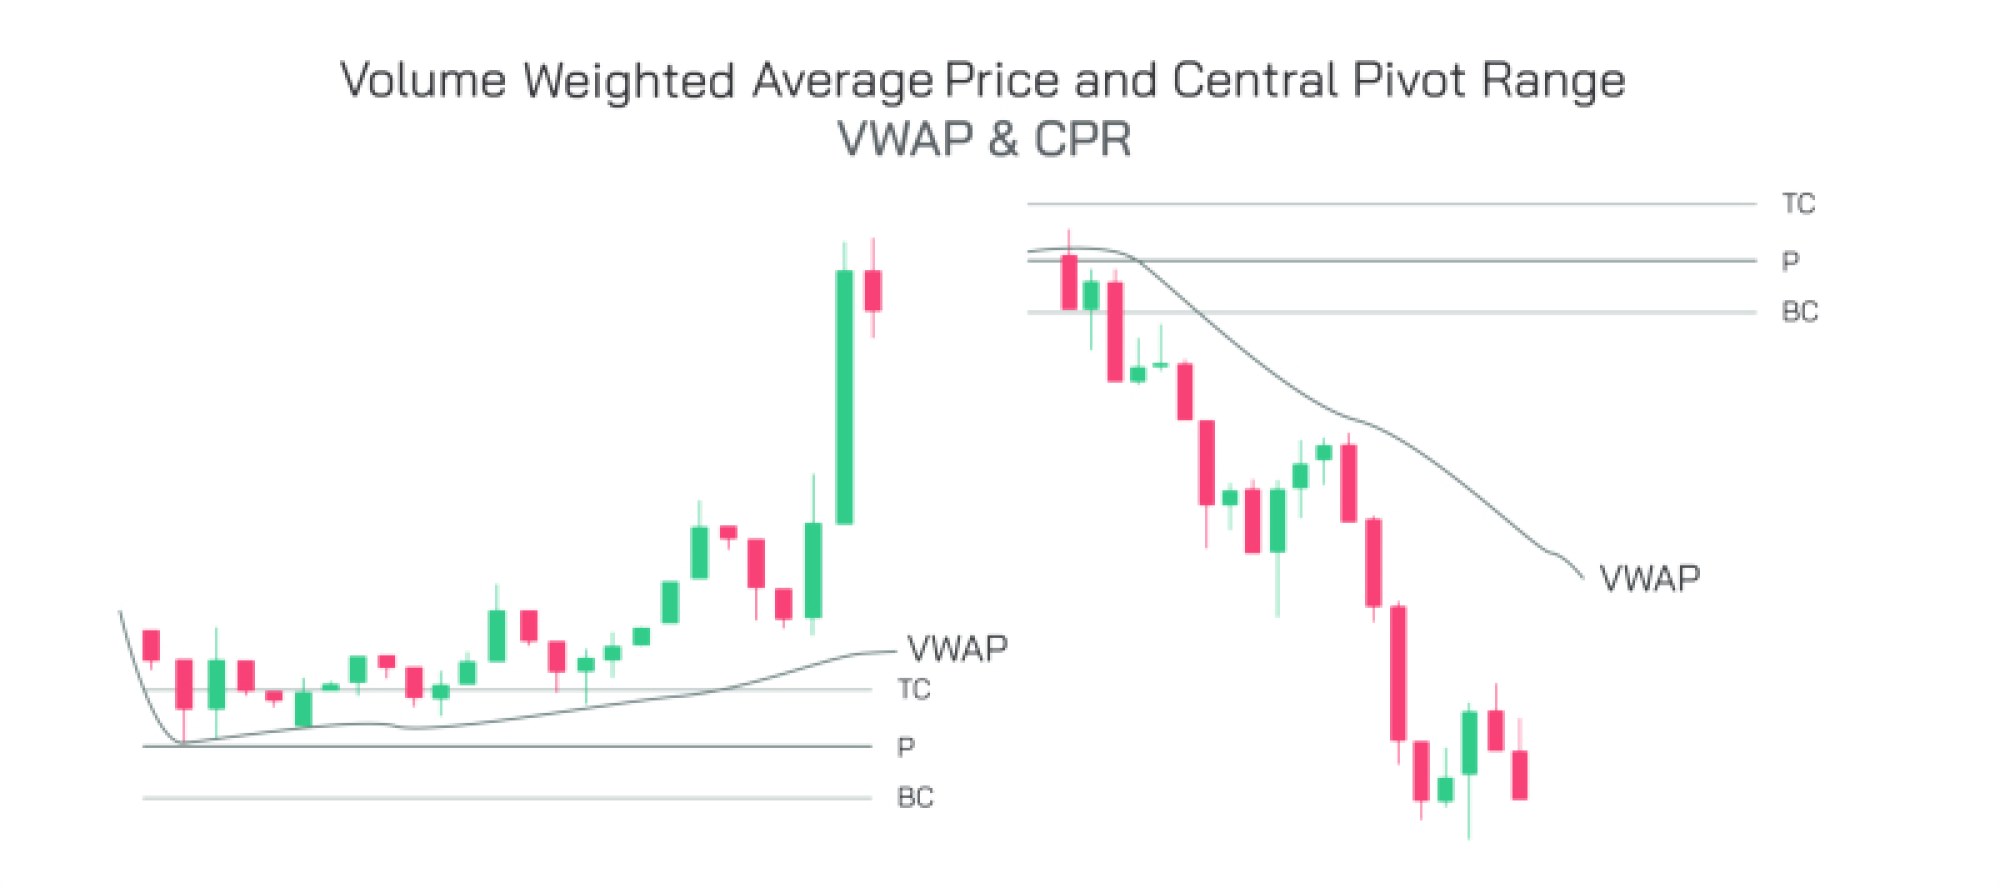
Despite their usefulness, MAs have limitations because they treat every candle equally. A price spike on low volume has the same influence on the MA as a bar with heavy institutional activity. The moving average reflects time-weighted information, not money-weighted information. Thus, while the MA effectively smooths price over time, it cannot distinguish whether a price level reflects meaningful participation or merely temporary fluctuation. This is where VWAP becomes distinct and powerful. VWAP does not simply show the average price—it shows the average price at which most of the volume actually traded. It multiplies price by volume for each candle, accumulates the total, and divides by total volume. VWAP resets at the beginning of each trading session, rather than rolling endlessly like a moving average, because its role is to define the fair value of that particular session rather than long-term sentiment. The result is a dynamic real-time line that shows where the bulk of money has been exchanged during the day. Unlike an MA, VWAP often acts as a magnet because institutions frequently benchmark execution efficiency against it. When price moves too far above VWAP, traders view it as a premium—an area where the market may be overpaying. When price dips too far below VWAP, traders view it as a discount—an area where buyers may step in because price has deviated excessively from fair transactional value.
The strategic contrast between MA and VWAP becomes clearest when observing institutional behavior vs. retail behavior. Retail traders tend to use moving averages to track trends and time entries or exits. Institutions, however, use VWAP to measure whether they are receiving favorable fills when deploying large capital. Accumulation programs often prefer to accumulate below VWAP because it reflects a lower-than-average price for the session. Distribution programs often prefer to sell above VWAP because it reflects a higher-than-average price. VWAP therefore reveals not only a price average but also an invisible battlefield between smart money accumulation and distribution. When price remains above VWAP for most of the session, it signals bullish control; when below, it signals bearish control. When price oscillates tightly around VWAP, it indicates balanced trade where neither side has clear dominance. When price pulls sharply away from VWAP in trending conditions, it reflects strong directional imbalance driven by aggressive participation from one side.
The moving average is slow to react; VWAP is sensitive to volume. This difference transforms how price behaves around each indicator. Retracement into a rising MA in an uptrend often signals a healthy pullback and a continuation opportunity, especially if a higher low forms. But if price retraces into VWAP in a strongly trending market, VWAP often functions as an acceleration point—where returning order flow fuels the next impulse leg because institutional traders use VWAP dips to add to long positions or VWAP spikes to add to short positions. On the other hand, when the market is not strongly trending, price repeatedly reverts to VWAP because it represents the equilibrium point of supply and demand for the session. In contrast, the MA tends to lose relevance in choppy markets because it generates frequent whipsaw signals when trend is weak or inconsistent. Thus, MA thrives in smoothing trending movement across time, while VWAP thrives in identifying volume-driven fair value within the current auction.
Both indicators deepen when traders integrate them with market structure rather than isolating them. In an uptrend, if price stays above both the MA and VWAP, momentum is strong and pullbacks often produce continuation. If price remains above the MA but below VWAP, the market is still in a long-term uptrend but is experiencing intraday weakness. If price is above VWAP but below the MA, momentum may be building for a larger reversal upward if structure aligns. When price sits below both, sellers dominate over both time and volume. These combinations help traders navigate whether a move is shallow rotation or meaningful shift in control. The most explosive moves occur when price breaks above or below VWAP and pushes through MA structure simultaneously, because both time-weighted and volume-weighted trends align.
Ultimately, the comparison between MA and VWAP reflects the dual nature of markets: time and participation. The moving average smooths price over time to reveal broad directional drift. VWAP anchors price to the level where most money has actually been exchanged in the current auction. Trend traders rely on MA to ride trends; institutional and intraday traders rely on VWAP to evaluate fair value, liquidity, and execution. Used together, they reveal not just where price is moving, but why. MA shows whether the market has drifted bullish or bearish across sessions; VWAP shows whether buyers or sellers control the current session where real capital is flowing. When traders view charts through both perspectives, price stops appearing as unpredictable noise and begins to reveal the deeper negotiation between long-term bias and real-time volume pressure—between momentum and value, between trend and liquidity, between the passage of time and the commitment of capital.