Fair Value Gap (FVG) and Implied Fair Value Gap (IFVG): Understanding Liquidity, Market Structure, and Price Inefficiency in Candle Charts Explained
In modern price action theory and institutional trading models, the concepts of Fair Value Gaps (FVG) and Implied Fair Value Gaps (IFVG) have become essential for understanding how the market seeks equilibrium between buyers and sellers. These ideas come from the observation that price movement is not perfectly efficient; price does not always trade through every level in a smooth and balanced manner. Instead, certain moves happen so aggressively that the market fails to allow equal participation from both sides of trade, leaving behind untested regions on the chart. These untested regions signify inefficiency in price delivery and often draw price back later because the market naturally gravitates toward levels where business was left incomplete. Fair Value Gaps and Implied Fair Value Gaps help explain not only why price travels in rapid directional bursts but also why the market so frequently retraces to fill or mitigate these zones before continuing its trend. Like a footprint left behind by heavy institutional order flow, an FVG or IFVG acts not as a prediction mechanism but as a structural clue about where liquidity has not yet been exchanged and where price may later rebalance.
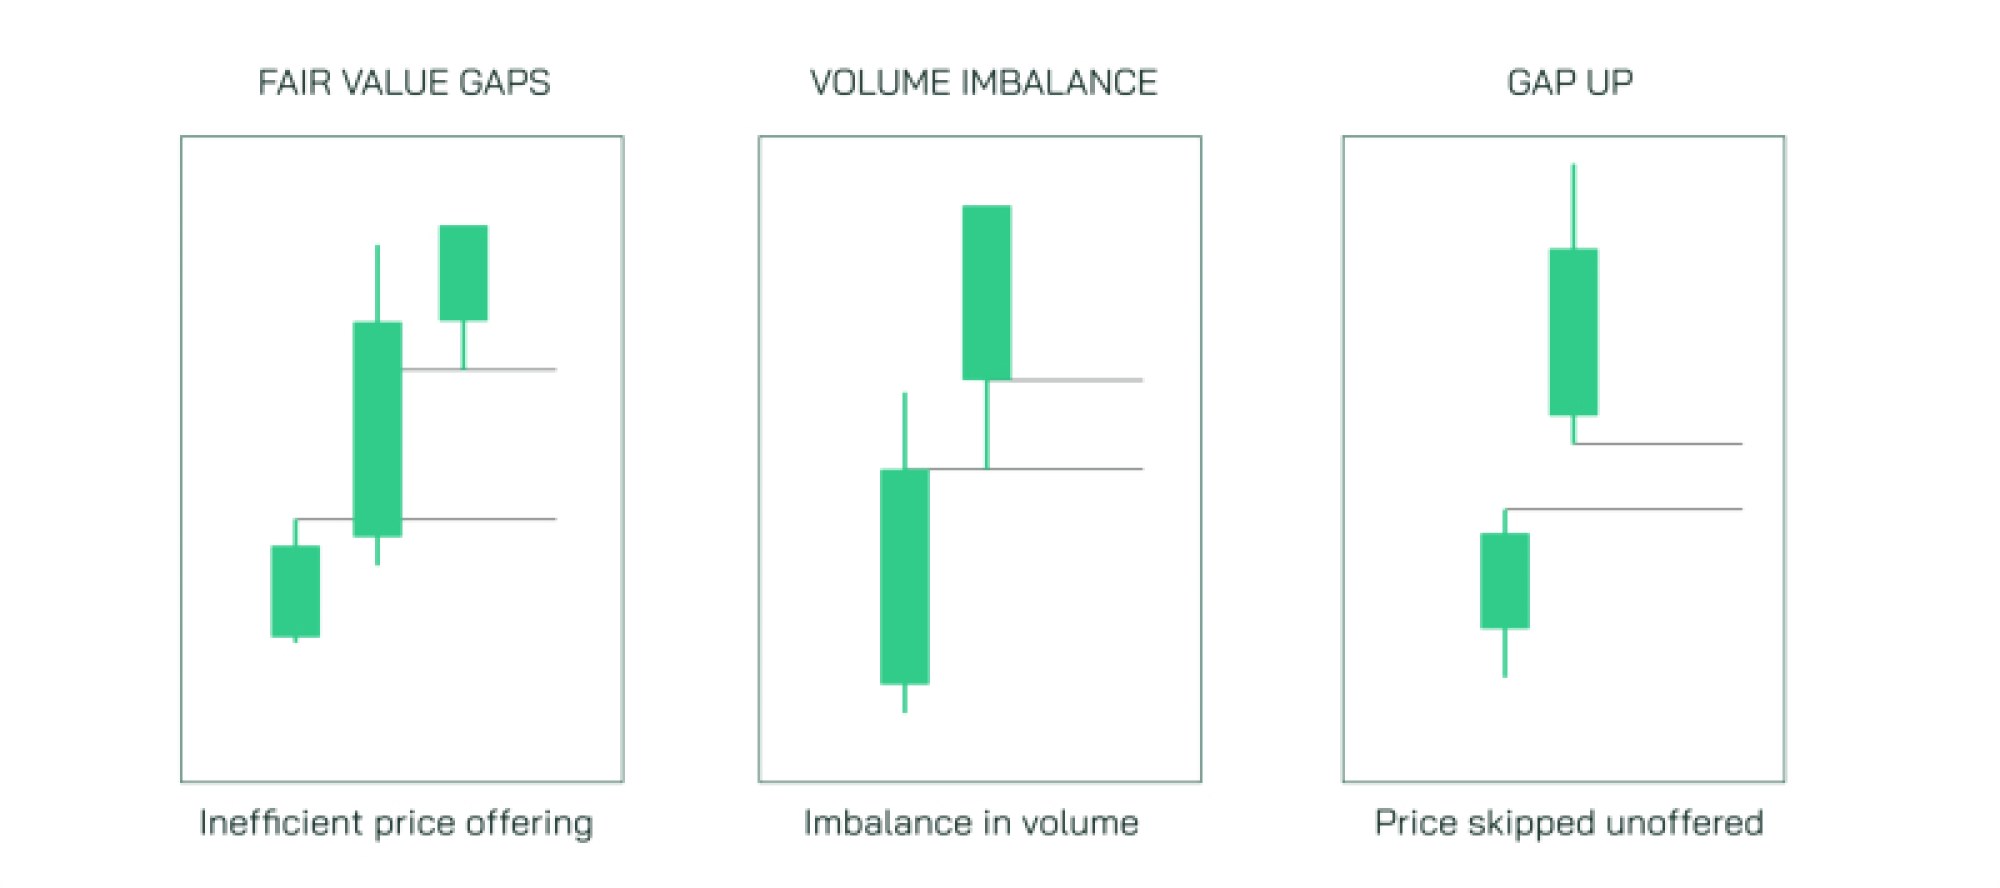
A Fair Value Gap (FVG) forms on a candle chart when price moves so quickly from one level to another that one side of the market never has the chance to trade. In practical terms, this often appears as a three-candle pattern where the wicks of the first and third candles do not overlap the body or wick of the middle candle. The middle candle, which is usually large and impulsive, represents aggressive imbalance where buying or selling pressure eliminates opposition and lifts price rapidly upward or pushes it sharply downward. The absence of overlap shows that the market skipped a region instead of interacting across it, leaving a thin zone where little volume was transacted. This is what makes it a fair value gap — the price shown there is not “fair” because neither buyers nor sellers had adequate opportunity to exchange contracts or shares there. Instead, the zone reflects inefficiency in delivery, and under normal auction behavior, the market tends to revisit it later to rebalance. When price eventually returns to such a gap, it is often met with reactive trade because large resting orders are positioned inside these gaps for the purpose of filling uncompleted transactions. Thus, an FVG is not merely a chart anomaly — it is a representation of absent liquidity and unfinished business.
The manner in which the market interacts with a Fair Value Gap depends heavily on context. In the direction of a bullish imbalance (an upward FVG), price rallies aggressively, leaving below it a gap where no two-sided trading occurred. Later, price may retrace downward into that gap to gather liquidity and mitigate inefficiency before resuming upward movement if the trend remains intact. In a bearish imbalance (a downward FVG), price collapses with accelerated bearish momentum, leaving above it a region of inefficiency that the market may later retest before further decline if the trend maintains strength. The FVG itself becomes a magnet because the auction system naturally prefers balance; it seeks to fill in the missing auctions left behind by imbalance. However, a market returning to an FVG does not automatically reverse; it may only tap into the gap, trigger pending institutional orders, and continue in the original direction with renewed momentum. The gap functions not as support or resistance in the classical sense but as a location where liquidity has been left behind and may be tapped for continuation.
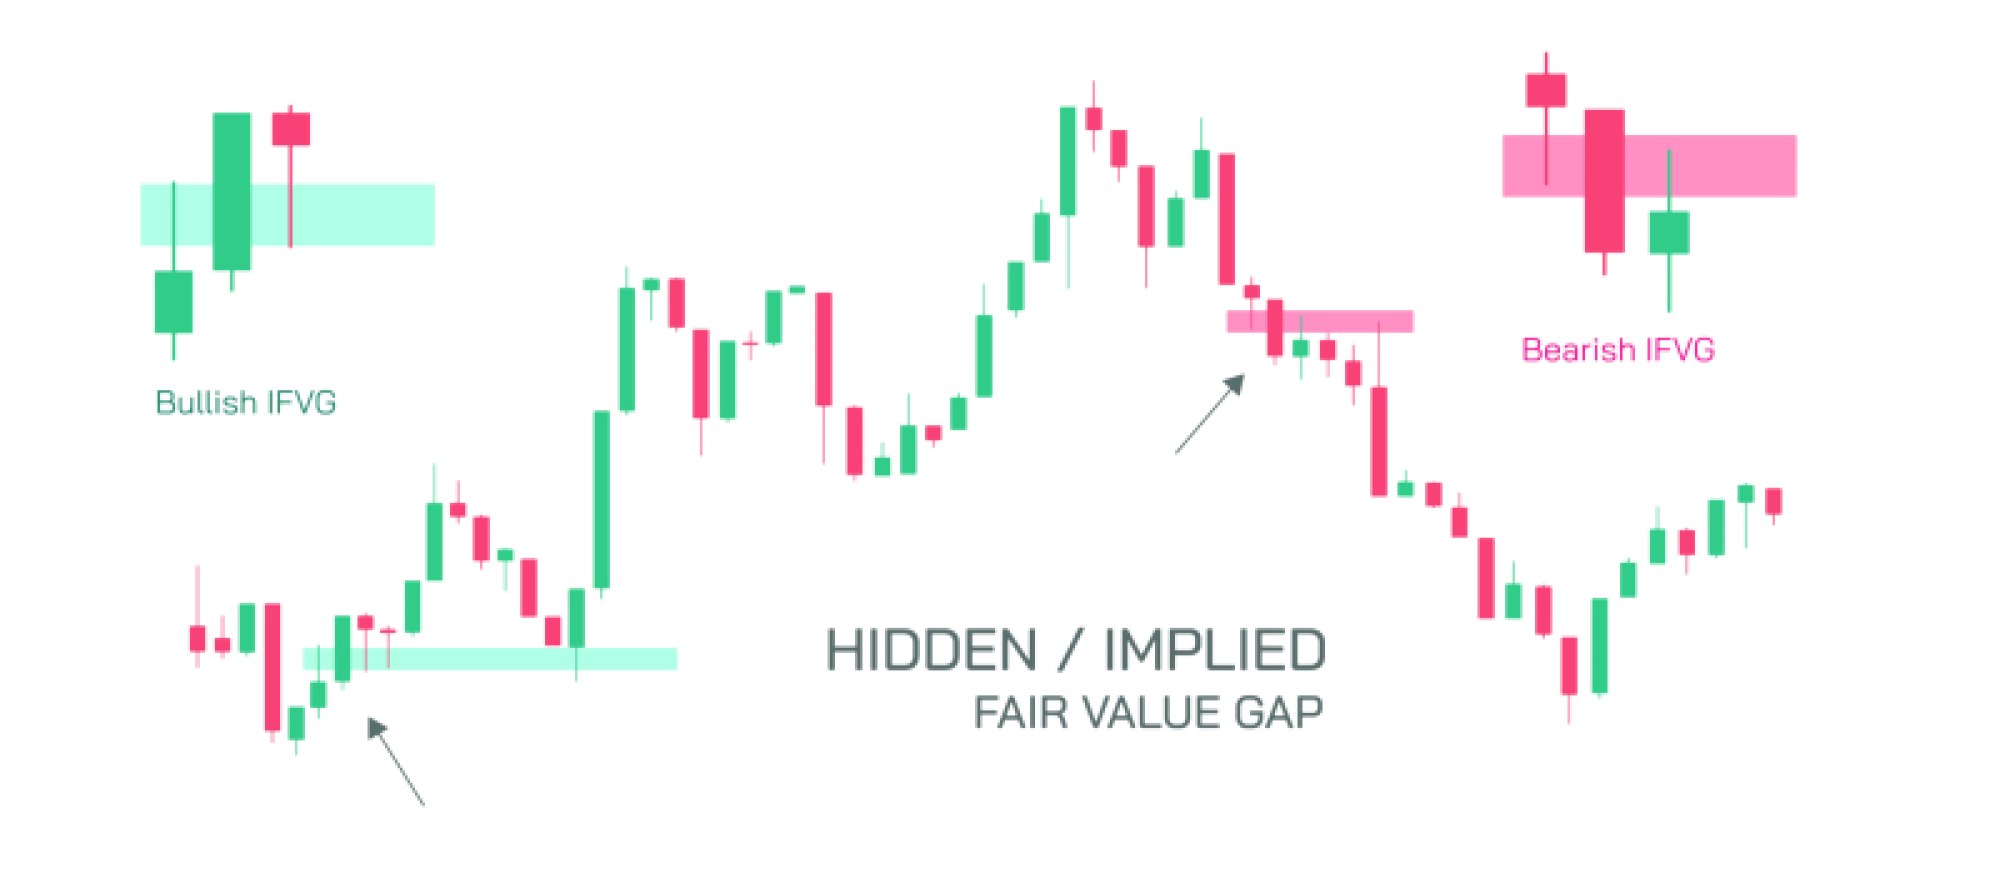
An Implied Fair Value Gap (IFVG) is a more subtle and advanced form of inefficiency. Unlike a regular Fair Value Gap, which is visually obvious on the chart based on candle separation, an IFVG is derived from the logic of price delivery rather than a literal visual gap. IFVGs reflect the idea that even if the three-candle structure does not fully display a missing price zone, the market can still leave behind inefficiency in the internal order flow. For example, price may create a sharp displacement with a sequence of candles that appear visually continuous but still skip a microscale price region where bid-ask matching did not occur. Another scenario arises when a structural displacement clearly indicates that price launched too aggressively for opposing orders to fill, even if candle wicks visibly overlap. In such cases, experienced price action traders identify IFVGs by analyzing the displacement relative to structural pivot points rather than candle shape alone. Because IFVGs depend on context rather than a raw visual formation, they often appear in trending markets where demand or supply dominates so strongly that price “leans” away from equilibrium without leaving a textbook gap behind.
Implied Fair Value Gaps act similarly to visible FVGs in attracting price back toward them, but they do so because of assumed liquidity deficiency rather than obvious inefficiency. One of the most common expressions of IFVG occurs when price breaks a structure level so decisively that the market simply cannot have filled all opposing orders, even if wicks overlap. In this scenario, the implied gap forms between the displacement candle and the nearest structural reference point such as a swing high or swing low. Traders use IFVGs to locate zones where price may retrace to rebalance before continuation, and because they are less widely recognized than textbook FVGs, they can offer high-value insight into algorithmic liquidity behavior. The idea is that imbalance does not depend solely on candle geometry; it depends on whether the auction principle was interrupted. IFVG recognition therefore requires a deeper understanding of order flow and structure rather than static pattern-based identification.
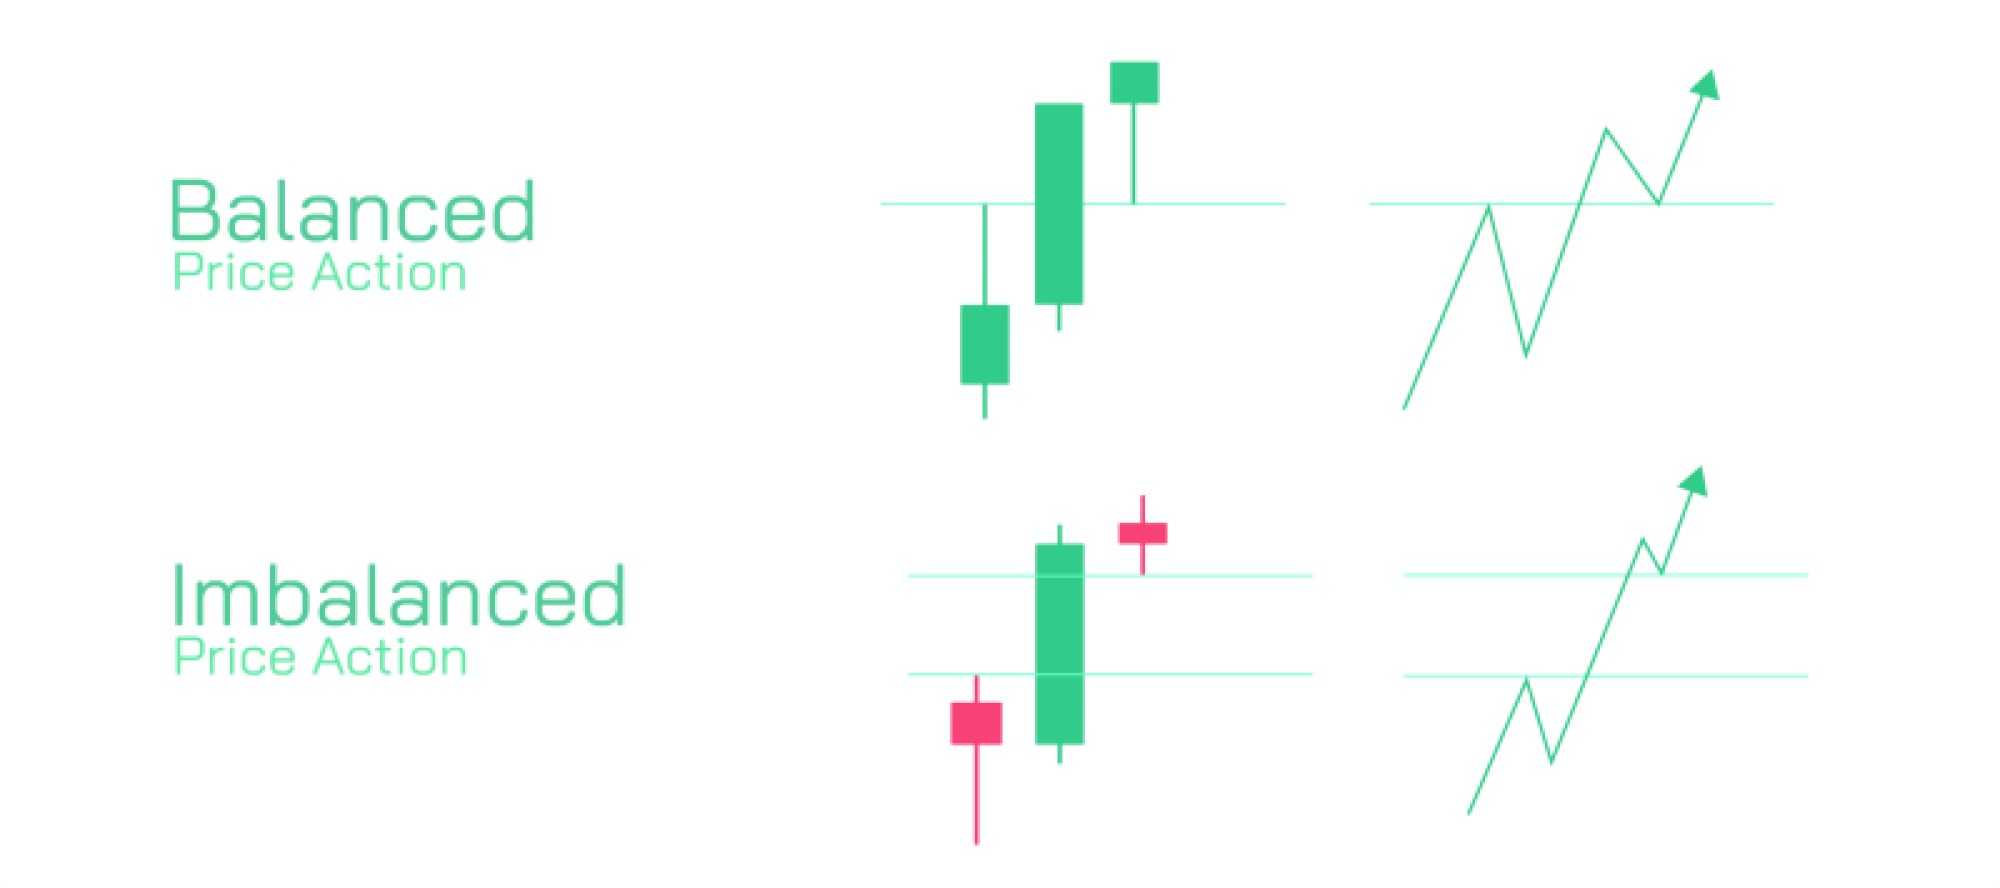
The relationship between FVG and IFVG fits into the broader logic of market structure cycles, where price alternates between accumulated balance and rapid displacement. Every time price breaks a consolidation zone, trends away from equilibrium, sweeps liquidity, or destroys opposing orders, it risks leaving behind inefficiency. The resulting gaps mark the transition from balanced to imbalanced trading — evidence that the market has shifted from negotiation to urgency. When price eventually retraces toward FVG or IFVG zones, it is not reversing randomly; it is restoring balance before resuming value discovery. These retracements can become strategic entry opportunities for institutional models that rely on liquidity and displacement rather than prediction. In bullish trends, price uses upward displacement to create higher-time-frame imbalances and downward retracements into FVG or IFVG zones to refill liquidity for continuation. In bearish trends, price pushes downward strongly into imbalances and later rallies into the gaps to redistribute supply before further decline.
The psychological side of this structure reveals why many retail traders interpret retracements incorrectly. After a sharp bullish move, traders may assume continuation without recognizing that an upward displacement might require a pull-back to fill liquidity left behind. When the market revisits the Fair Value Gap, inexperienced participants mistake the retracement for trend reversal and enter premature short positions — only to provide liquidity that institutional traders absorb before driving price back upward. The reverse occurs in bearish markets, where retracements into bearish FVGs trigger false optimism from retail buyers who become trapped. These behavioral patterns underline the real nature of imbalance: price does not reverse simply to punish traders; it returns to FVG and IFVG zones to complete unfinished auctions.
Ultimately, Fair Value Gaps and Implied Fair Value Gaps are not mystical formations or predictive tools but expressions of liquidity logic embedded into price delivery. FVGs represent visual inefficiencies left behind by aggressive directional displacement, while IFVGs represent hidden inefficiencies derived from contextual displacement even without obvious visual gaps. In both cases, the gaps show where price moved without trading fully in both directions, and the auction system later attempts to correct this by revisiting the zone. When combined with market structure, displacement, liquidity engineering, and institutional order flow, FVG and IFVG offer insight into why price returns to certain levels and ignores others — providing a framework in which candles stop being random noise and instead narrate the story of liquidity, imbalance, and value discovery across time.