Stock Market Balanced vs Imbalanced Price Action: Understanding Candle Charts, Market Psychology, and Liquidity Dynamics Explained
In financial trading, price movement on a chart is not merely random fluctuation; it reflects an ongoing negotiation between buyers and sellers over what an asset is worth at any given moment. When this negotiation unfolds smoothly, price tends to move in an orderly fashion, pausing to accumulate volume at key levels before advancing or declining. When negotiation is disrupted and one side temporarily dominates the other, price moves quickly and aggressively, leaving behind regions of little or no trading activity. These two behaviors form the foundation of balanced price action and imbalanced price action — patterns visually captured by candles on a stock chart. A balanced market is defined by equilibrium between supply and demand, while an imbalanced market emerges when that equilibrium breaks in favor of either buyers or sellers. Understanding the difference between balance and imbalance is fundamental to interpreting the psychological forces, liquidity mechanisms, and strategic opportunities embedded in market structure.
A balanced market is characterized by stable, back-and-forth trade flows where neither buyers nor sellers exert overwhelming control. In candle chart terms, this balance often appears as sideways movement, also referred to as consolidation, range-bound trading, or accumulation/distribution zones. Candles in these areas typically show relatively small bodies with wicks on both ends, indicating that buyers and sellers are testing prices but rejecting extremes. Volume tends to cluster, and price revisits the same levels repeatedly. This pattern represents a temporary agreement about value: participants are willing to trade actively within a specific range but not yet motivated to bid price sharply higher or lower. Such zones serve as resting points in market structure where institutional participants accumulate inventory (if planning to push price upward) or distribute inventory (if preparing for a decline). The key feature of balance is time — price lingers long enough for large orders to be filled, and the repeated transactions build significant liquidity. In trading psychology terms, a balanced zone is where uncertainty dominates, where both sides wait for new information before committing to the next directional drive.
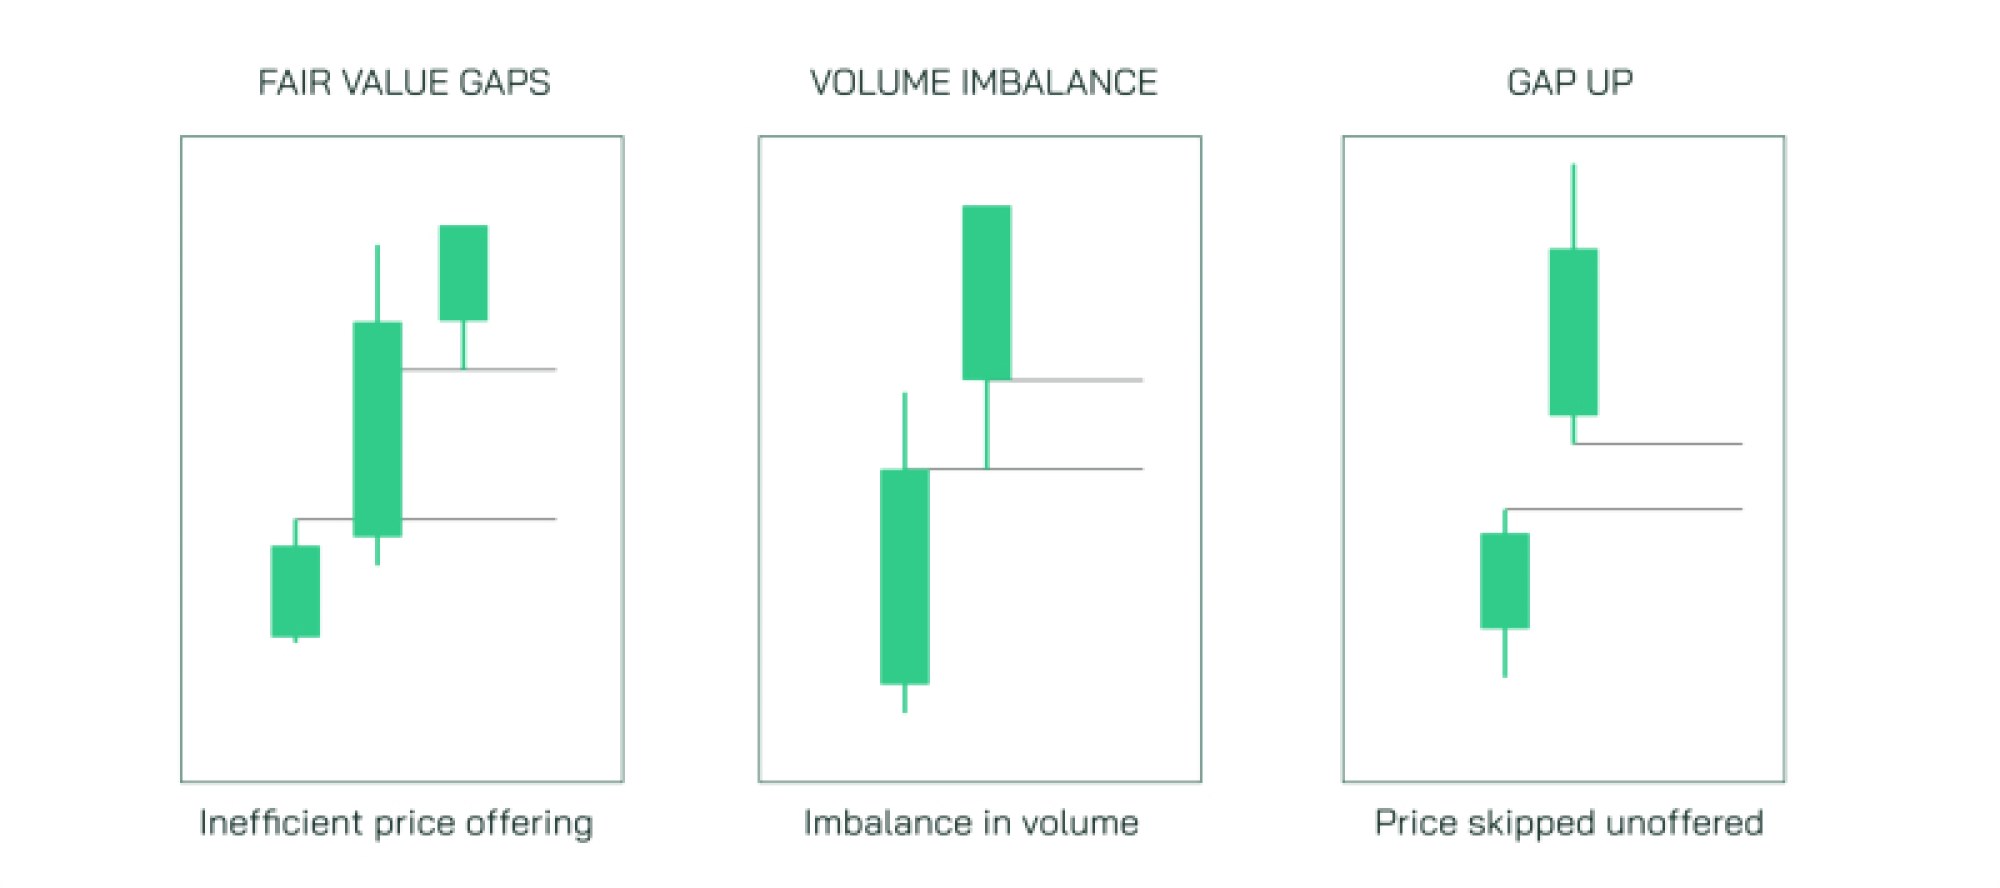
In contrast, an imbalanced market occurs when supply and demand become unequal and one side overwhelms the other. On a candle chart, imbalance appears as strong directional moves, often forming consecutive large candles with minimal wicks and little retracement. These movements are sometimes described as impulse legs, breakouts, breakdowns, or liquidity grabs, depending on context. In these zones, trading activity is sparse because price moves too quickly for both sides to engage equally. Buyers aggressively chase price upward in a bullish imbalance, or sellers aggressively push price downward in a bearish imbalance. The imbalance reveals urgency: large players enter the market with sizeable orders, leaving behind inefficient price regions where liquidity was insufficient to provide resistance. Because little trading occurs in these areas, price often retraces back to them later, filling unresolved imbalanced gaps or fair value gaps, where the market seeks to re-establish equilibrium by matching unfulfilled orders. Thus, imbalance is not only a movement pattern but the mechanism by which markets shift from one value region to the next.
The transition between balance and imbalance reveals deep insight into market psychology and liquidity dynamics. A balanced market does not last forever because accumulation and distribution eventually reach thresholds where institutional traders have either acquired enough inventory to initiate a markup or unloaded enough inventory to initiate a markdown. When this threshold is reached, balance evolves into imbalance through a break of structure — a decisive movement beyond the range that signals control by one side of the market. Traders viewing the breakout through candle chart behavior see large bullish candles closing near their highs for upward imbalance or large bearish candles closing near their lows for downward imbalance. The very speed of the movement indicates that many pending orders — especially stop-loss orders placed by retail traders at predictable levels — have been triggered. These orders add to momentum, fueling the imbalance further. In this environment, price is not simply moving; it is searching for liquidity, finding it where traders have placed orders above resistance or below support levels.
What makes the distinction between balanced and imbalanced price action so informative is that the market does not remain in either state permanently. Instead, price rotates between accumulation/consolidation (balance) and impulsive breakout/breakdown (imbalance). This cycle forms the backbone of market structure: the market pauses to build value, then travels rapidly to establish a new zone of value. Each rotation leaves clues. Balanced regions show where traders and institutions agree strongly on price, creating support and resistance when revisited. Imbalanced regions show where price left without conducting business, creating magnet-like levels where price often returns later because the previous movement lacked two-sided participation. Experienced traders use these insights to anticipate potential future behavior not by guessing direction but by mapping supply-and-demand footprints to identify where liquidity may be drawn from or delivered to next.
The visual representation on a candle chart reinforces this interpretation. In a balanced zone, candles overlap in tight clusters, creating horizontal “compression.” Wicks extend above and below, showing rejected attempts to break out. In an imbalanced move, candles become distinct, directional, and elongated, with aligned bodies indicating momentum. The shift between the two patterns is seldom gradual; rather, it often occurs through a sudden expansion of volatility driven by catalysts like news, institutional order execution, or exhaustion of opposing liquidity. Even without external catalysts, price naturally gravitates toward imbalance after prolonged balance because market participants eventually exhaust the levels where they were willing to keep trading. This structural transition is consistent across all financial markets — stocks, forex, crypto, bonds, commodities — because it stems from universal features of order flow and liquidity.
Balanced and imbalanced price action are not simply chart patterns; they express the strategic decisions of market participants. During balance, market makers, institutions, and algorithmic systems may intentionally hold price within a controlled range to fill inventory without revealing directional intent. During imbalance, those same forces may unleash stored buying or selling pressure to move price efficiently toward new liquidity pools. Retail traders often misinterpret imbalance as sudden unpredictable volatility, but it is frequently the mechanical result of orders interacting across time and price. The imbalance does not reflect chaos; it reflects decisiveness after a period of indecision. Whether the imbalance aligns with broader trends or signals a trend reversal depends on where it breaks relative to prior structural pivots and whether liquidity has been fully delivered.
Ultimately, the relationship between balanced and imbalanced price action forms a structural language that candle charts express visually and that traders can interpret conceptually. Balance marks where the market has “agreed” on value; imbalance marks where the market is “discovering” new value. Balance absorbs liquidity; imbalance hunts for it. Balance reflects negotiation; imbalance reflects decision. Seen this way, market motion is no longer a noisy series of candles, but a cycle that oscillates between stability and acceleration, accumulation and displacement, liquidity resting and liquidity seeking. Appreciating this rhythm deepens not only technical understanding but also psychological awareness, showing that every price move is a consequence of how market participants collectively perceive risk, opportunity, and urgency in the ever-evolving negotiation of price.