Elliott Wave Theory in the Stock Market: Market Cycle, Wave Patterns, and Trader Psychology Explained
Elliott Wave Theory is one of the most influential frameworks in technical analysis because it interprets price movement not as a series of random fluctuations, but as structured waves driven by crowd psychology and recurring cycles of optimism and pessimism. Developed by Ralph Nelson Elliott in the 1930s, the theory proposes that markets move in repetitive rhythmic patterns that reflect the collective emotional response of participants as they navigate hopes of profit and fears of loss. These patterns unfold in identifiable waves that alternate between impulse and correction, forming a cyclical system that can be observed in every timeframe, whether a one-minute intraday chart or multi-year market cycles. What makes Elliott Wave Theory distinct from traditional trend analysis is that it does not merely track direction; it interprets price movement as a story of human expectations evolving in phases. These phases reveal how trends begin, advance, stall, reverse, and eventually reset before repeating again. When illustrated on a stock chart, Elliott Waves create a map of price behavior in which each swing is not isolated, but part of a greater structure that captures the psychology and liquidity flow of market participants.
At the heart of Elliott Wave Theory is the five-wave impulse and three-wave corrective structure, which together create a complete market cycle. The impulse phase consists of five waves labeled 1, 2, 3, 4, and 5, showing the dominant trend direction. The corrective phase consists of three waves labeled A, B, and C, showing the retracement against the dominant trend. This 5-3 sequence forms the fundamental template of Elliott Wave Theory. However, the power of this template lies not in a rigid expectation but in its fractal nature: each wave contains smaller waves within it, and each complete pattern forms part of a larger structure. Thus, the market expresses the same geometry whether observed through the lens of seconds, minutes, days, or decades. The theory therefore does not claim that price travels in straight lines; it claims that psychological transitions — excitement, doubt, euphoria, fear, capitulation, and recovery — combine to form waves that reflect the emotional rhythm of buying and selling pressure.
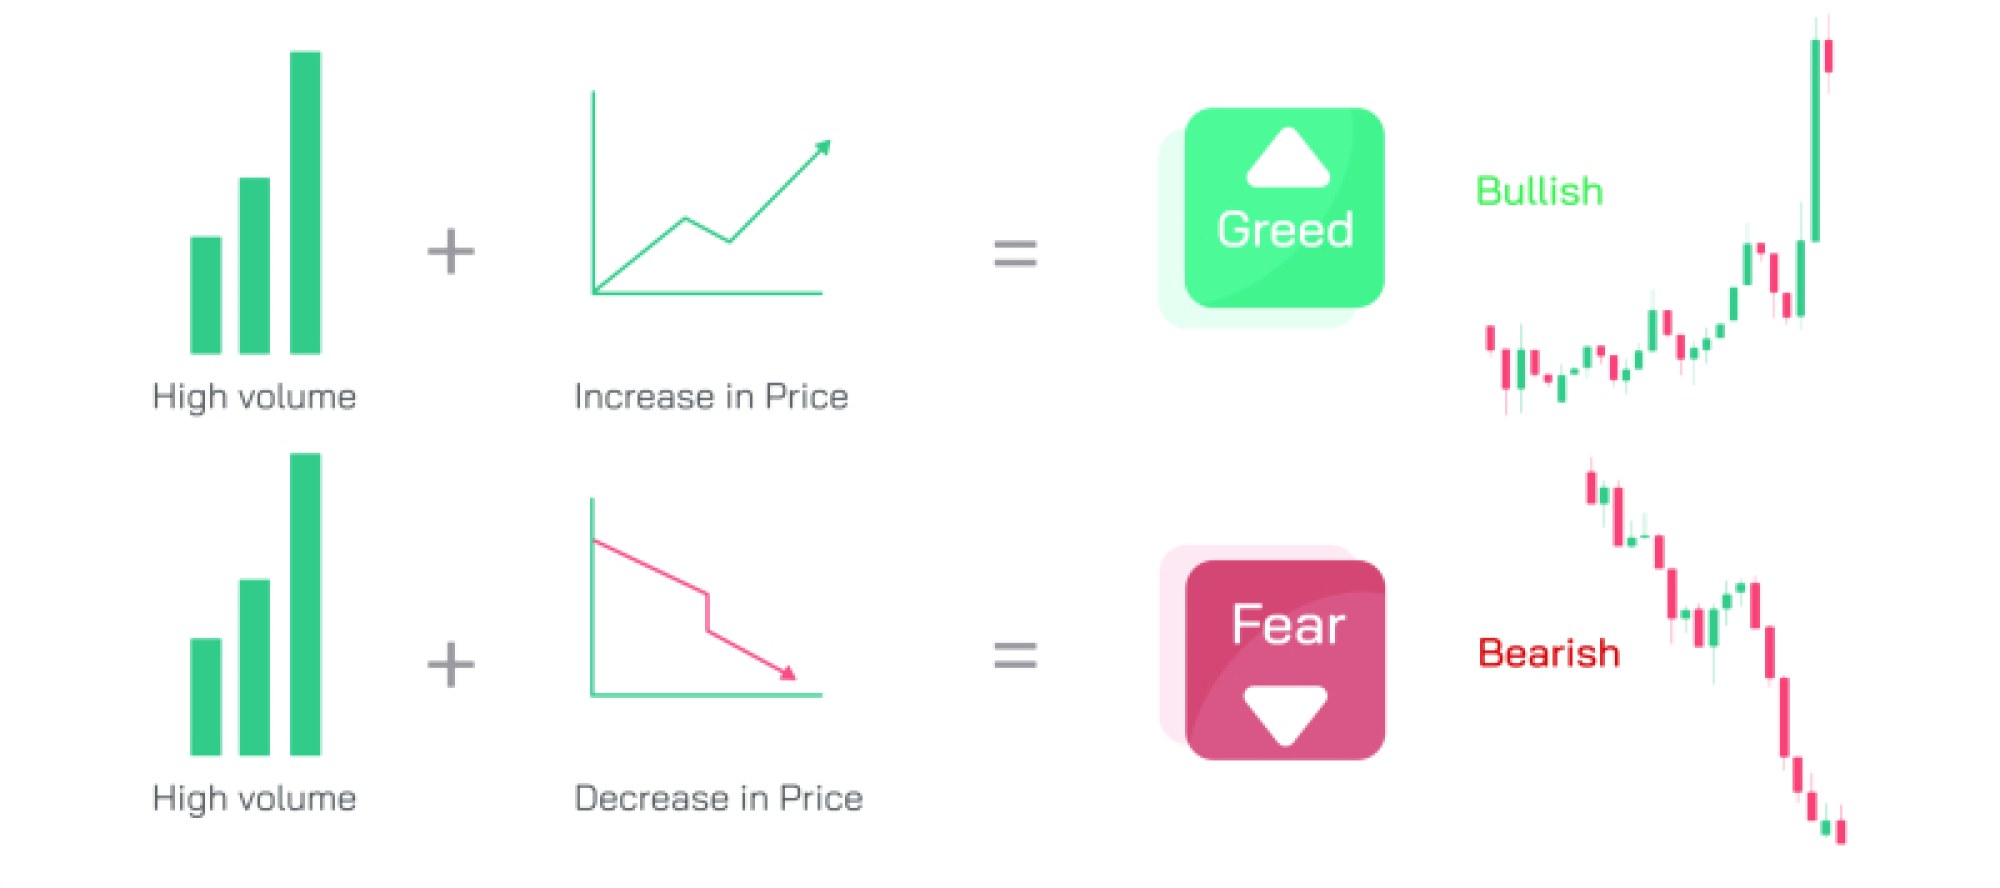
The impulse wave sequence, which unfolds in the direction of the dominant trend, begins with Wave 1, usually a small move when only a minority of informed or contrarian traders believe a reversal is starting. Because most market participants are still anchored to the previous trend, Wave 1 generates limited enthusiasm and moderate volume. Wave 2 retraces part of Wave 1 as traders doubt the emerging shift and take profits early. Wave 2 does not retrace beyond the origin of Wave 1, because the new trend has already seeded supply–demand imbalance. Wave 3, often the strongest and longest wave, reflects widespread recognition of the new trend. Momentum accelerates as institutional participation increases, news aligns with market behavior, and optimism propels price in large candles with rising volume. Because the majority finally acknowledges the trend, Wave 3 frequently exhibits strong breakout movement and extended rallies. Wave 4 is a corrective wave within the uptrend — usually more sideways than deep — as traders pause to reassess and absorb profits. Wave 5 is the final push in the direction of the trend, fueled not by new fundamental conviction but by enthusiasm from late adopters who fear missing out. Although price makes new highs relative to Wave 3, momentum often weakens beneath the surface, creating divergence between price and strength indicators because seasoned traders distribute positions while late participants continue buying.
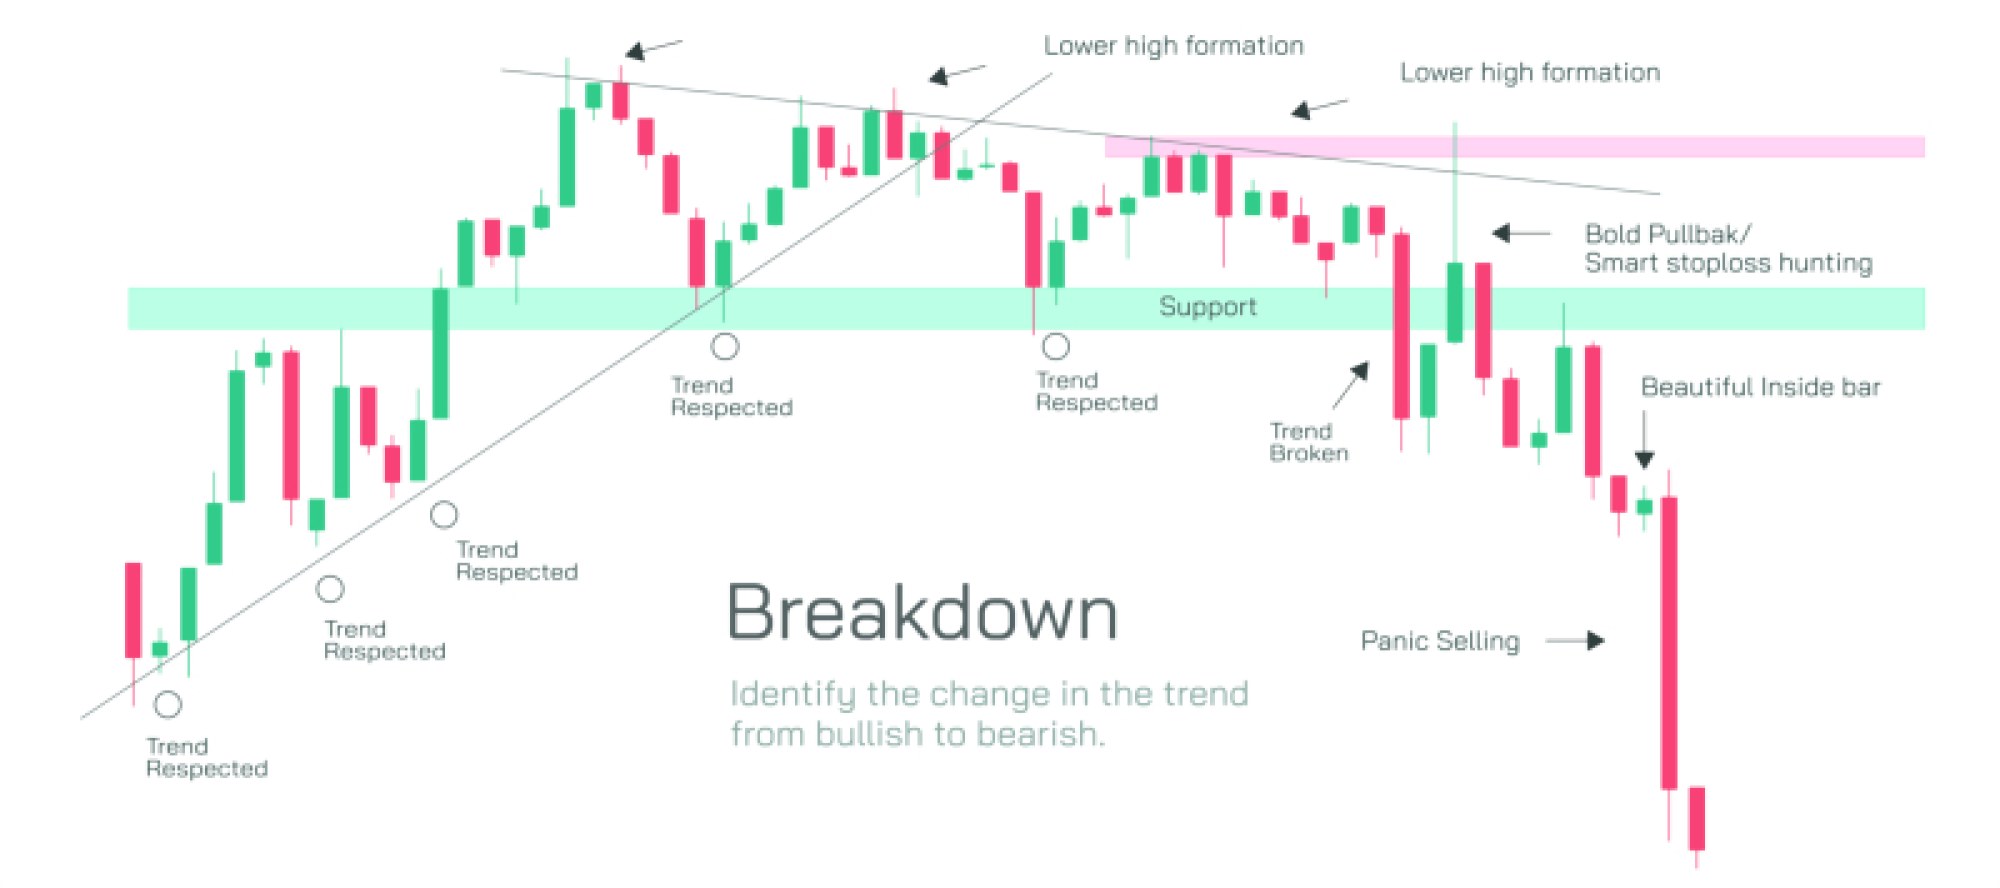
Once the five-wave impulse is complete, the market transitions into a corrective three-wave pattern labeled A-B-C. Wave A signals the first meaningful decline after the uptrend’s climax, often perceived initially as a dip or pullback rather than a trend reversal. Wave B retraces upward and can mislead traders into believing that the original trend will resume; it is often accompanied by declining volume and decreased enthusiasm. Wave C completes the correction and typically extends below the low of Wave A, producing a decline that surprises those who expected continued bullish activity. The A-B-C corrective sequence does not reflect the birth of a new bearish era but the necessary reset required for markets to balance liquidity and sentiment. Once the correction is complete, a new cycle begins, either repeating the upward trend or developing in the opposite direction, depending on broader structural forces.
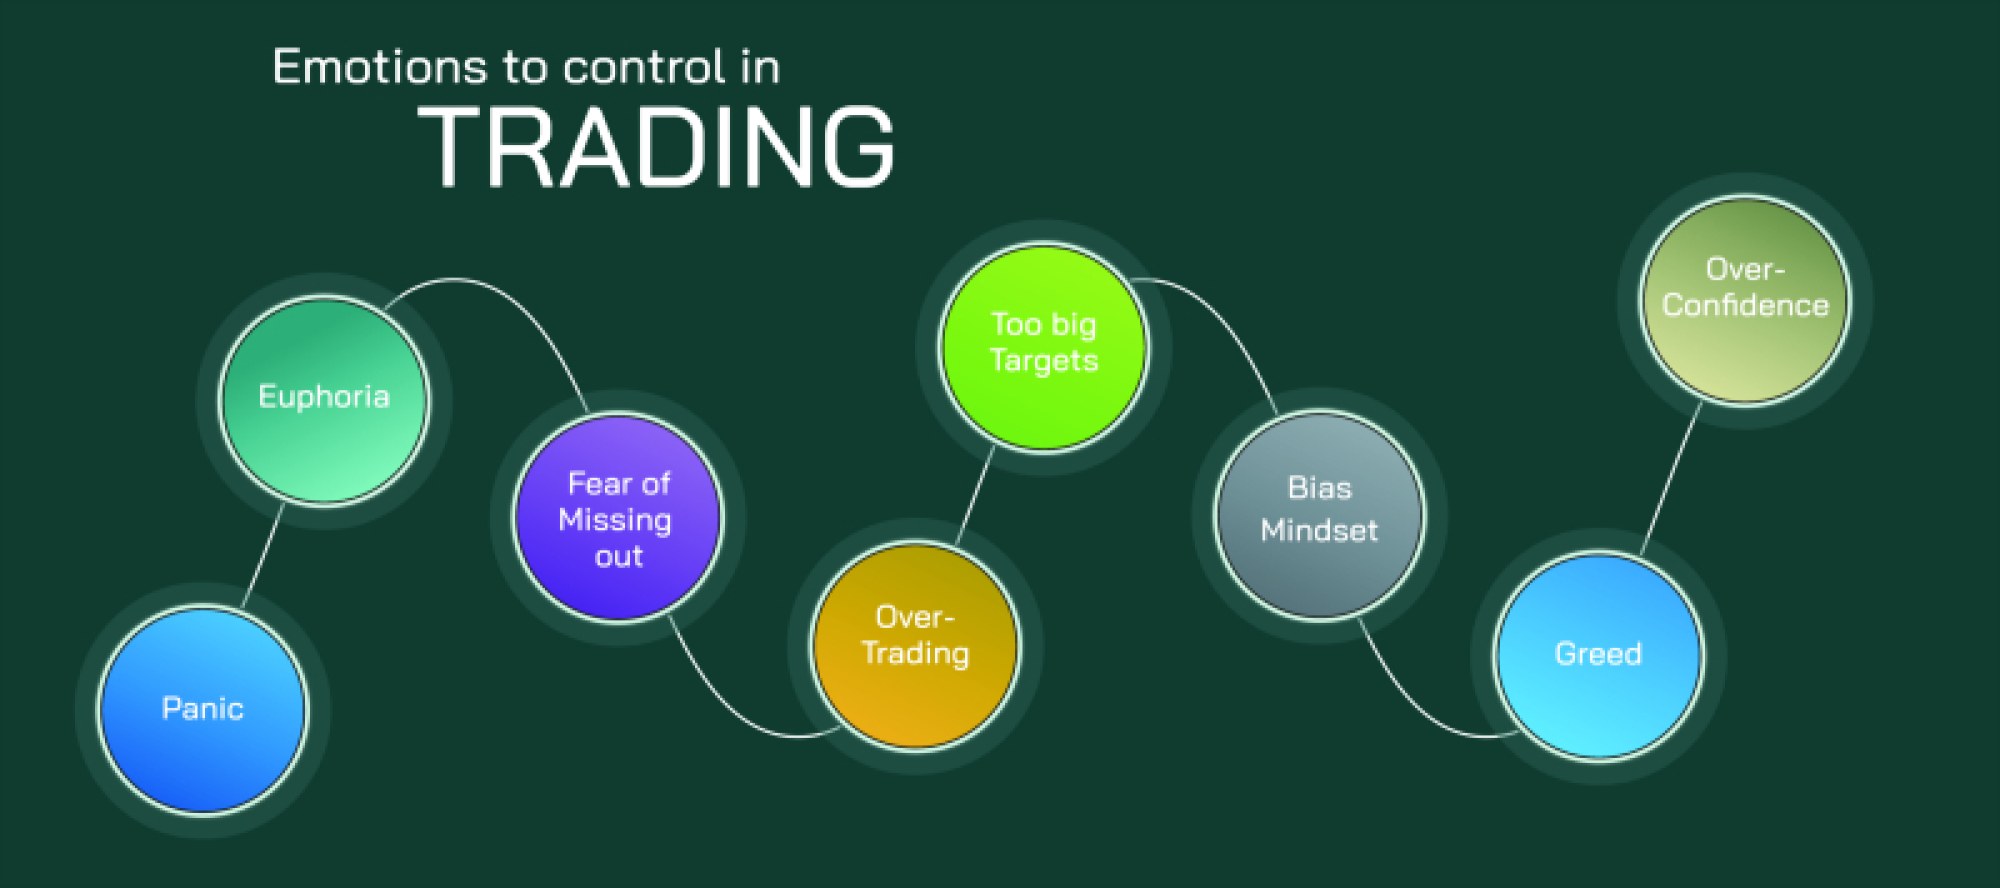
While the classical 5-3 cycle illustrates the simplest form of Elliott Wave Theory, real-world price action displays fractal complexity, meaning that each wave contains subwaves that replicate the higher-level pattern. For example, Wave 3 in an impulse sequence is itself made up of five smaller waves, and Wave A in a correction often contains three smaller waves. This nesting effect continues across all degrees of trend, from grand super-cycles spanning decades to minute-level fluctuations on intraday charts. Elliott’s insight lay in recognizing that investor behavior expresses repetitive psychological cycles irrespective of timescale. Fear, confidence, disbelief, enthusiasm, excessive optimism, panic, and surrender appear not only during bull and bear markets but at every level of price fluctuation. The fractal construction of Elliott Waves therefore reflects scalable psychology rather than arbitrary geometry.
1. These natural constraints ensure that the wave count remains coherent and that the emotional logic of the cycle is preserved. In corrective wave structures, variations occur — such as zigzags, flats, and triangles — but the idea remains consistent: markets consolidate emotions and liquidity before the next directional stage begins.
The larger importance of Elliott Waves extends beyond identifying trend direction; they help traders understand where they are within the emotional arc of the market. A trader buying during Wave 5 may face higher risk because much of the trend is already mature, while entering during the early part of Wave 3 may provide the highest reward-to-risk opportunity because sentiment and liquidity are aligning. Similarly, after a prolonged downtrend, the A-B-C corrective structure may reveal the exhaustion of panic selling and the formation of early accumulation that precedes a new uptrend. Waves provide a framework for recognizing whether the market is in a phase of discovery, continuation, exhaustion, retracement, or re-accumulation. They allow traders to interpret not just what price is doing, but why it is doing it — whether because buyers are becoming euphoric, sellers are becoming fearful, institutions are accumulating, or liquidity is being engineered for the next leg of price movement.
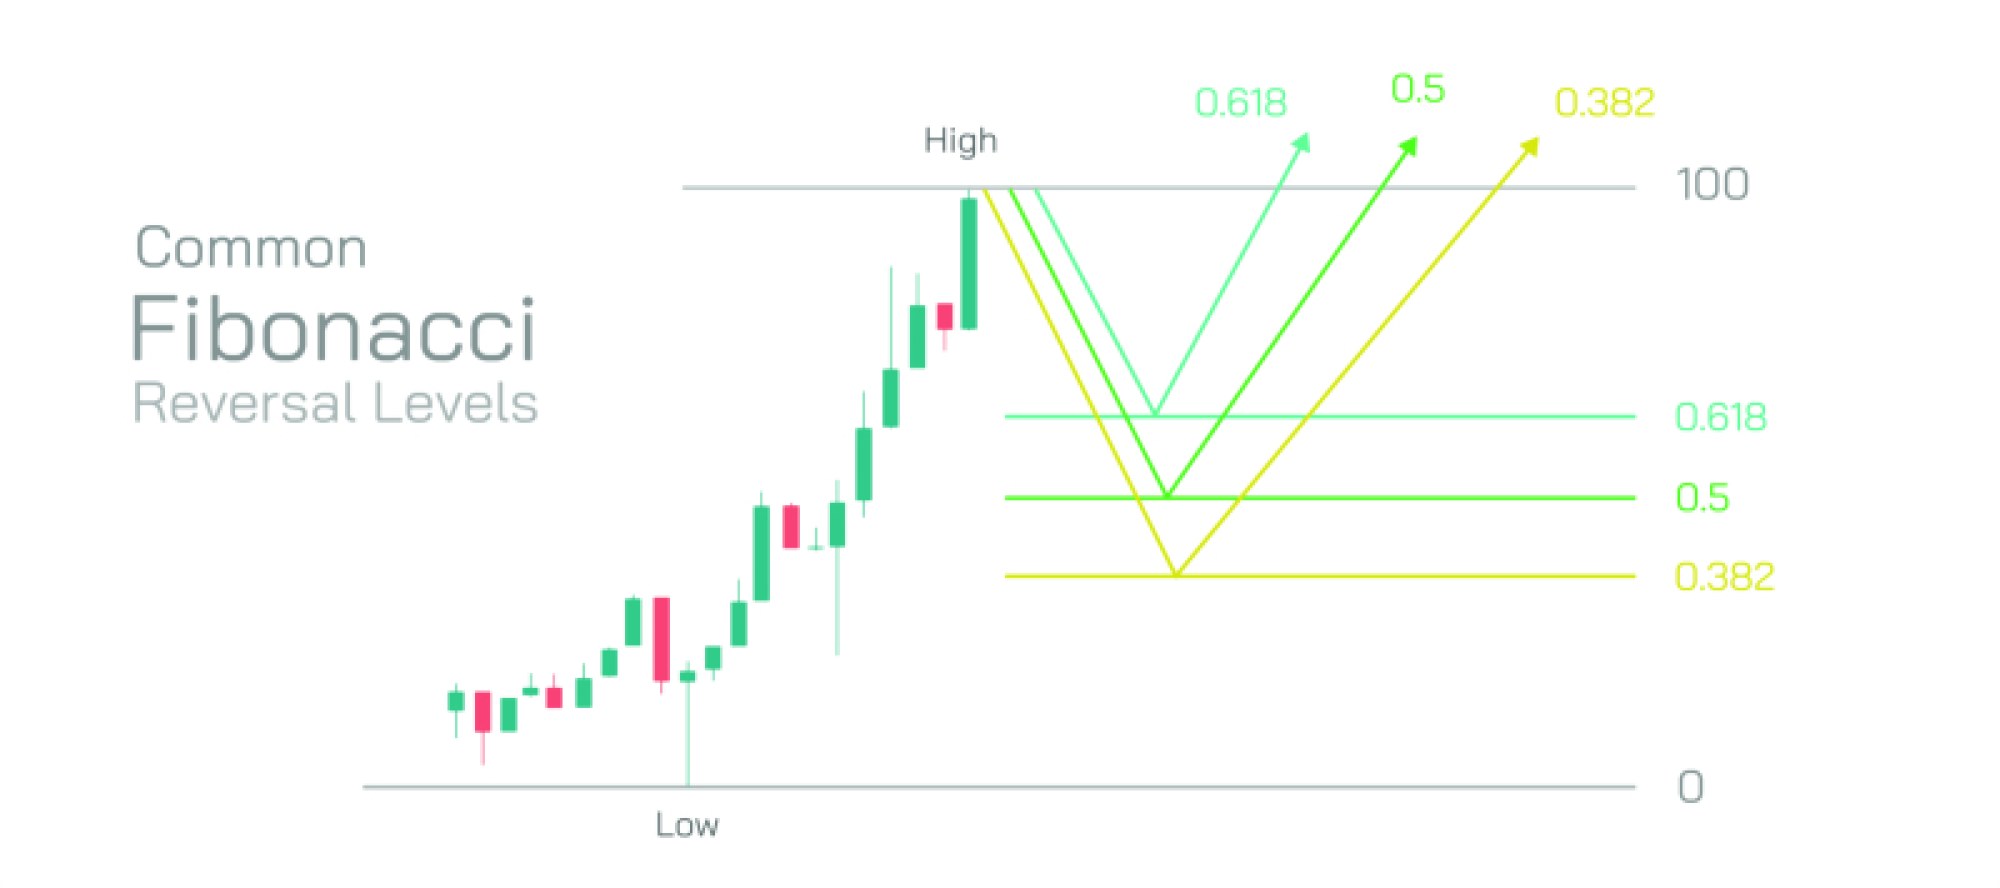
Elliott Wave Theory becomes especially powerful when integrated with market structure, liquidity concepts, Fibonacci analysis, and momentum awareness. Fibonacci ratios commonly appear within wave relationships because human behavioral patterns and risk-reward logic produce recurring proportions in price movement. Wave 2 and Wave 4 often retrace within Fibonacci boundaries, and Wave 3 extensions frequently align with core Fibonacci multiples. Meanwhile, liquidity-based interpretations — such as identifying where stop orders and trapped traders exist — complement the wave framework by revealing how markets gather energy to fuel directional movement. Together, these approaches help traders contextualize retracements, foresee continuation zones, and identify high-probability turning points.
Ultimately, Elliott Wave Theory is not a method for predicting the future with perfect precision but a lens for interpreting how markets express collective psychology through structured motion. Price is not random; it fluctuates because human confidence expands and contracts in rhythmic impulses and corrections. Elliott Waves tell the story of that rhythm — of how trends begin, strengthen, climax, collapse, and renew. More importantly, they allow traders to map their own emotional responses within the broader context of the market cycle, helping them avoid the trap of buying during euphoria and selling during despair. When understood deeply, Elliott Wave Theory transforms charts from simple peaks and valleys into a narrative of crowd behavior, revealing how the same psychological cycle unfolds across minutes, months, and decades as the market repeatedly oscillates through discovery, imbalance, exhaustion, and rebirth.