Stock Market Chart Pattern Breakdown — Concept and Applications
The stock market chart pattern breakdown is a fundamental concept in technical analysis, helping investors understand potential trend reversals, breakouts, and market movements. A chart pattern breakdown occurs when a stock price moves decisively below a key support level or pattern, signaling that the previous trend may be ending and a new price direction is likely to begin. Traders and investors use these breakdowns to identify selling opportunities or to manage risk in their portfolios.
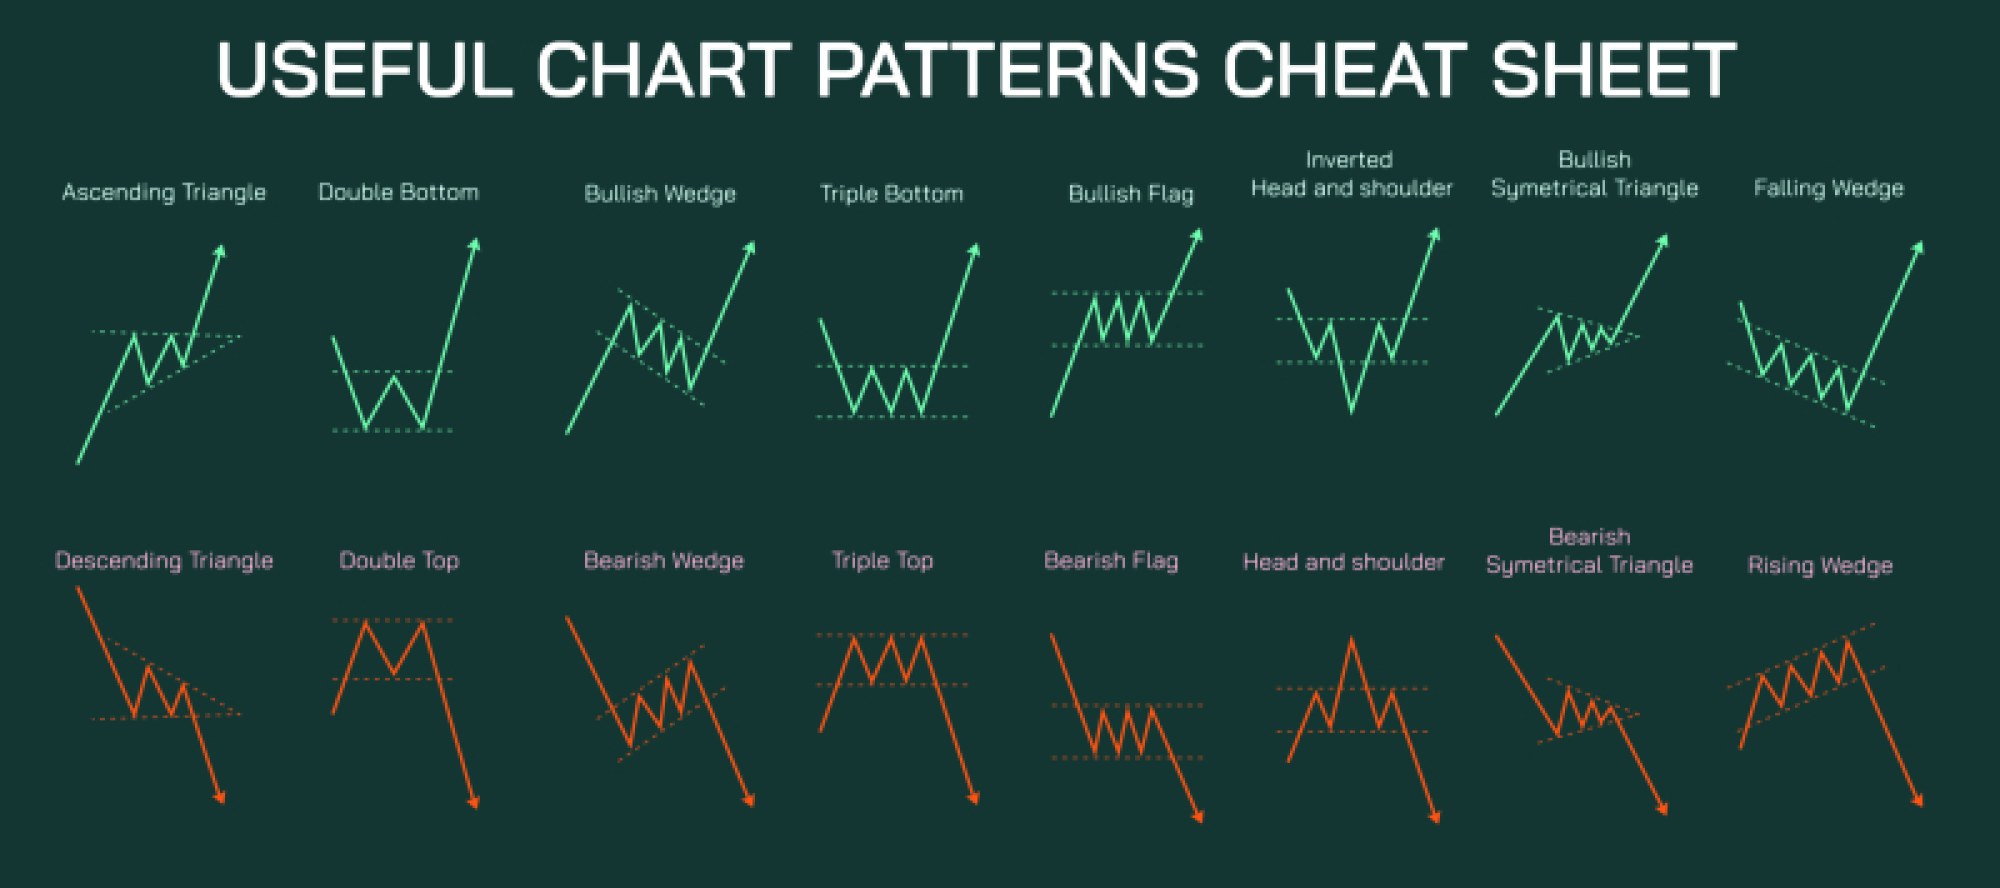
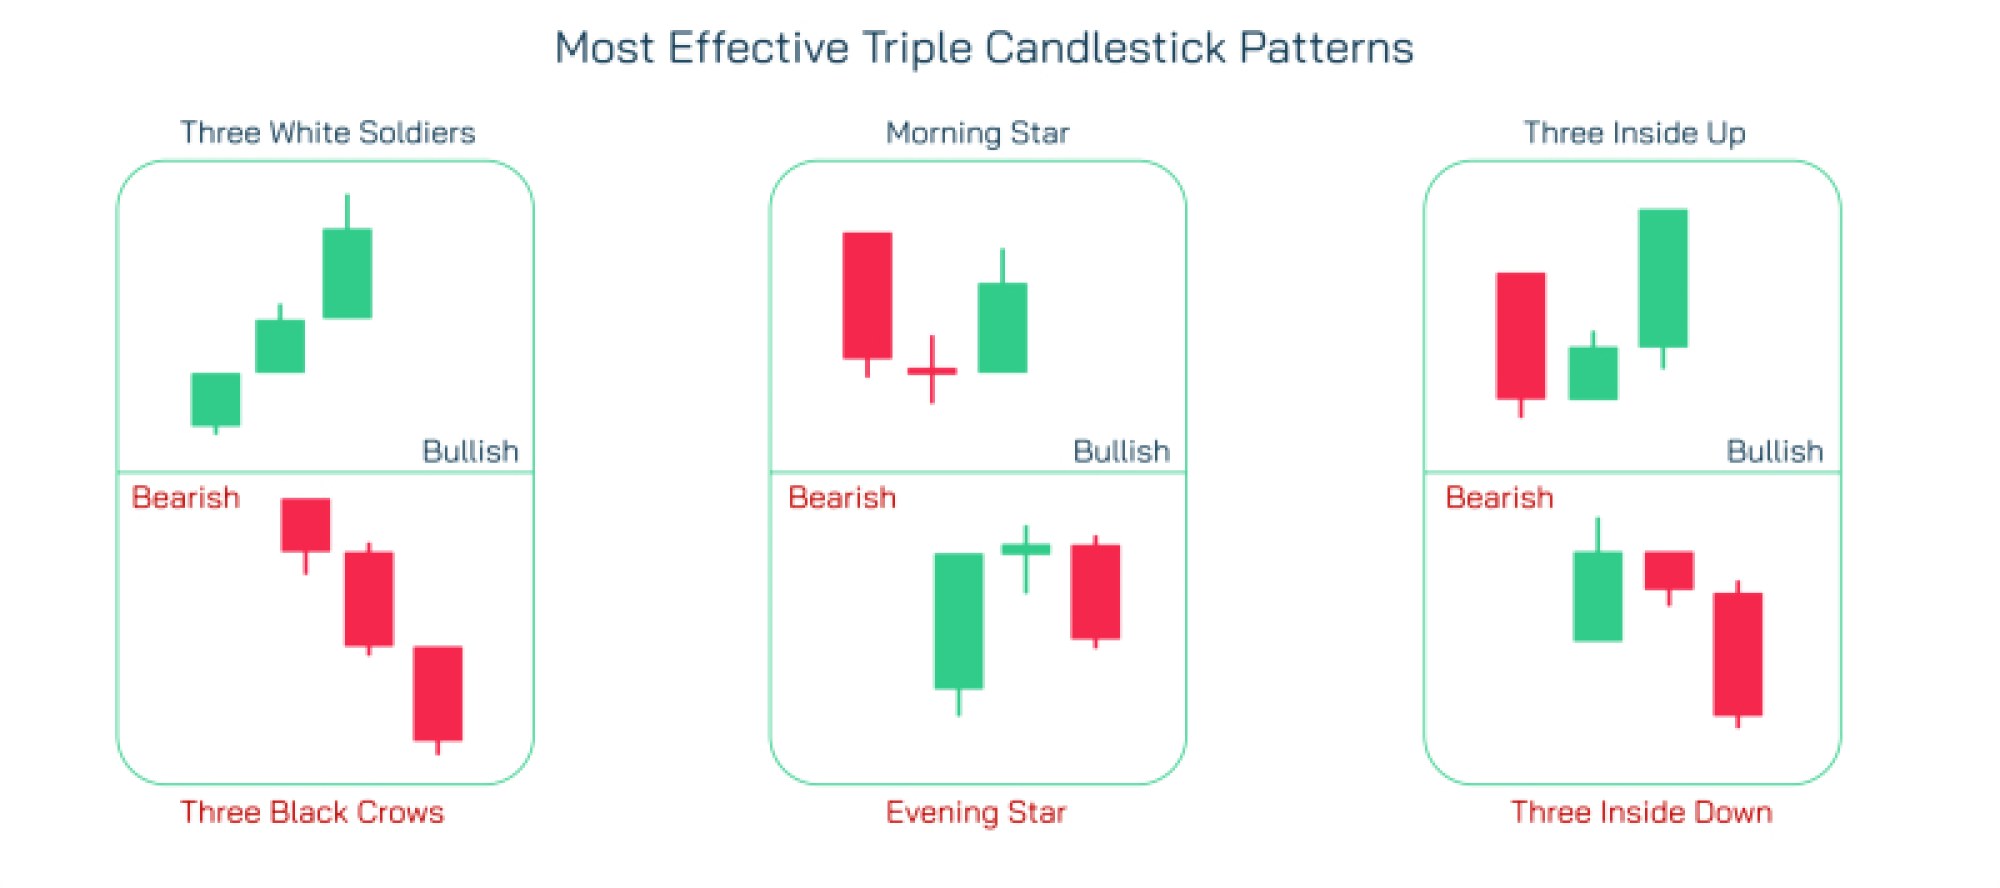
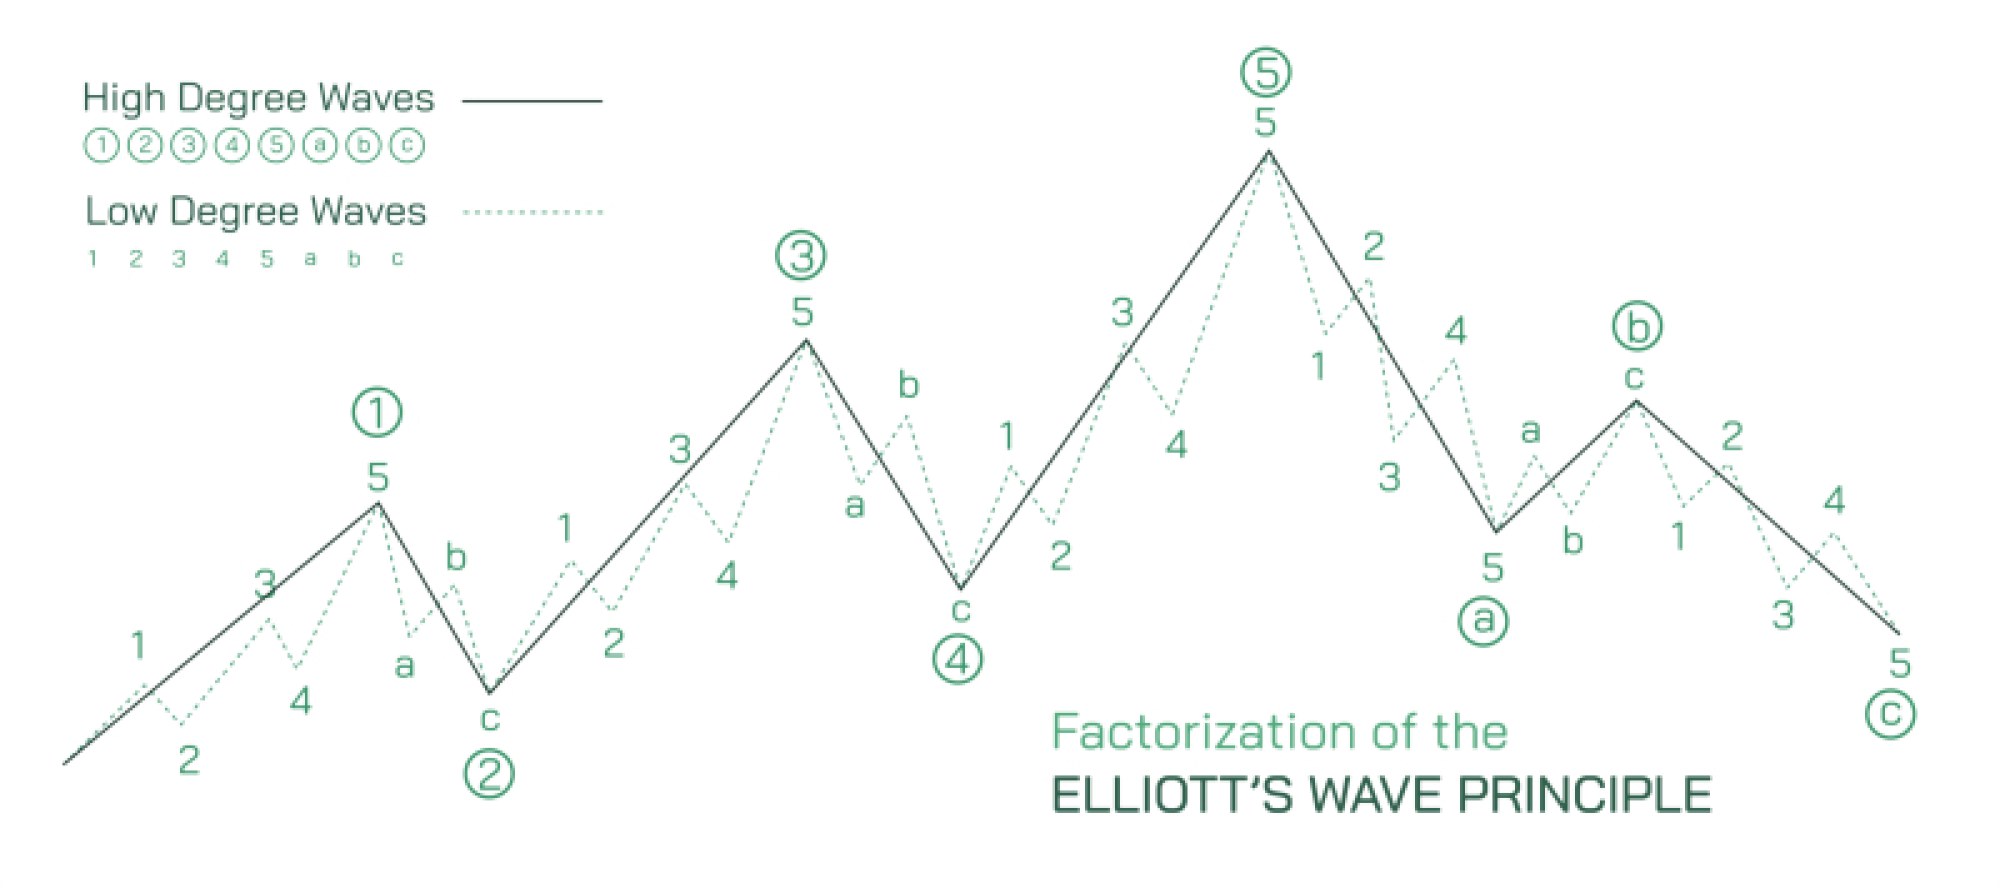
Breakdowns are often observed in various chart formations such as head and shoulders, double tops, triangles, and channels. Each pattern has distinct characteristics, and a breakdown indicates that buyer strength has weakened while selling pressure increases. Recognizing these breakdowns allows traders to anticipate market momentum shifts, set stop-loss levels, and adjust trading strategies to protect capital or capture potential profits.
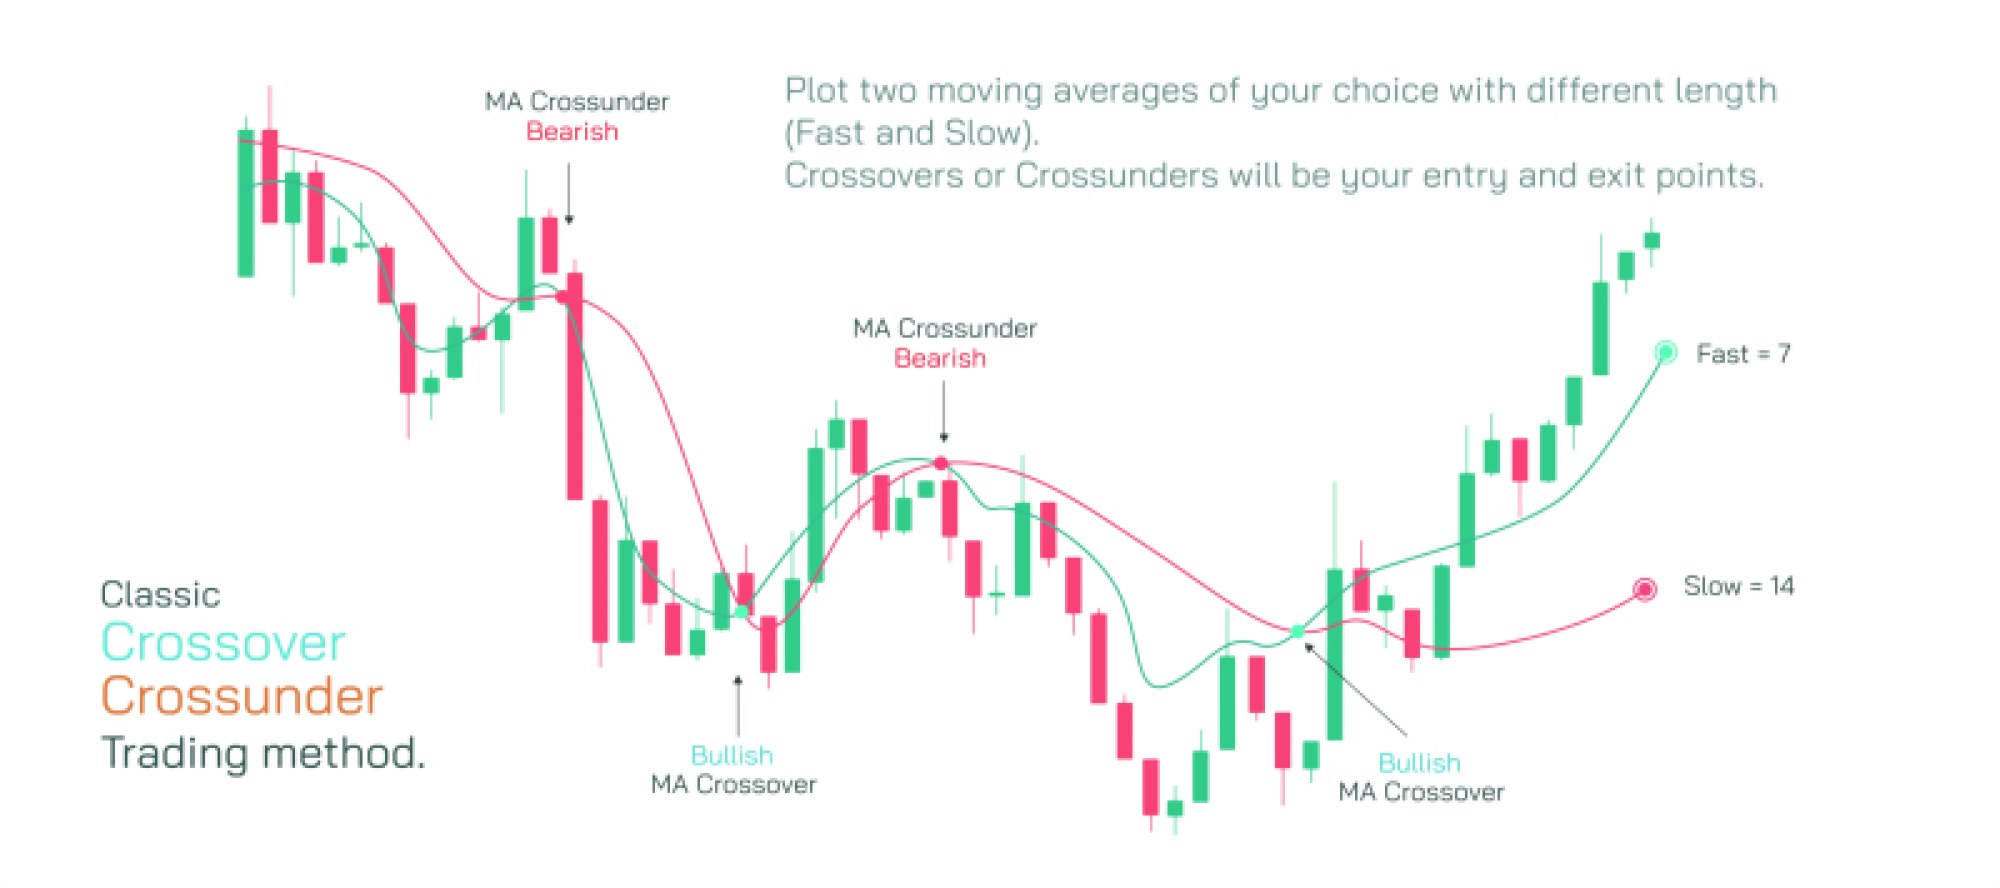
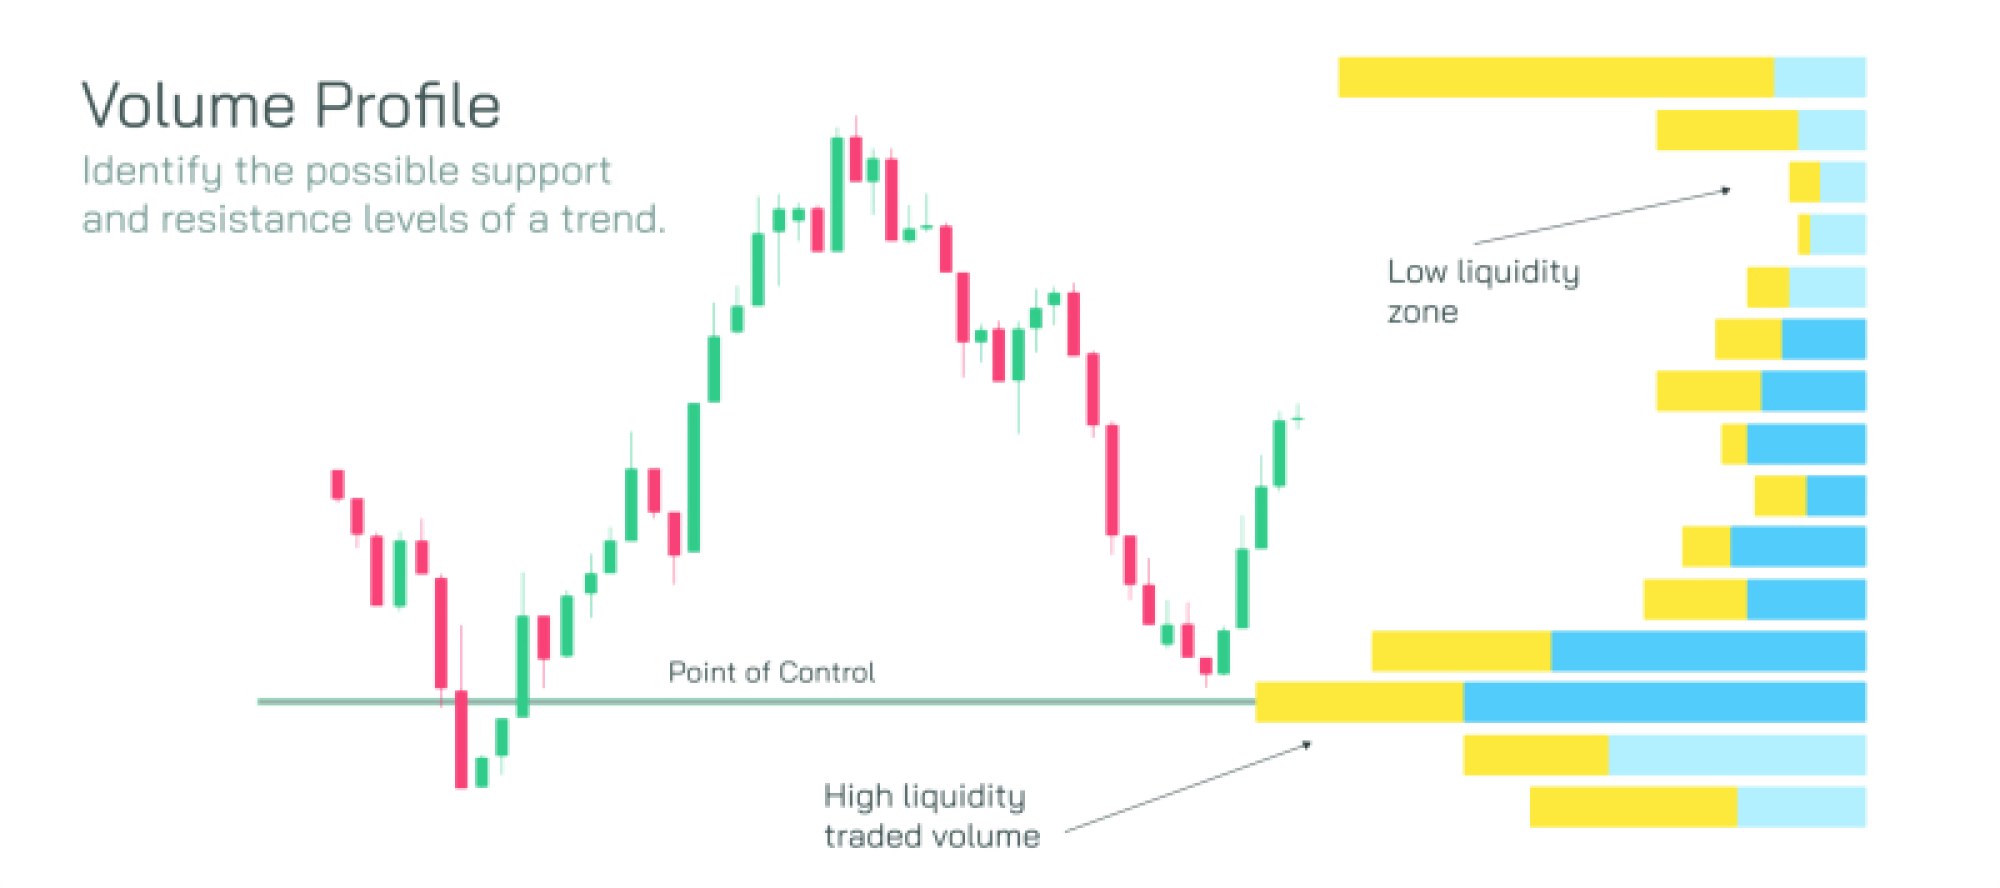
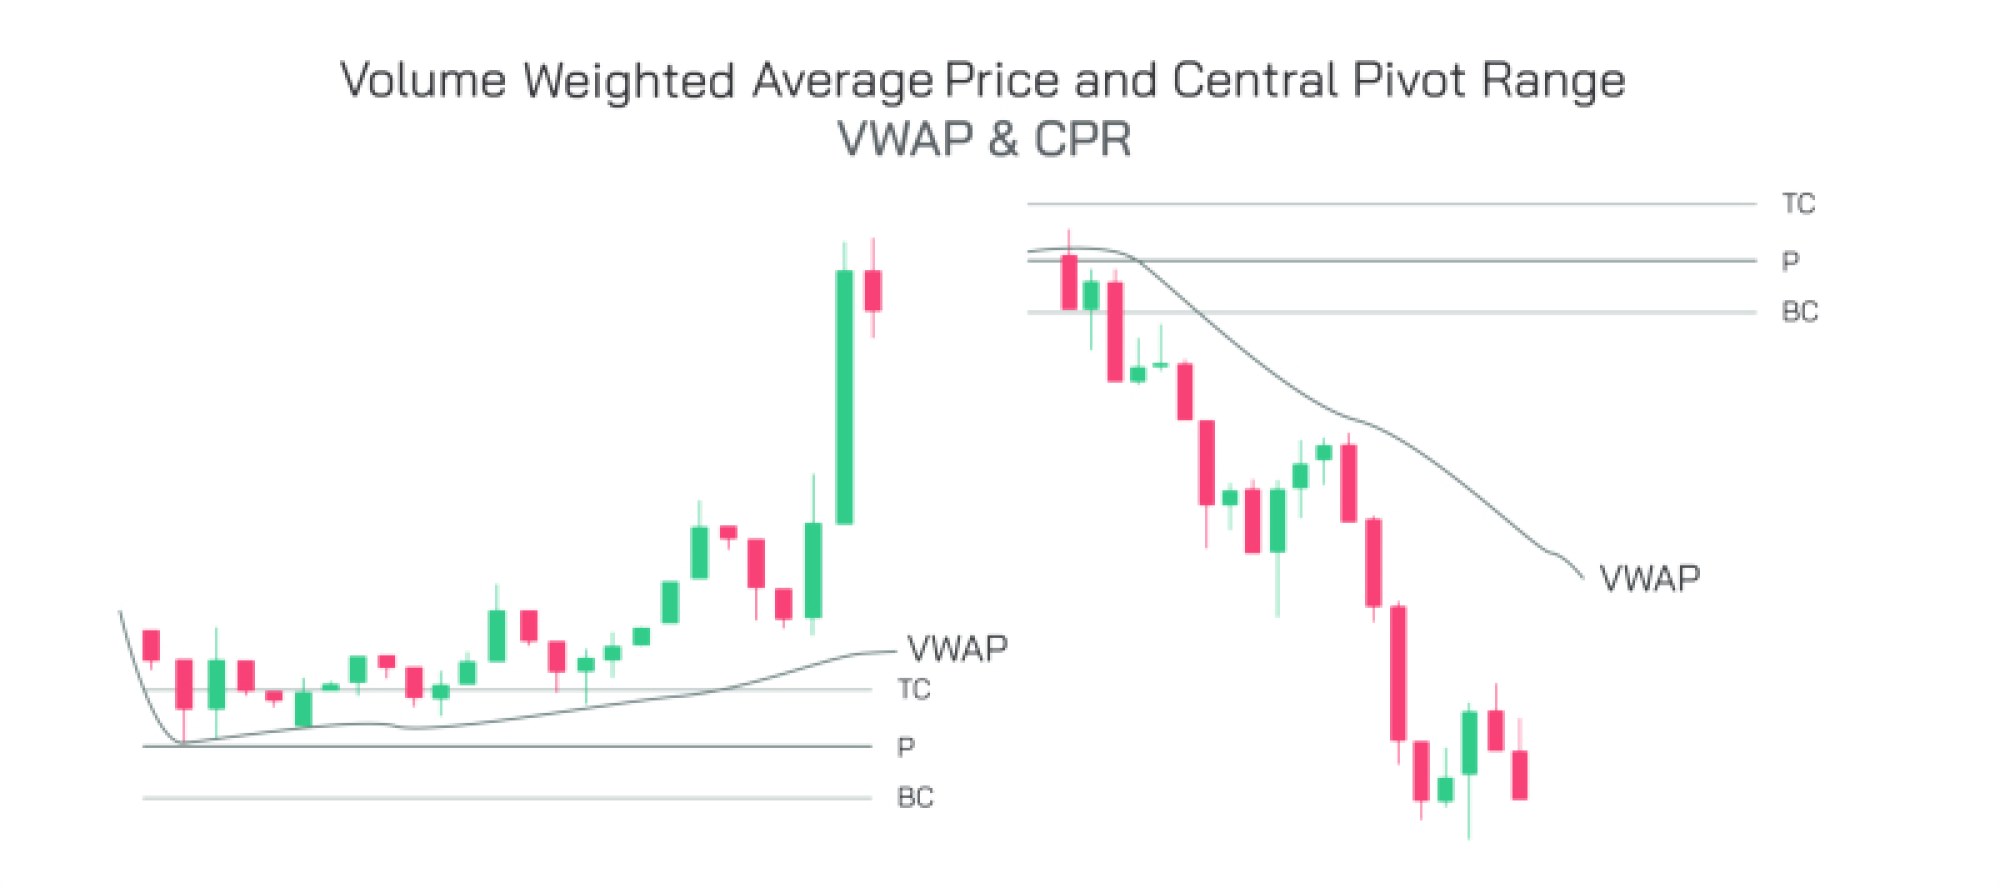
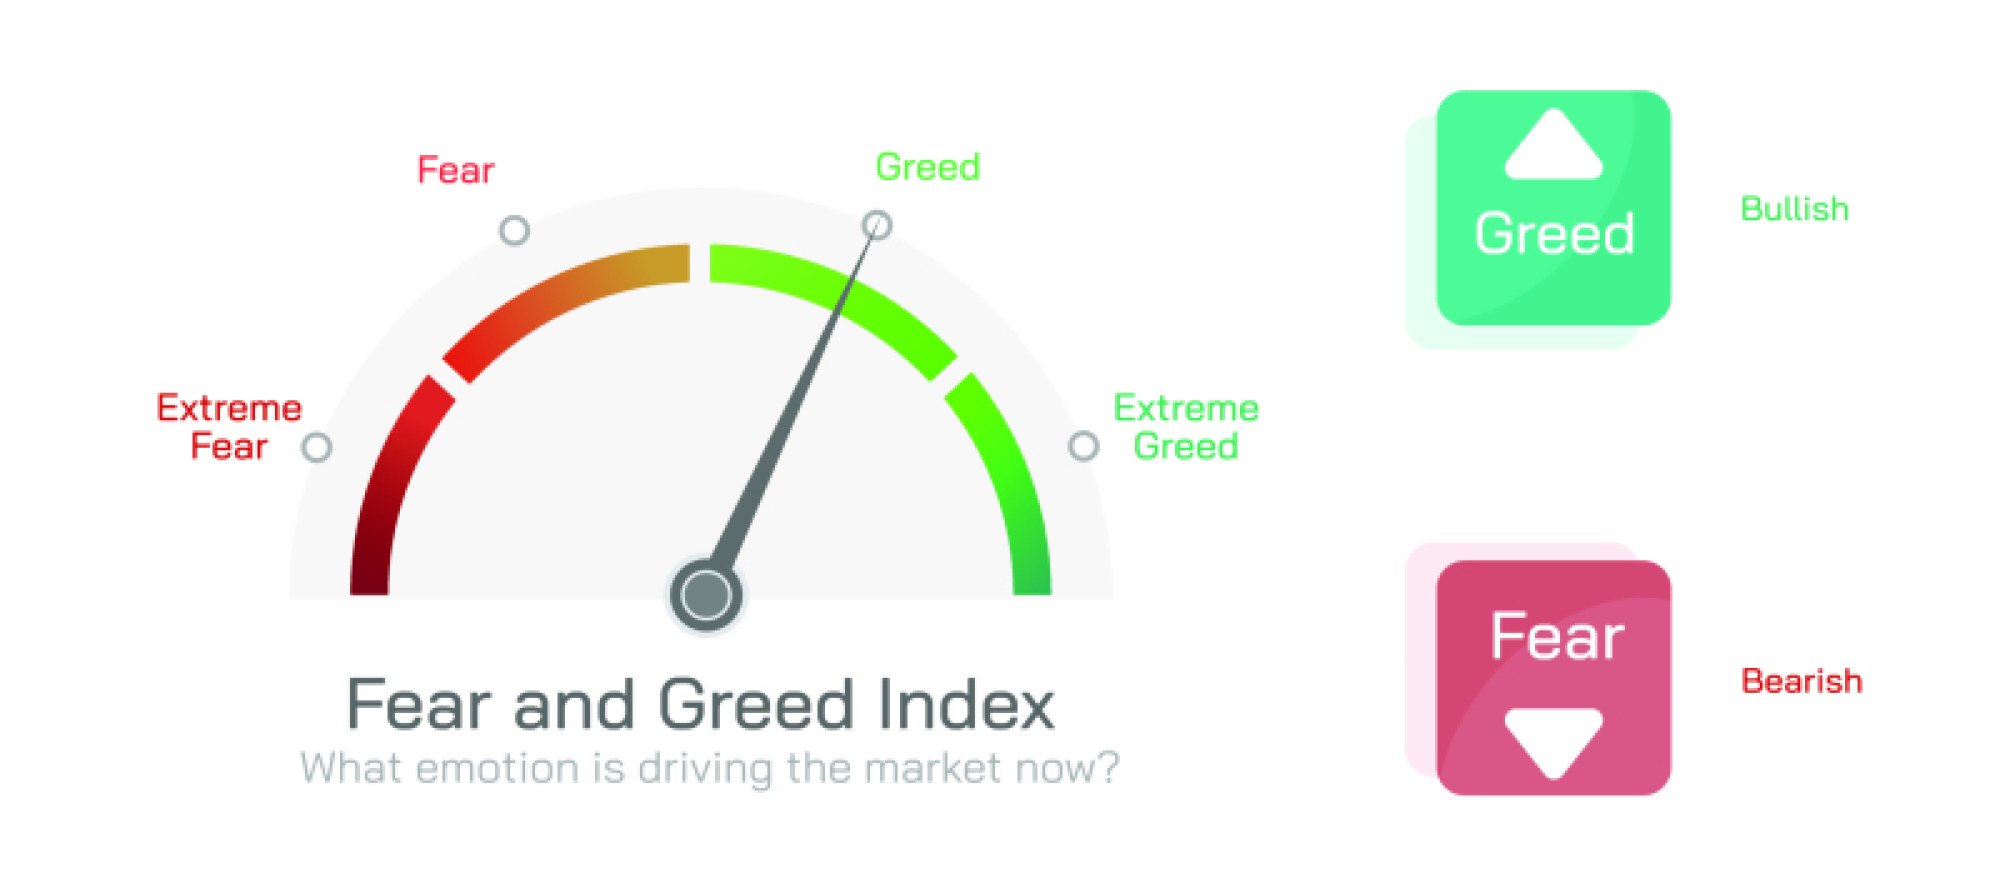
Chart pattern breakdowns are also closely tied to volume and market sentiment. A breakdown accompanied by high trading volume typically confirms the pattern’s validity, suggesting that many participants are acting on the signal. Conversely, a low-volume breakdown may indicate a temporary move or a false signal. Technical analysts combine the breakdown concept with trend lines, moving averages, and other indicators to increase confidence in their market predictions.
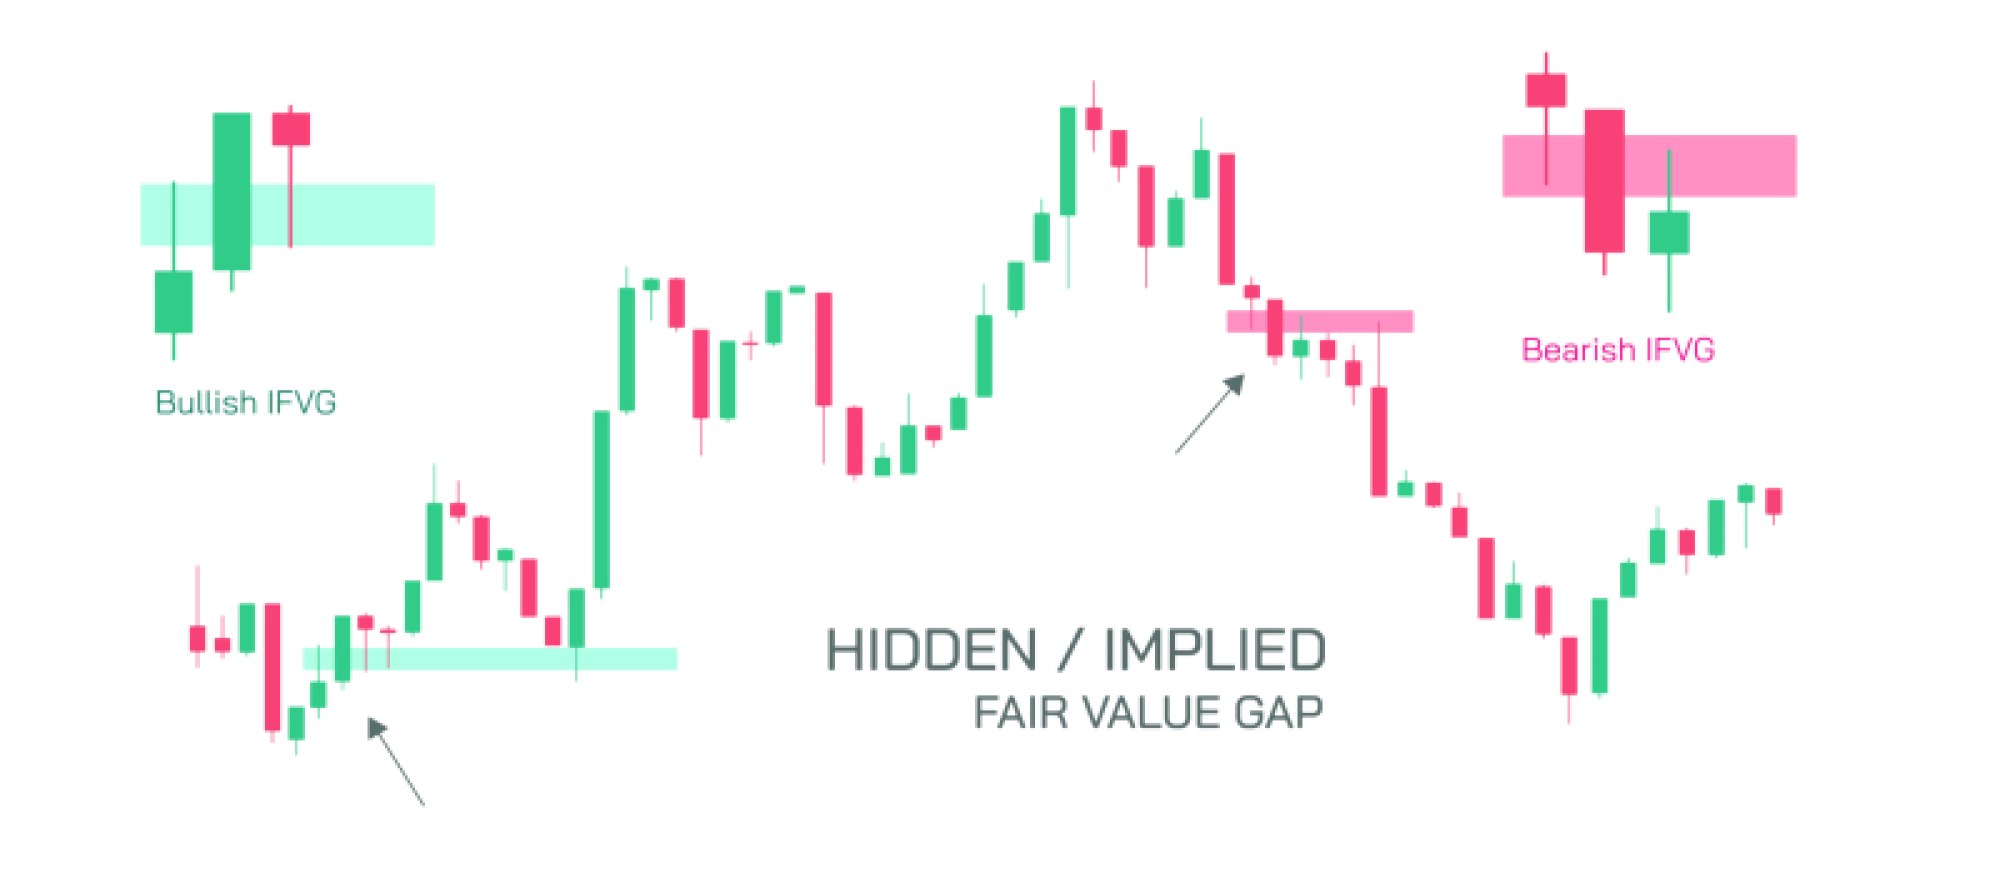
Educational illustrations of stock market chart pattern breakdowns visually highlight the price movement below support levels, trend line breaches, and potential target levels. These diagrams are invaluable for traders, investors, and students of finance, providing clear insights into market psychology, trend behavior, and strategic decision-making. By understanding the breakdown concept, market participants can improve timing, risk management, and overall trading performance.