Stock Market Bullish and Bearish Implied FVG — Concept and Understanding
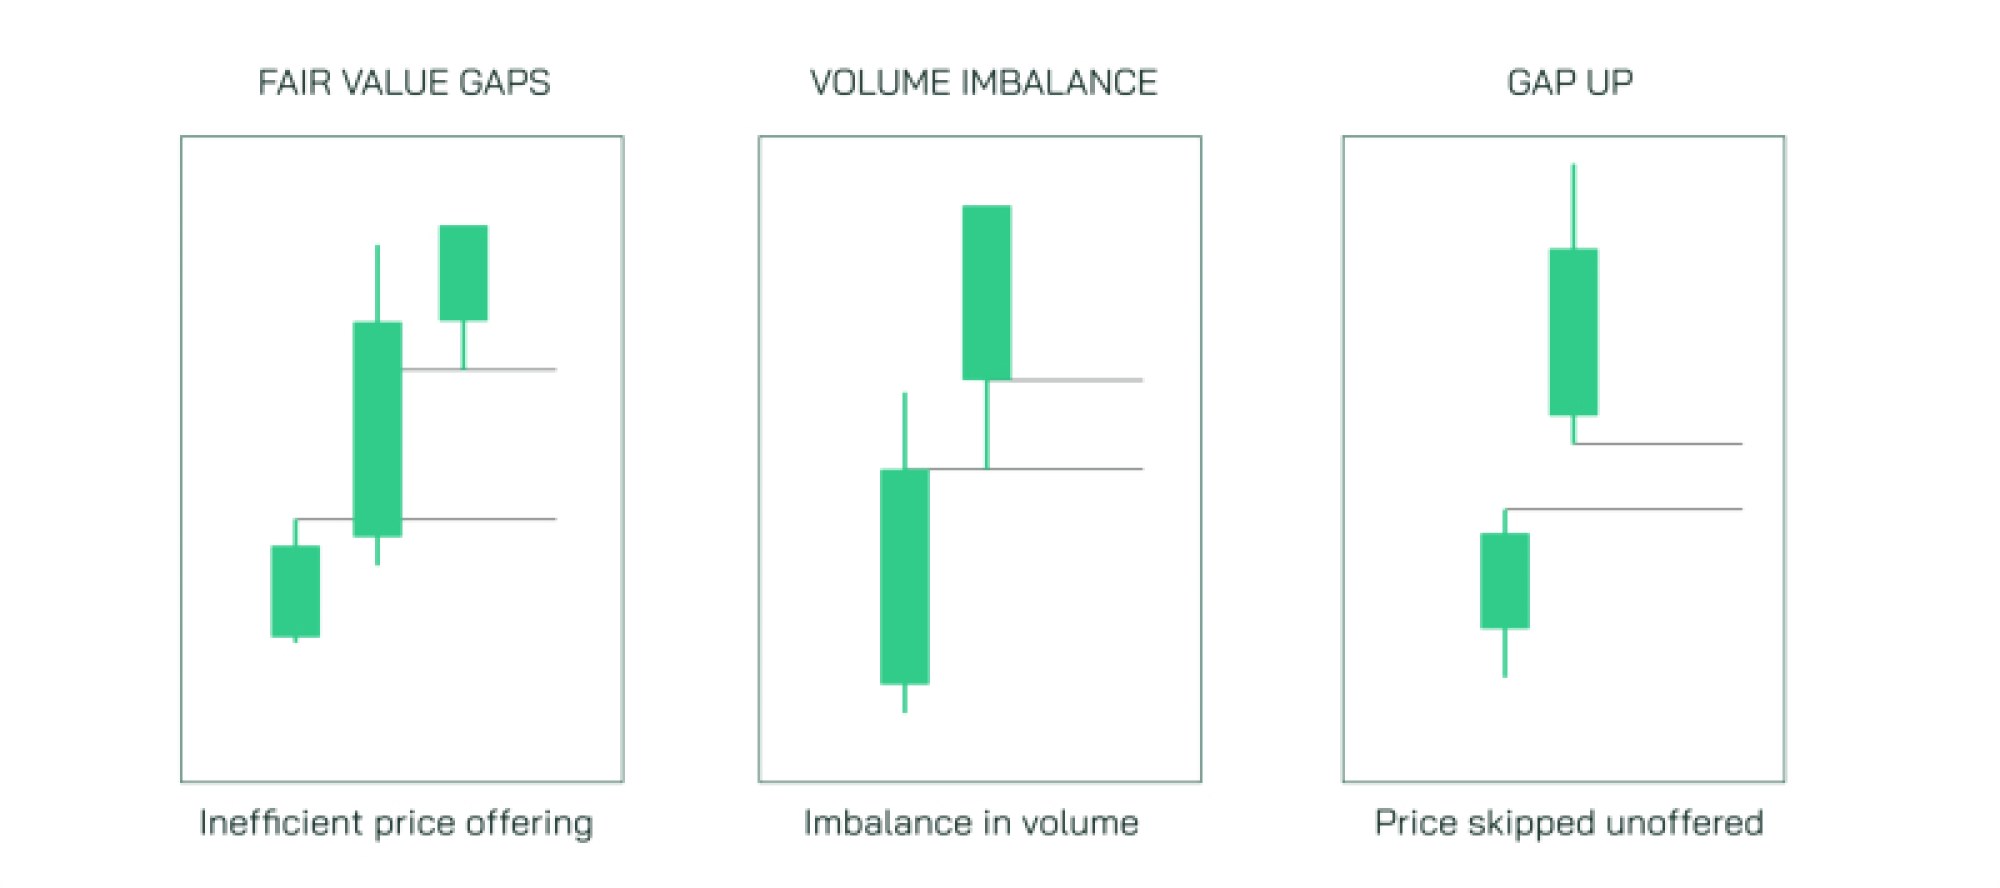
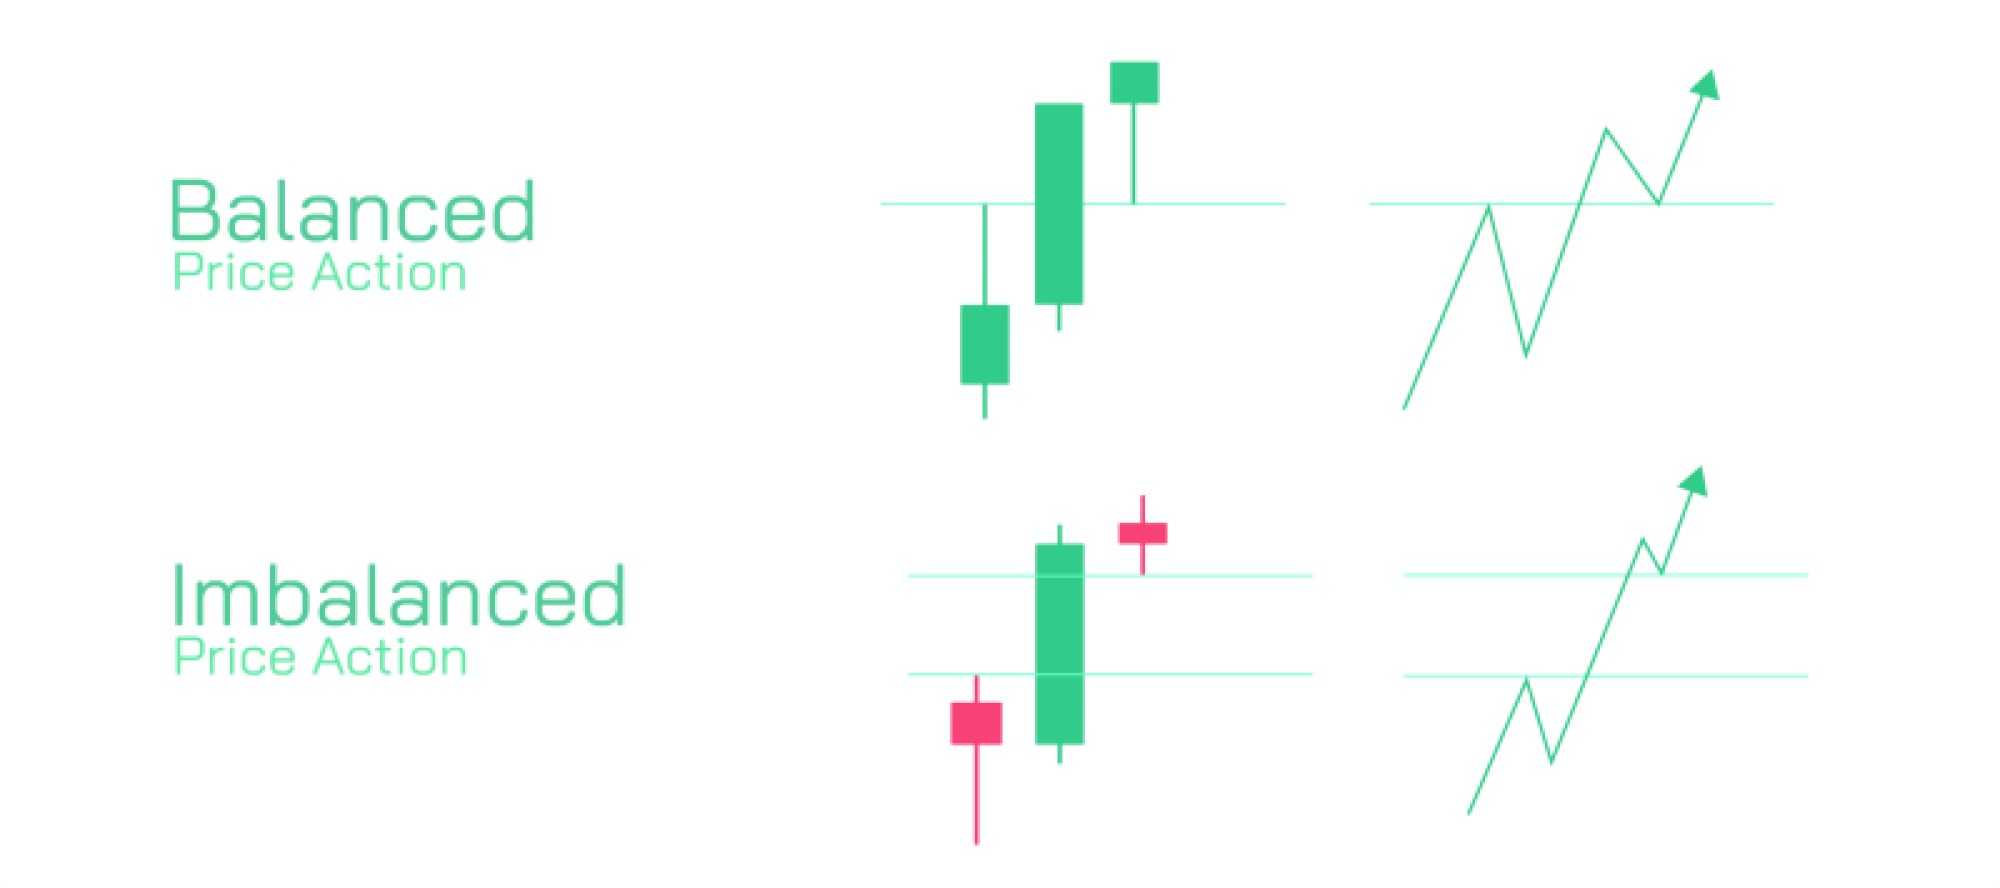
The concept of Fair Value Gaps (FVG) is an advanced tool in technical stock market analysis, used to identify price imbalances where supply and demand temporarily diverge. An implied FVG occurs when price movements leave gaps between candles or bars on a chart, suggesting that the market may revisit these levels to restore equilibrium. Recognizing these gaps helps traders understand potential price reversals, continuation patterns, and areas of high probability for market entry or exit.
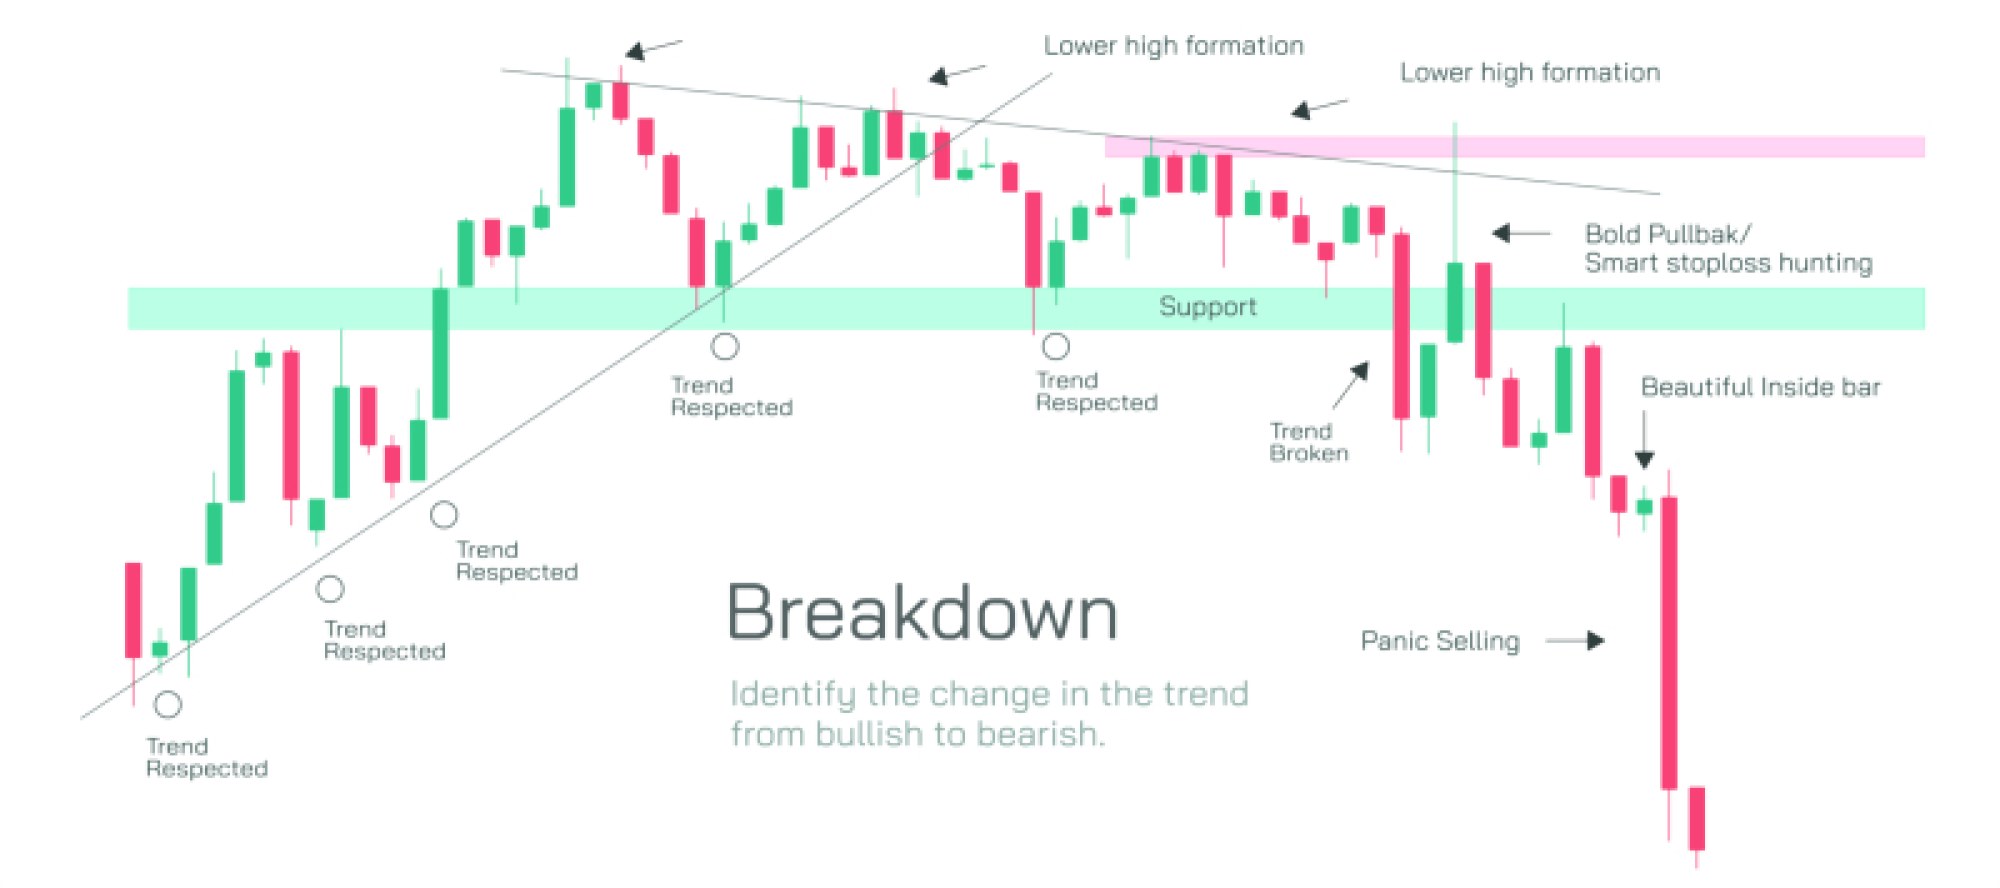
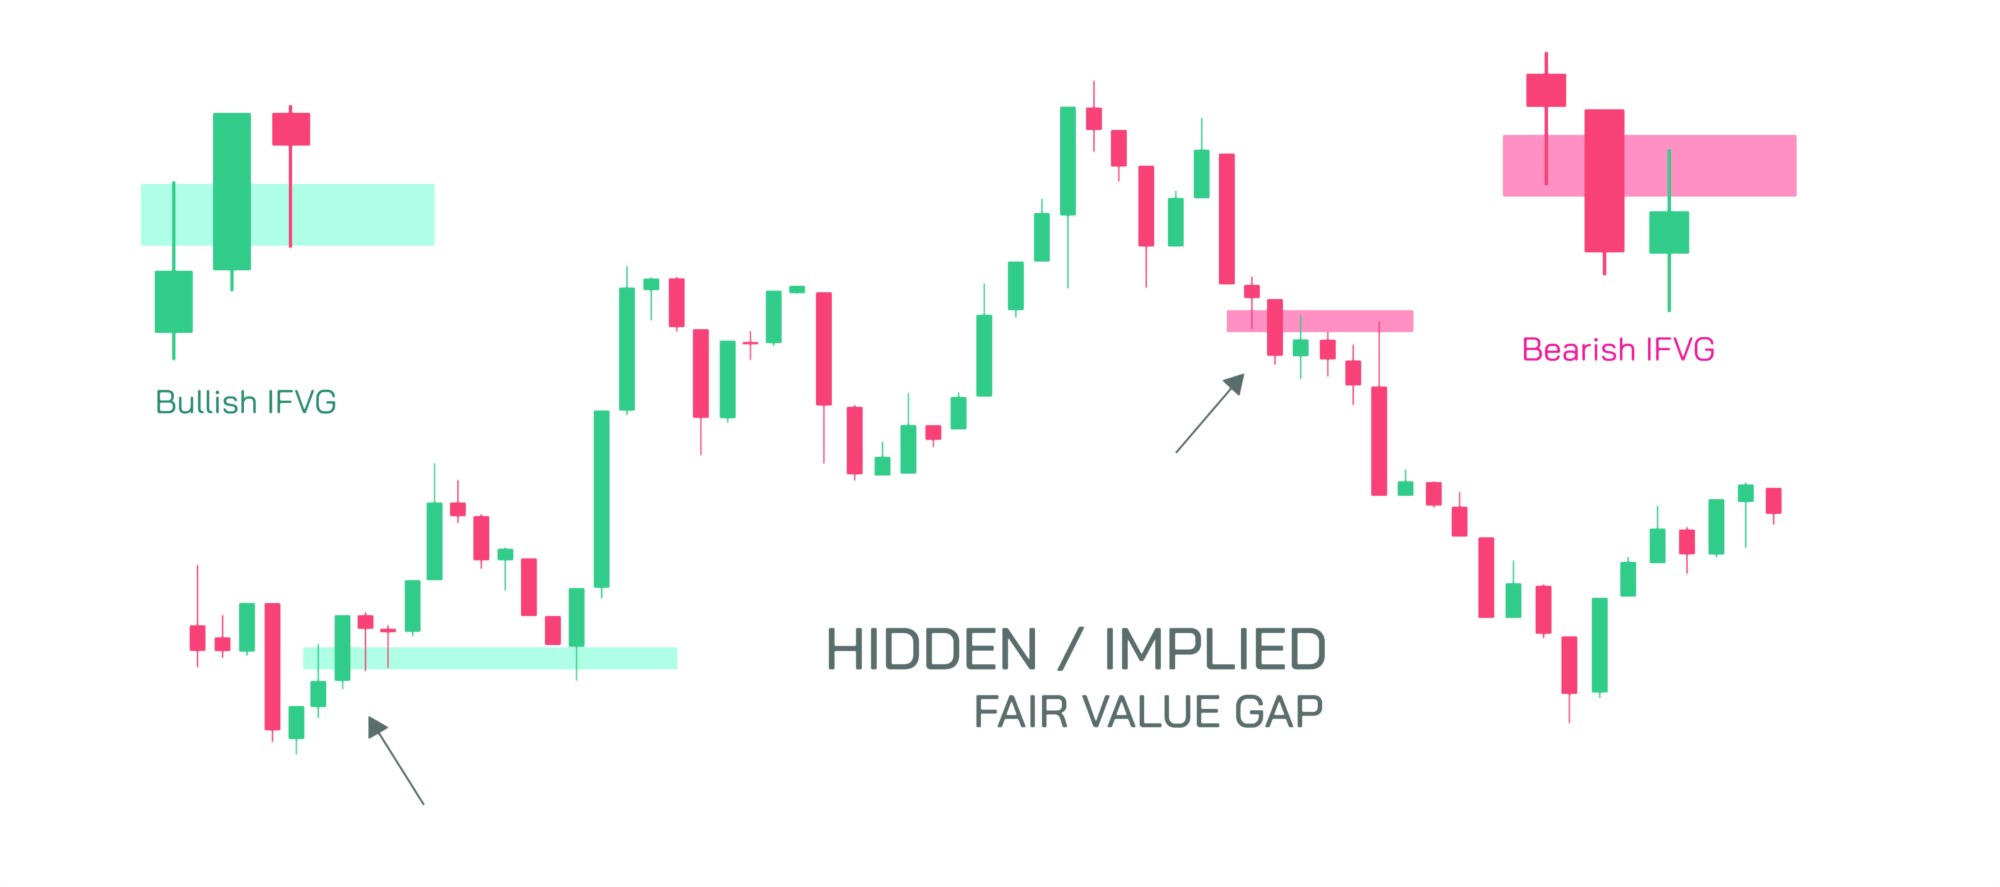
Bullish implied FVG appears when market buyers dominate, creating upward price momentum that leaves gaps below the current price action. These gaps indicate unfilled buy orders or weak seller resistance, offering opportunities for traders to anticipate price continuation or potential retracement to the gap for support. Conversely, bearish implied FVG emerges when sellers overwhelm buyers, leaving gaps above the current price action. These gaps reflect unfilled sell orders or weak buying pressure, signaling potential continuation of downward movement or temporary retracement to the gap for resistance.
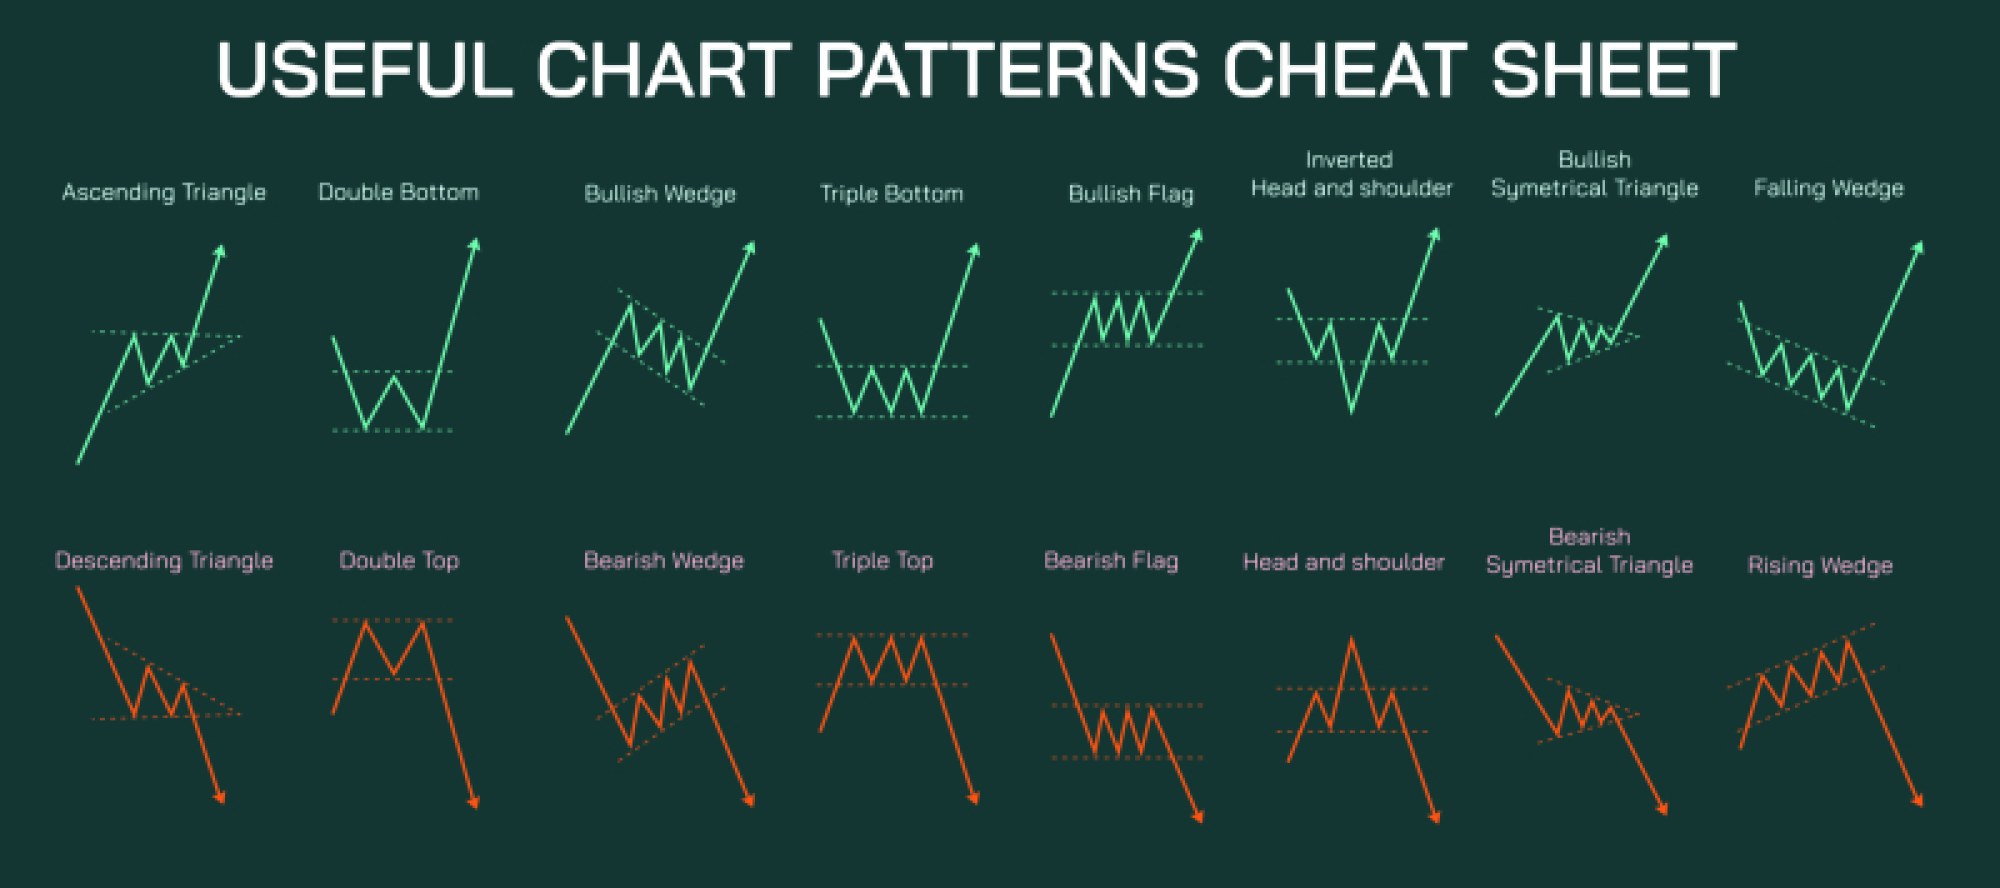
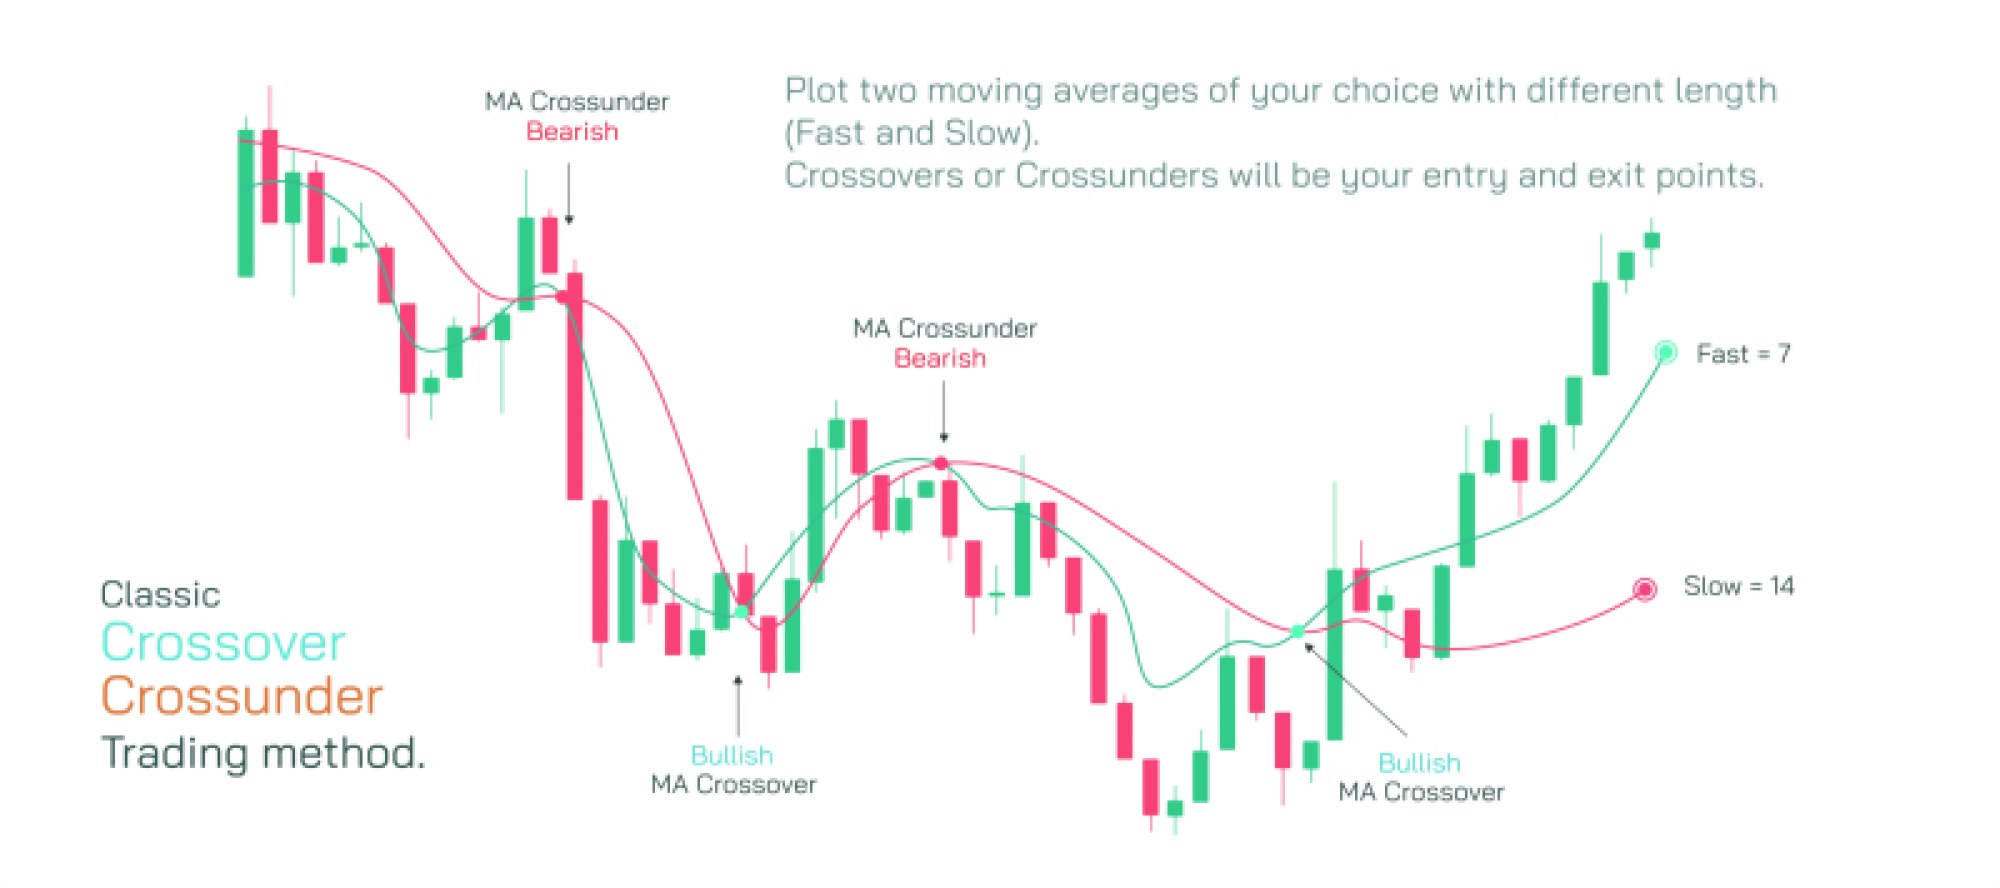
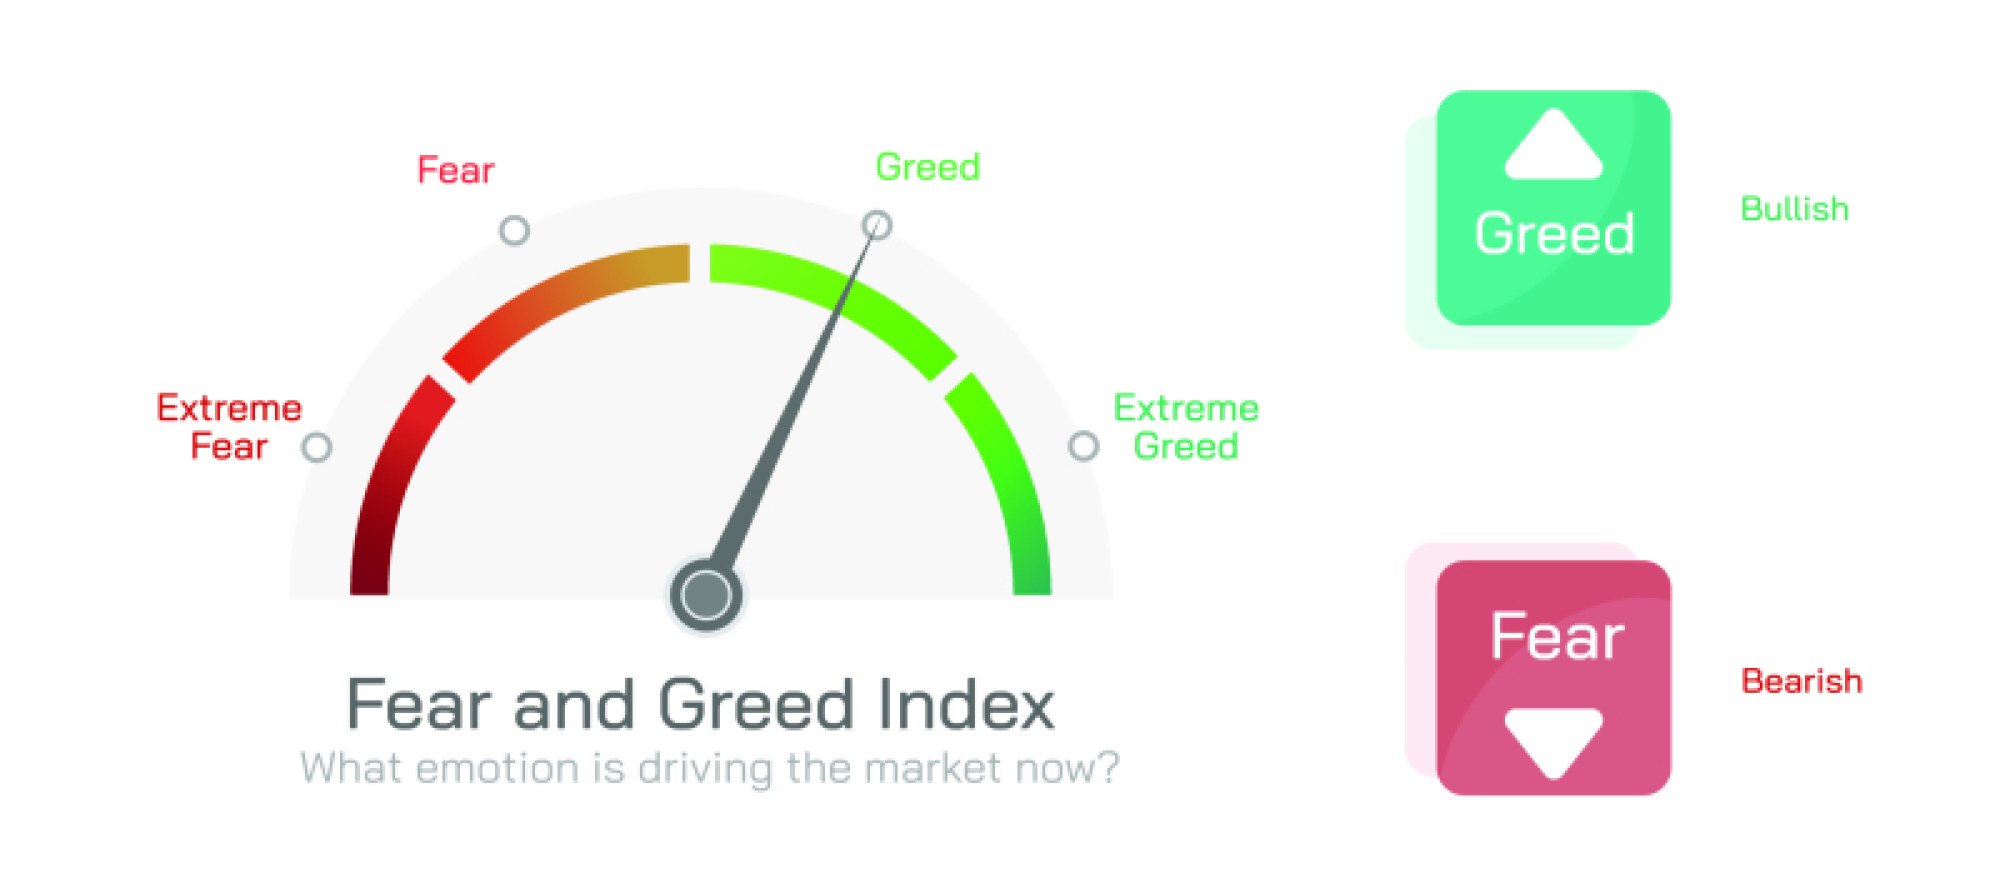
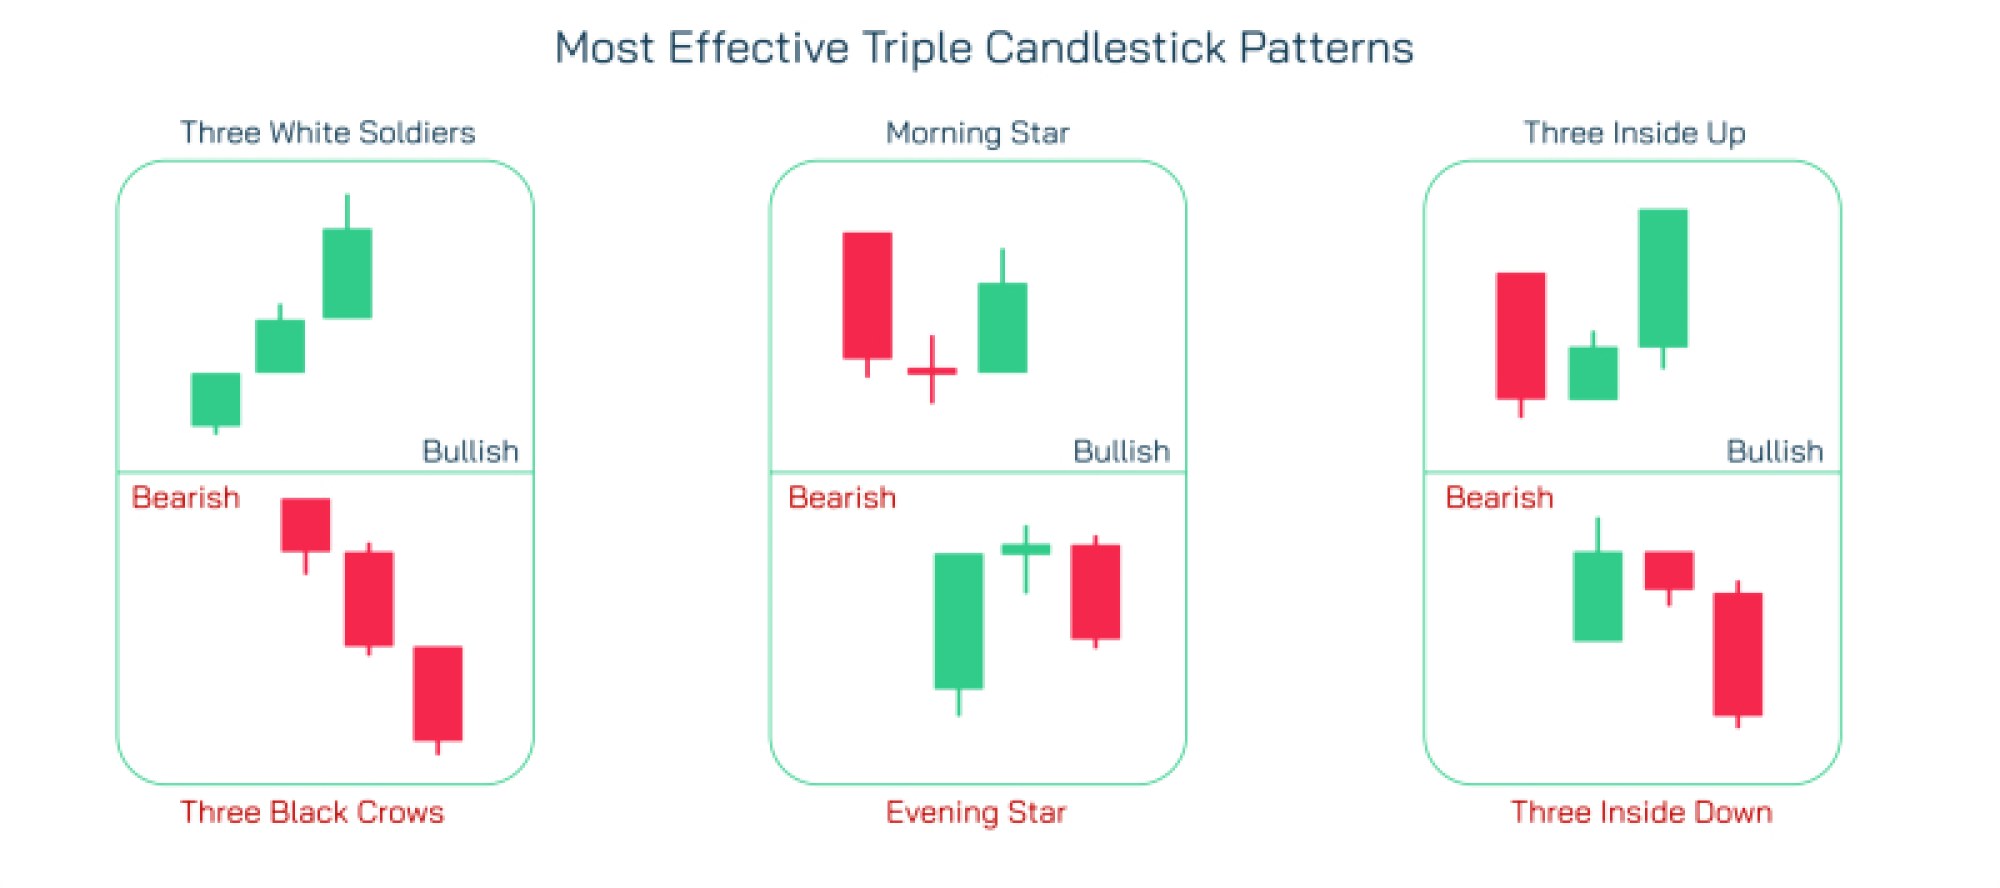
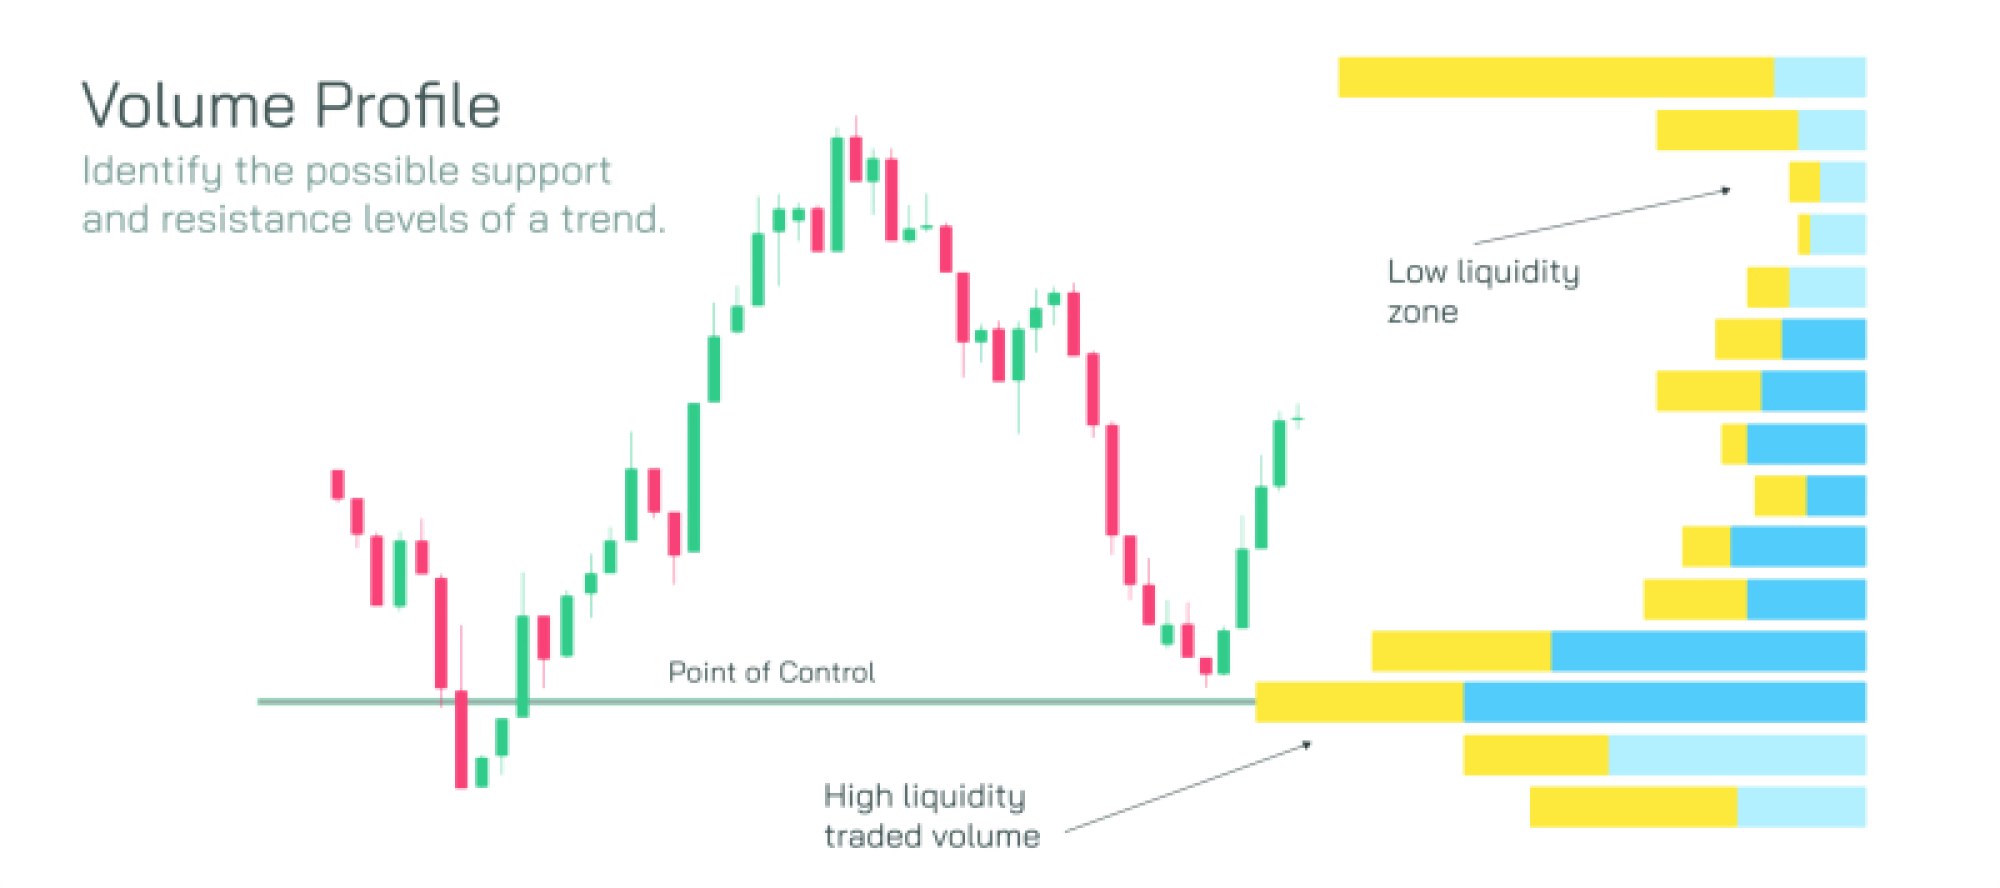
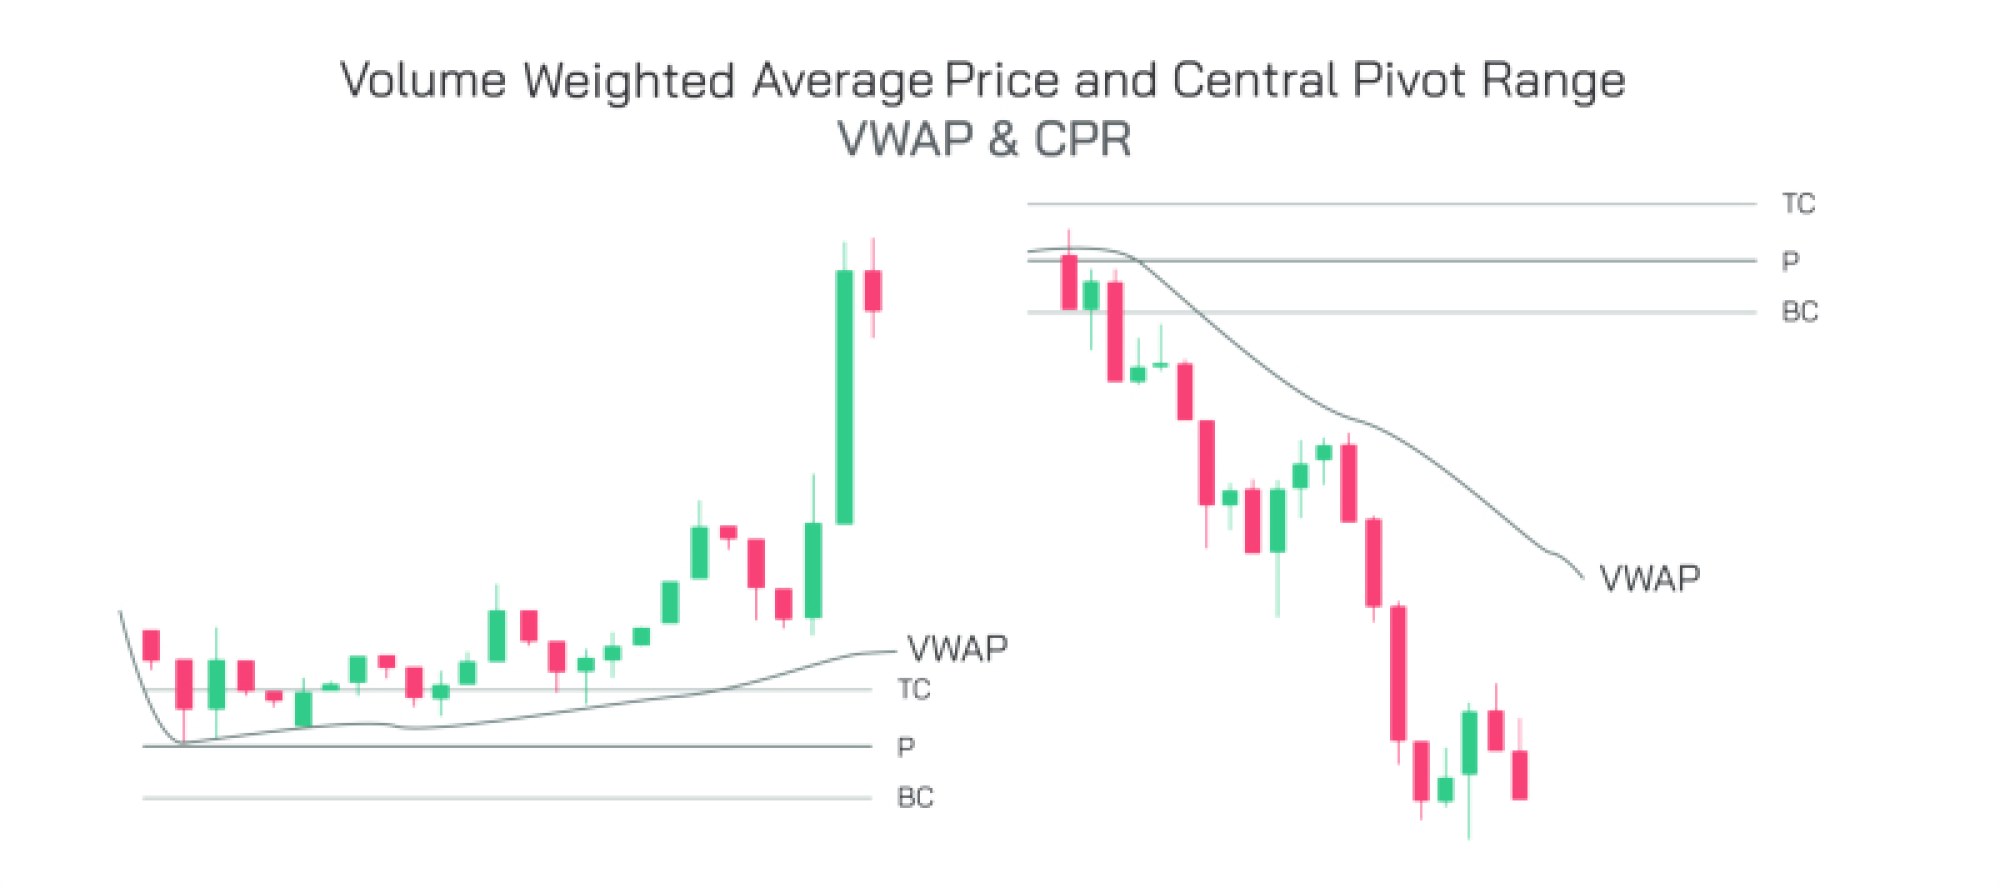
Identifying and understanding implied FVG requires analyzing candlestick patterns, price swings, and market context. Traders often combine FVG analysis with other technical tools such as trend lines, moving averages, and volume data to validate signals. High trading volume around gaps can confirm their strength, while low volume may indicate a weaker signal or potential false breakout. FVG analysis also provides insight into market sentiment, showing whether buyers or sellers are currently dominating and highlighting areas where liquidity is likely to be absorbed.
Educational illustrations of bullish and bearish implied FVG visually demonstrate price gaps, showing where the market may return to balance and how these gaps act as support or resistance zones. Such diagrams are essential for traders, analysts, and students of finance, enabling clear comprehension of price imbalances, market dynamics, and strategic decision-making. Mastery of FVG concepts helps market participants enhance timing, risk management, and overall trading effectiveness in both trending and consolidating markets.