Hemolysis Illustration: Breakdown of Red Blood Cells and Release of Hemoglobin Explained
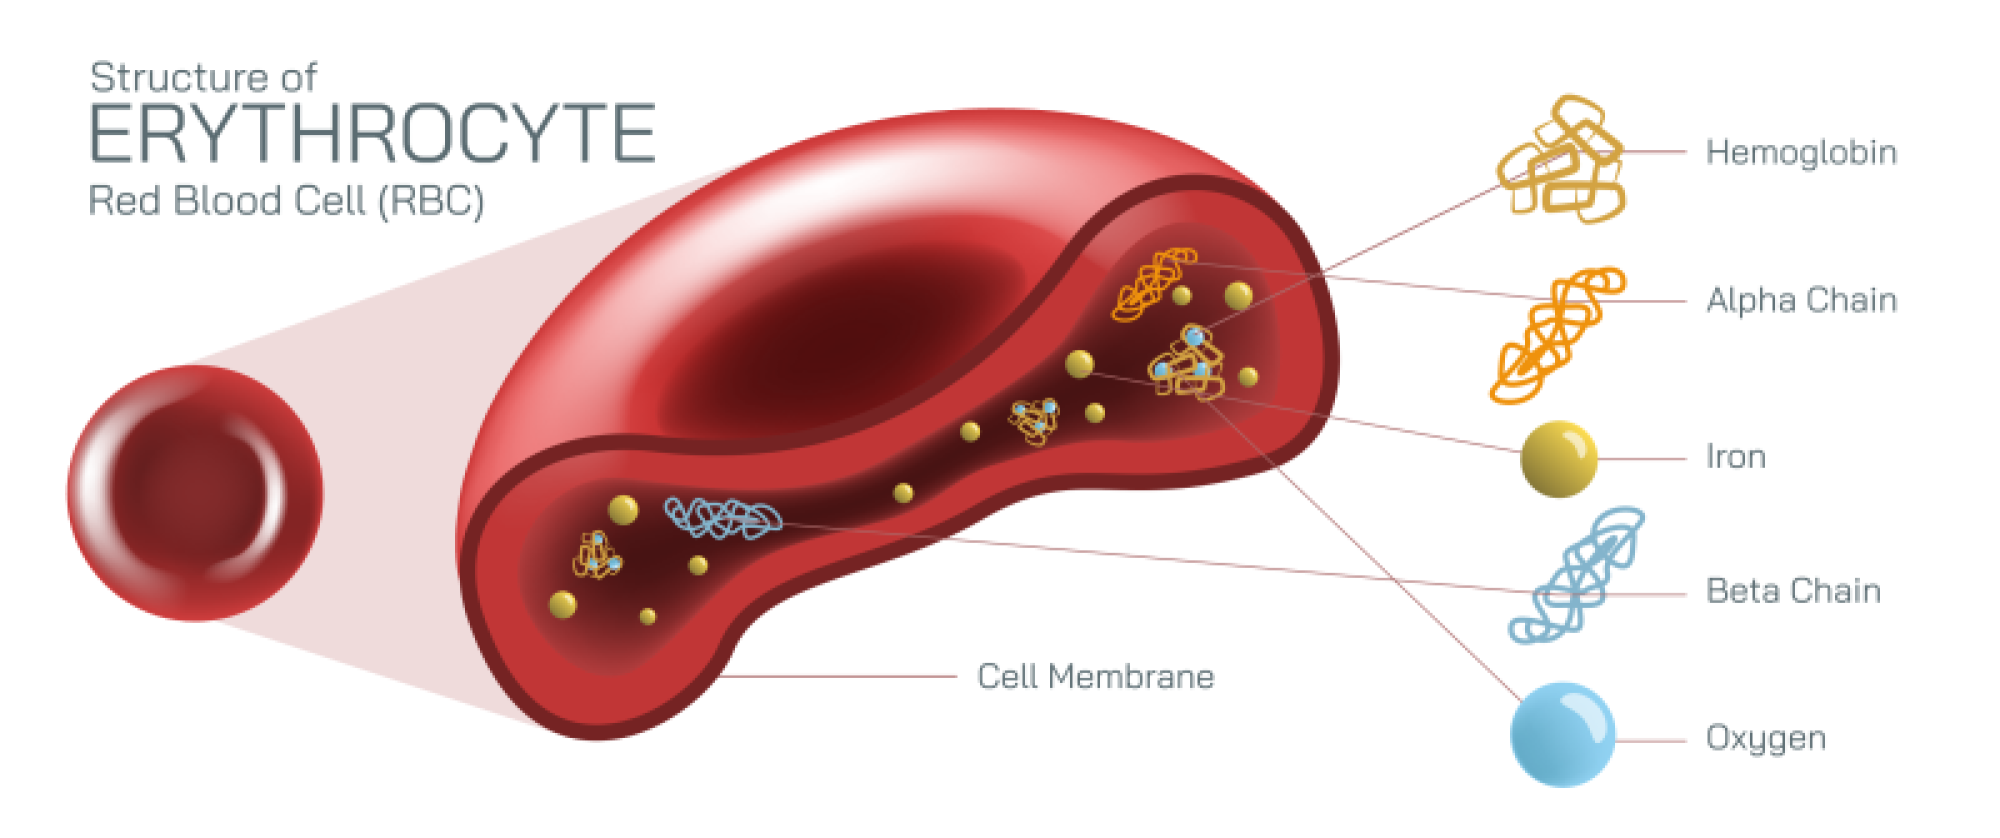
Hemolysis is the biological process in which red blood cells rupture and release their internal contents—most notably hemoglobin—into the surrounding plasma, and an illustration that depicts this event at both the cellular and systemic levels provides a clear understanding of how it affects human physiology. Red blood cells (RBCs) normally circulate for about 120 days, carrying oxygen from the lungs to body tissues and returning carbon dioxide for exhalation. These cells are built around flexibility and durability: their biconcave disc shape allows them to bend through narrow capillaries while maximizing surface area for gas exchange. Inside each RBC is a dense, concentrated supply of hemoglobin, the iron-containing protein responsible for oxygen transport and the red coloration of blood. In a healthy life cycle, RBCs are removed gradually by macrophages in the spleen and liver. Hemolysis, however, disrupts this balance by destroying red blood cells prematurely, reducing oxygen transport and releasing hemoglobin into circulation, where it can cause downstream physiological effects.
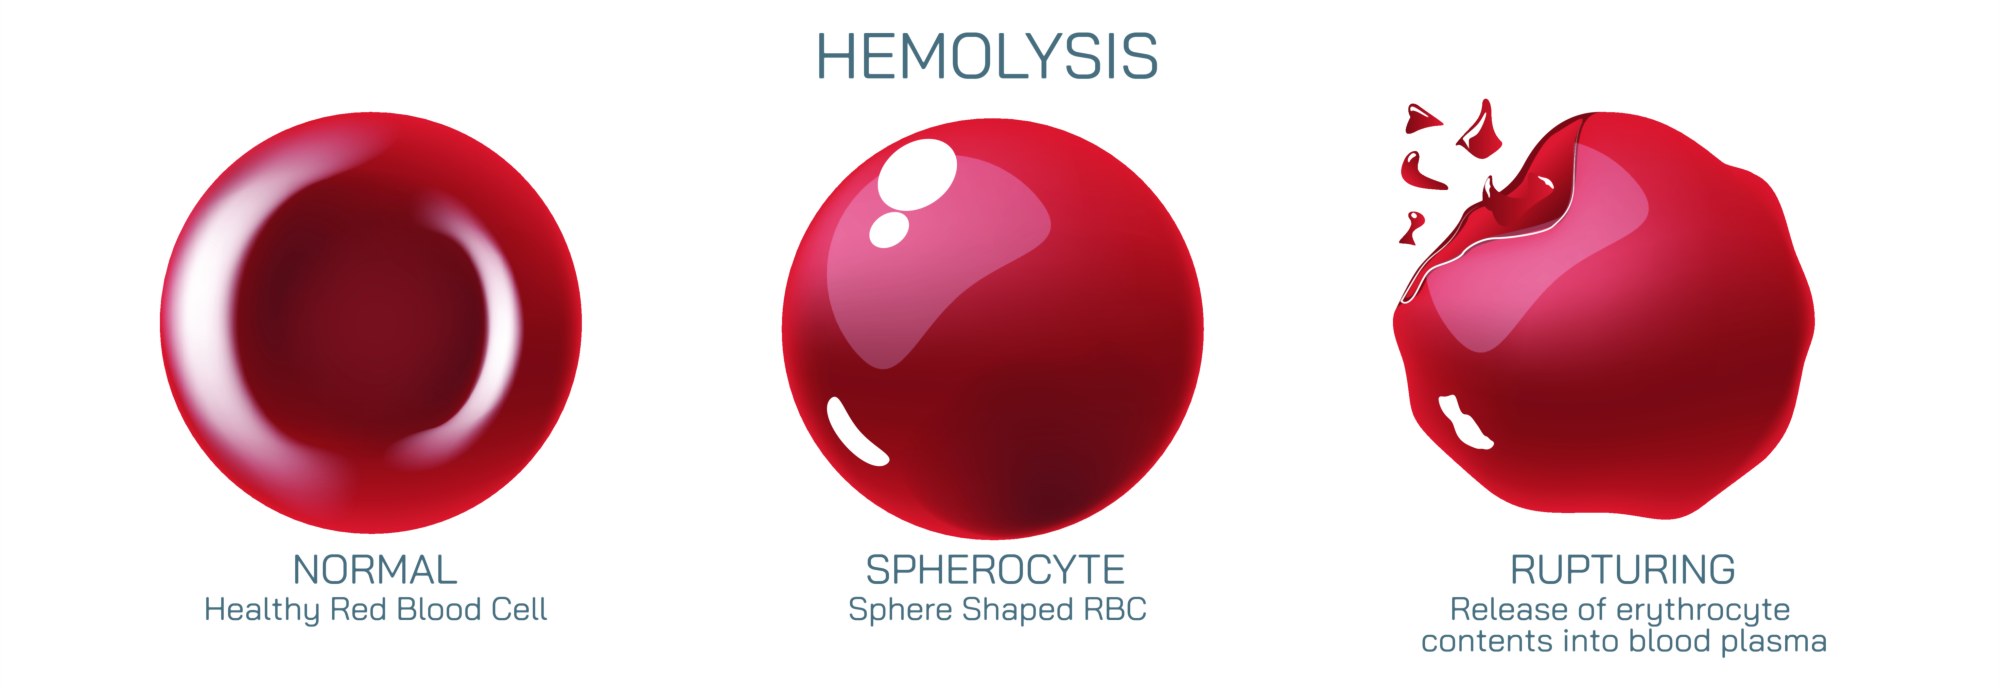
When this process is illustrated visually at the cellular level, red blood cells are often shown swelling, fragmenting, or rupturing under stress. The RBC membrane—normally smooth and sturdy—appears compromised during hemolysis. Stresses such as immune attack, toxins, mechanical trauma, infections, or genetic membrane defects can weaken the lipid bilayer and cytoskeletal network that maintain the RBC’s structure. As the membrane becomes unstable, the cell loses its integrity and bursts. In these diagrams, hemoglobin streams outward into the plasma, sometimes forming visible clouds or expanding waves of reddish pigment. The contrast between intact, healthy cells and those undergoing hemolysis reinforces the role of membrane stability in RBC survival.
An illustration comparing intravascular hemolysis and extravascular hemolysis deepens the overall understanding of this process. In intravascular hemolysis, red blood cells break apart directly within the blood vessels. Visual diagrams typically show RBC destruction occurring in the circulation itself, often with free hemoglobin appearing in the plasma. Plasma hemoglobin is normally bound and neutralized by a protective scavenger protein called haptoglobin, which carries hemoglobin to the liver for safe breakdown. When hemolysis becomes excessive, haptoglobin becomes depleted and free hemoglobin accumulates. Once bound capacity is exceeded, free hemoglobin may be filtered by the kidneys, resulting in hemoglobinuria, where urine becomes dark or reddish in color. Illustrations of kidney filtration imagery often show hemoglobin molecules passing through damaged glomerular barriers, highlighting why intravascular hemolysis can lead to kidney stress or acute renal injury.
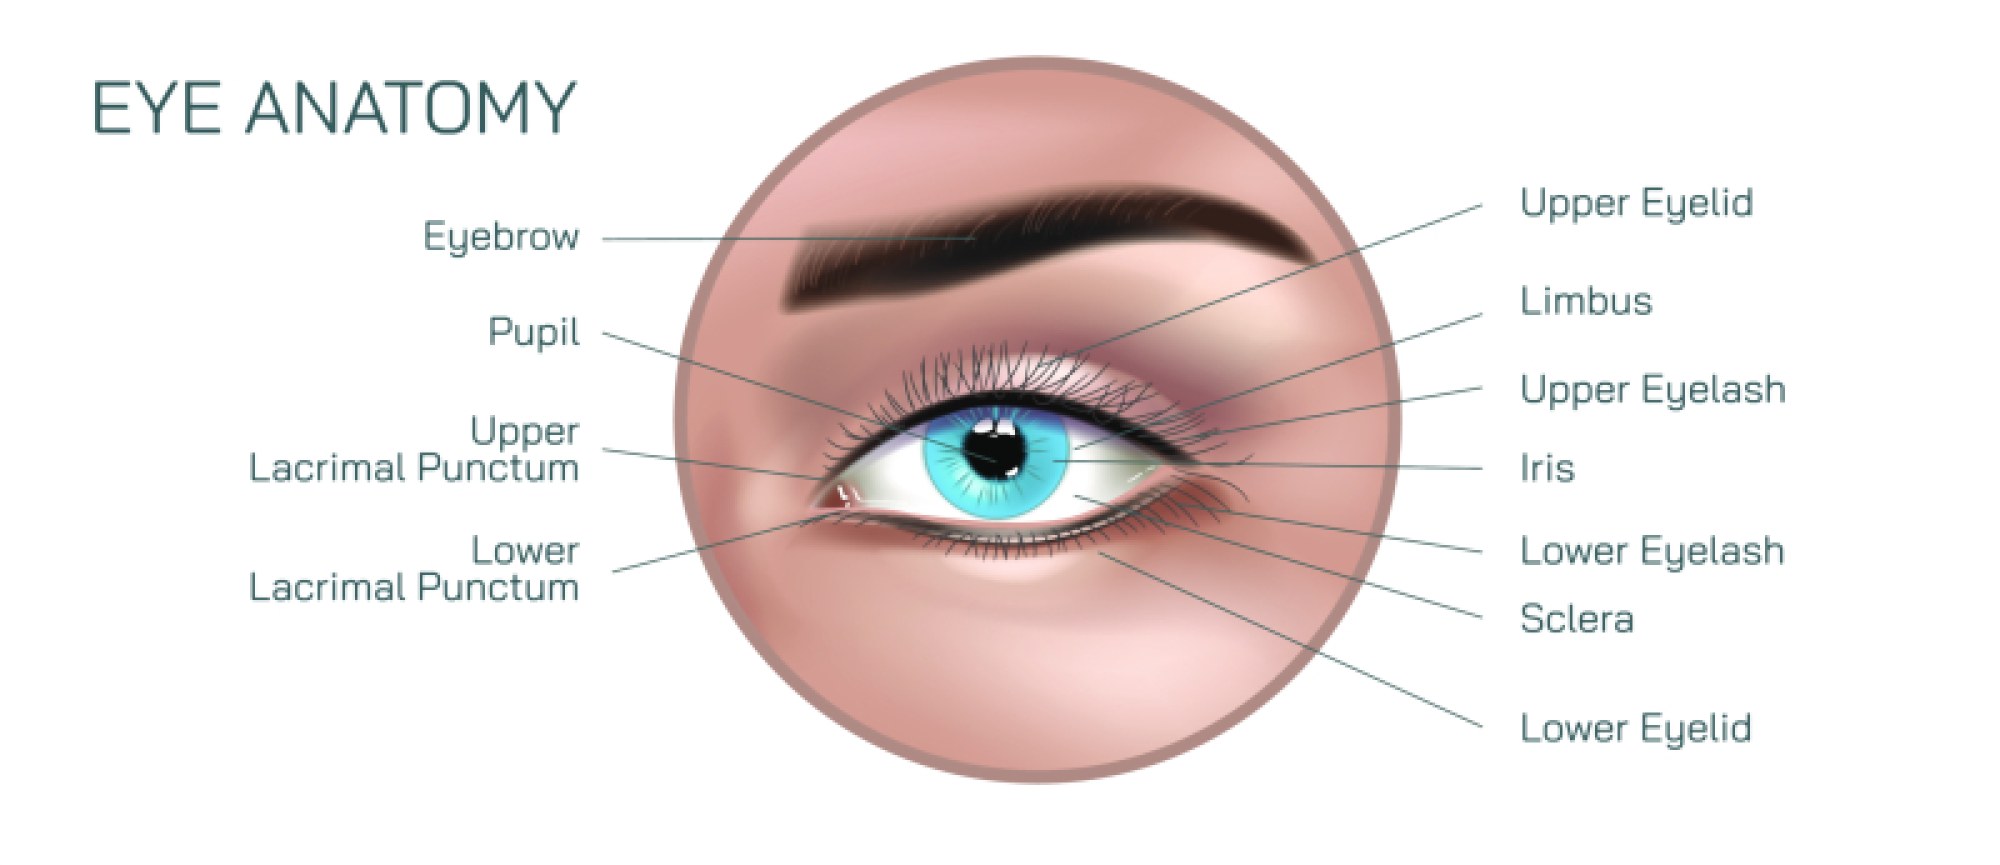
Extravascular hemolysis, in contrast, occurs primarily inside macrophages in the spleen, liver, or bone marrow. In illustrations of this pathway, RBCs are engulfed by macrophages through phagocytosis. Rather than bursting into the bloodstream, hemoglobin breakdown happens within the macrophage. The heme component of hemoglobin is converted into biliverdin and then bilirubin, a yellow pigment carried to the liver for further processing and elimination through bile. When extravascular hemolysis increases beyond normal physiologic rates, bilirubin levels rise and can overwhelm the liver’s ability to conjugate and excrete it, leading to jaundice, where the skin and eyes become yellow. Illustrations of the bilirubin pathway connect hemolysis to jaundice, emphasizing how cellular destruction influences biochemical and clinical signs.
Another important feature of hemolysis diagrams is the representation of causes and triggers, which vary widely across medical, environmental, and genetic contexts. Immune-mediated hemolysis is illustrated with antibodies binding to red blood cell surfaces, marking them for destruction. In autoimmune hemolytic anemia, the body mistakenly targets its own cells, and in transfusion reactions, incompatible donor RBCs are attacked by the recipient’s immune system. In hereditary conditions such as sickle cell disease, hereditary spherocytosis, or G6PD deficiency, the RBC membrane or internal enzymes are inherently flawed, making cells more prone to rupture under stress. Illustrations of sickle cell hemolysis often depict the elongated, rigid sickled RBCs becoming trapped in narrow blood vessels, tearing, or fragmenting due to their inability to deform. In mechanical hemolysis, RBCs are illustrated passing through turbulent environments, such as malfunctioning heart valves or medical devices, where physical damage causes membrane rupture. Infectious causes—most famously malaria—are depicted with parasites invading RBCs, replicating inside them, and ultimately bursting the cells as the parasite cycle continues. Each variation of these diagrams shows that hemolysis may be a final common pathway reached through many different mechanisms.
Hemolysis illustrations often extend beyond the breakdown of red blood cells to highlight its systemic effects. Free hemoglobin in circulation binds strongly to nitric oxide, a molecule essential for regulating blood vessel dilation. When hemolysis is extensive, scavenging of nitric oxide by plasma hemoglobin results in vasoconstriction, hypertension, and reduced blood flow to tissues. Diagrams showing narrowed vessels and reduced perfusion help clarify why hemolysis can trigger pain, fatigue, dizziness, and cardiovascular stress. Severe hemolysis depletes RBC count rapidly, leading to anemia, which manifests as weakness, shortness of breath, pallor, and decreased exercise tolerance. Illustrations linking RBC destruction to drops in hematocrit and hemoglobin levels help bridge cellular changes to clinical laboratory findings.
Diagnostic visualizations frequently accompany hemolysis explanations because detection depends on characteristic laboratory patterns. A lab interpretation diagram may show decreased hemoglobin and hematocrit, elevated lactate dehydrogenase (LDH) due to cell rupture, reduced haptoglobin (consumed by binding hemoglobin), and increased indirect bilirubin from heme breakdown. A peripheral blood smear illustration sometimes shows cell fragments—schistocytes—indicating mechanical destruction. The combination of these graphical markers provides a strong visual link between biological breakdown and diagnostic evidence.
At a deeper biochemical level, hemolysis diagrams illustrate the final breakdown of hemoglobin into its component parts. Hemoglobin contains globin proteins, heme groups, and central iron atoms. During breakdown, globin proteins are reduced to amino acids, heme is split into biliverdin and bilirubin, and iron is salvaged and stored for reuse within the body through ferritin and transferrin. This recycling function appears in cyclical diagrams showing how the body usually preserves iron even during red cell turnover but risks iron overload when hemolysis becomes chronic, overwhelming normal storage pathways.
Illustrations of the healing and compensatory response reveal how the body reacts to increased hemolysis. Bone marrow responds by accelerating red blood cell production, sometimes depicted through activated erythropoiesis in marrow cavities. In severe or long-term hemolysis, the body may expand production to additional skeletal sites or trigger extramedullary hematopoiesis in the spleen or liver. These adaptations are often shown as a feedback loop, where oxygen deprivation stimulates the kidneys to release erythropoietin (EPO), which encourages more RBC production.
Ultimately, a hemolysis illustration does much more than show red blood cells bursting—it clarifies an entire chain of physiological cause and effect. It captures the fragility of the RBC membrane, the consequences of membrane damage, the biochemical fate of hemoglobin, the clinical manifestations of anemia and jaundice, and the compensatory mechanisms the body activates when red cell destruction accelerates. Through these visual layers, the concept of hemolysis becomes a complete biological narrative: a disruption of blood cell stability that echoes outward through circulation, metabolism, organ function, and overall health.