Gangrenous Necrosis and Gangrene Illustration: Tissue Death and Infection Explained
Gangrenous necrosis and gangrene represent severe forms of tissue death, most often arising when circulation to an area of the body is lost or when infection overwhelms injured tissues. Although both terms are closely related and sometimes used interchangeably, an illustration comparing them shows critical differences in appearance, cause, and pathological progression. When visual diagrams reveal the internal breakdown of cells, the interruption of blood flow, and the spread of bacterial invasion, the processes behind gangrene become easier to understand and recognize clinically. These visuals highlight why prompt medical intervention is essential to prevent infection from spreading, protect surrounding tissues, and preserve life.
At the cellular level, gangrenous necrosis begins when tissues lose their blood supply. Without adequate oxygen and nutrients, cells quickly exhaust stored energy and lose membrane integrity. Illustrations typically show capillaries and small arteries blocked by clots, trauma, or vascular disease, depriving cells of oxygen and leading to widespread necrosis. Inside each cell, mitochondria swell, enzymes leak, and proteins denature. The plasma membrane ruptures, allowing intracellular contents to spill into surrounding tissue. Unlike the sharply defined microscopic patterns of coagulative or liquefactive necrosis, gangrenous necrosis is macroscopic, meaning it involves entire segments of limbs, digits, or organs. Diagrams portray this distinction by zooming outward from cellular breakdown to large-scale tissue destruction—depicting extensive discoloration, dryness, swelling, putrefaction, or blistering depending on the type of gangrene present.
A useful illustration compares the three major types of gangrene: dry gangrene, wet gangrene, and gas gangrene, each with distinctive visual features and pathogenic mechanisms.
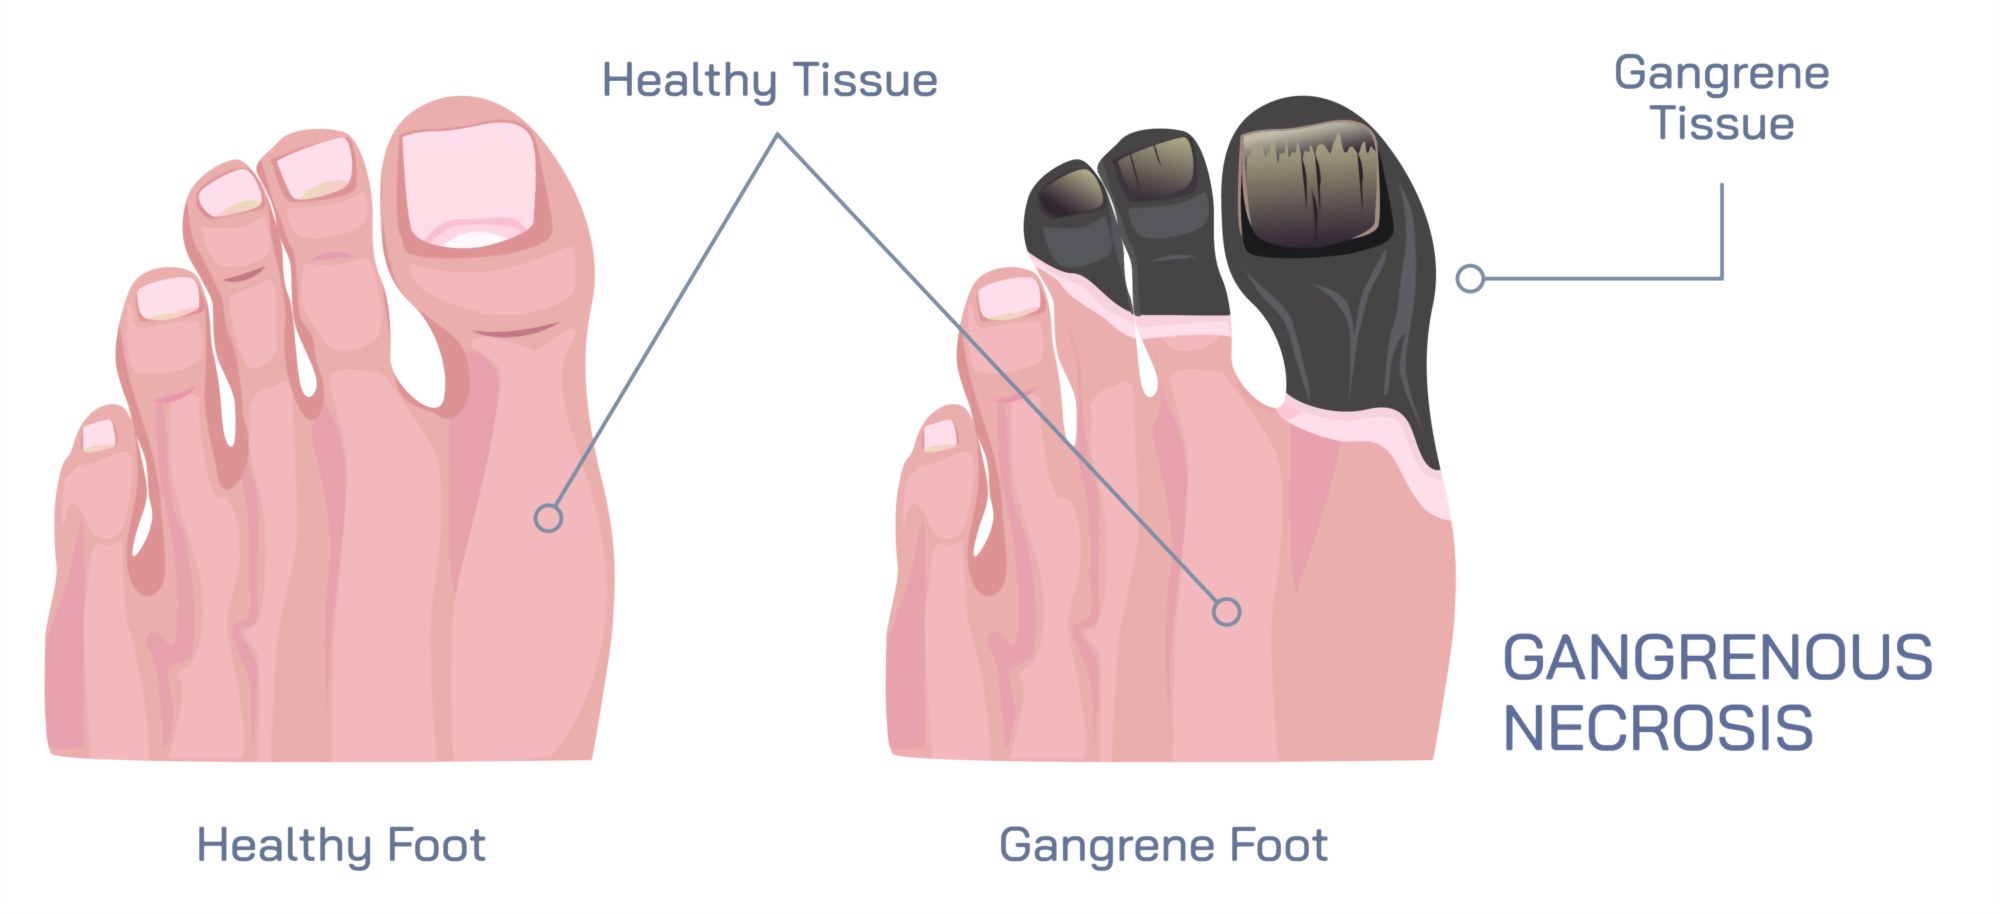
Dry gangrene is most often associated with chronic lack of blood supply, such as in severe peripheral artery disease, diabetes, frostbite, or vascular injury. Illustrations of dry gangrene show affected tissue shriveled, dark brown to black, and leathery. The boundary between dead tissue and healthy skin is usually clear and well-demarcated. A key visual feature is mummification—the drying and shrinking of tissue due to the absence of infection and evaporation of moisture. Diagrams often highlight narrowed or blocked arteries leading into the affected region, demonstrating how ischemia (restricted blood flow) is the driving factor. Although dry gangrene is not initially infected, it is extremely vulnerable to secondary infection if left untreated.
Wet gangrene, in contrast, is characterized by necrosis complicated by bacterial infection. Illustrations show tissue swollen, blistered, slimy, or foul-smelling, with colors ranging from purple and green to black. Unlike the clear border seen in dry gangrene, wet gangrene spreads irregularly and rapidly into surrounding tissues. In visual representations, fluid accumulation, pus formation, and tissue liquefaction are emphasized to show how bacteria and inflammatory enzymes break tissue down. Blood vessels may appear plugged or swollen in diagrams, and arrows often indicate the swift downward spiral caused by infection-induced inflammation impairing circulation even further. Because wet gangrene can become systemic, illustrations frequently include a progression arrow to sepsis, signaling a life-threatening risk.
Gas gangrene, caused by infection with anaerobic Clostridium species—commonly Clostridium perfringens—is the most dramatic form, and illustrations highlight its distinctive formation of gas bubbles within tissue. These bacteria release powerful toxins and enzymes that destroy muscle and connective tissue while fermenting tissue sugars to produce gas. In diagrams, gas appears as radiolucent pockets in cross-sectional views or as subcutaneous bubbles beneath the skin. A crepitating or crackling effect is often represented visually by sound-wave icons or arrows to indicate the characteristic sensation under palpation. Gas gangrene spreads rapidly, and illustrations frequently show shock, systemic toxemia, and organ failure as possible outcomes without emergency surgery.
Supporting diagrams also highlight predisposing medical conditions. Diabetes, peripheral vascular disease, atherosclerosis, severe trauma, burns, frostbite, and immunosuppression are common risk factors often shown with linking lines to gangrene images. Diabetic foot illustrations emphasize nerve damage, decreased sensation, poor circulation, and delayed wound healing—an interplay that makes unnoticed injuries highly vulnerable to tissue death and infection.
A deeper look inside visual representations showcases how infection spreads in wet and gas gangrene. Bacterial invasion is depicted at wound edges, where microbes infiltrate necrotic tissue that lacks immune defenses. Arrows may illustrate the widening spiral: infection accelerates necrosis, necrosis further reduces blood supply, and reduced blood supply allows more bacterial expansion. In contrast, dry gangrene visuals highlight the absence of bacteria initially and portray ischemia as the predominant cause, though they often add dotted caution signs to indicate high risk of conversion to wet gangrene if microbes enter.
Illustrations of treatment principles help contextualize the urgency of medical care. For dry gangrene, treatment diagrams emphasize restoring circulation, including angioplasty, bypass surgery, anticoagulants, and wound care. Wet and gas gangrene treatment visuals feature surgical intervention, wound debridement, aggressive antibiotics, hyperbaric oxygen therapy (for gas gangrene), and—in severe cases—amputation to halt the spread of infection. These treatment illustrations demonstrate that while dry gangrene progresses slowly, wet and gas gangrene require immediate action to save life and limb.
Some educational diagrams connect gangrene to imaging used for diagnosis. Gas gangrene is highlighted particularly well on X-ray or CT images, where soft-tissue gas appears as black pockets. Doppler ultrasound diagrams show reduced or absent circulation in dry gangrene. Blood test visuals focus on elevated inflammatory markers and bacterial cultures in wet gangrene.
Ultimately, an illustration of gangrenous necrosis and gangrene serves as a layered explanation of how tissues die when oxygen and blood supply are compromised—and how bacterial infection can transform slow ischemic decay into a rapidly life-threatening emergency. It shows the progression from vascular obstruction to cellular destruction, from structural breakdown to visible discoloration and fluid changes, and finally to infection-driven spread and systemic toxicity. By visualizing the differences and connections between dry, wet, and gas gangrene, the illustration not only clarifies pathology but also highlights the urgency of prevention, early detection, and treatment—underscoring why gangrene remains one of the most critical emergencies in surgery, wound care, and vascular medicine.