Action Potential Process Explained: Depolarization, Repolarization, and Nerve Signal Transmission Summary
The action potential is a fundamental physiological process that enables nerve signal transmission, allowing neurons to communicate rapidly across long distances. This electrochemical phenomenon underlies virtually all nervous system functions, from reflex arcs and sensory perception to complex cognition and voluntary movement. Understanding the action potential requires knowledge of neuronal membrane structure, ion gradients, and voltage-gated ion channels, as well as the sequential changes in membrane potential that propagate electrical signals. A vector illustration or conceptual summary of the action potential typically integrates phases of depolarization, repolarization, hyperpolarization, and refractory periods, providing a visually clear and educational explanation of how neurons transmit information. By combining labeled ion movements, membrane potential changes, and directional arrows, such illustrations allow learners to understand both the mechanism and functional significance of nerve impulses.
At the center of the concept is a neuronal axon segment, represented with a focus on the axon membrane (sarcolemma in neurons). The membrane separates the intracellular cytoplasm from the extracellular fluid, maintaining a resting membrane potential of approximately -70 millivolts. Labels indicate that the resting potential is established by the sodium-potassium (Na⁺/K⁺) pump, which actively transports three sodium ions out and two potassium ions in, creating an electrochemical gradient. Arrows may depict ion flow at rest, reinforcing the basis for polarization and potential energy stored across the membrane.
Depolarization is illustrated as the initial phase of the action potential. When a stimulus exceeds the threshold potential (around -55 mV), voltage-gated sodium channels open, allowing rapid Na⁺ influx. Arrows indicate sodium ions entering the neuron, causing the membrane potential to rise toward a positive value, often reaching approximately +30 mV. Labels highlight that this shift represents electrical excitation, transforming a resting, polarized state into a depolarized, active state. Color gradients or shading along the membrane can illustrate localized depolarization spreading along the axon, providing a visual representation of signal propagation.
Following depolarization, repolarization occurs. Labels indicate the closure of sodium channels and opening of voltage-gated potassium (K⁺) channels, permitting K⁺ efflux from the cell. Arrows illustrate potassium ions leaving the neuron, restoring the membrane potential back toward the resting level. Color coding can show the transition from depolarized (positive) to repolarized (negative) states along the membrane, helping learners visualize the sequential nature of electrical recovery. Insets may show channel gating mechanisms, emphasizing that selective ion permeability is critical for controlled voltage changes.
Hyperpolarization, or the afterpotential, is depicted as a brief phase in which K⁺ continues to exit the neuron slightly beyond the resting potential. Labels explain that this temporary increase in negativity contributes to the refractory period, during which the neuron is less excitable and less likely to fire another action potential immediately. Arrows indicate ion movement and highlight the importance of this phase in ensuring unidirectional signal propagation along the axon. Color-coded gradients can distinguish hyperpolarized segments from fully repolarized areas, clarifying functional implications.
The refractory periods—absolute and relative—are illustrated in parallel. Labels indicate that during the absolute refractory period, voltage-gated sodium channels are inactivated, preventing any new action potential regardless of stimulus intensity. During the relative refractory period, a stronger-than-normal stimulus can initiate a new action potential. Arrows along the axon may depict successive signal propagation and demonstrate how refractory timing maintains directionality and signal fidelity.
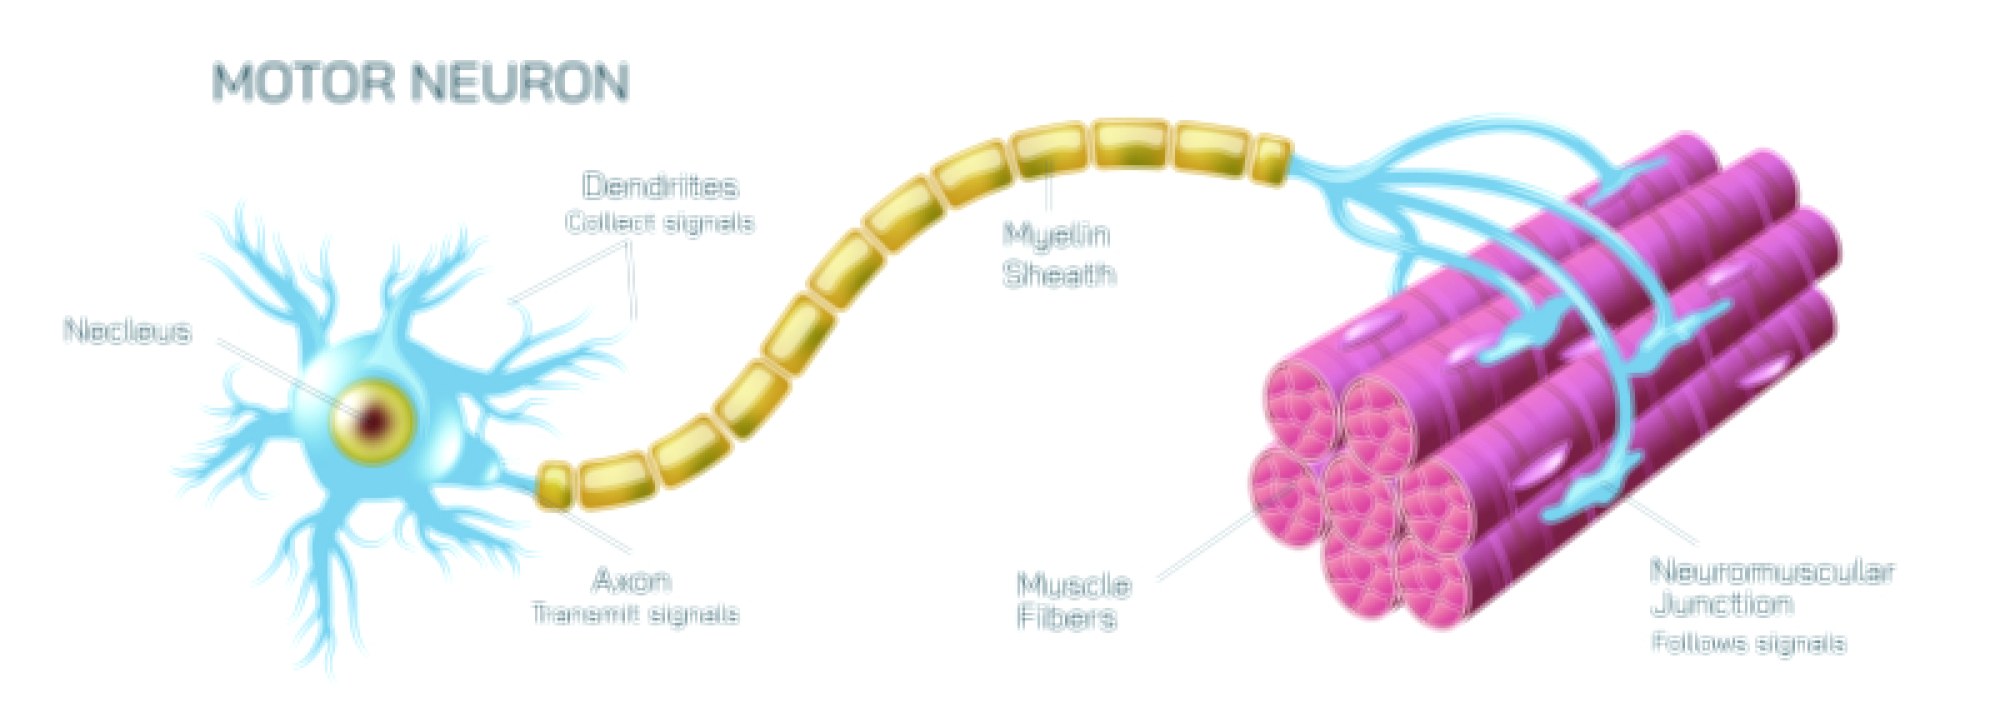
Vector diagrams may also include signal transmission along the axon, illustrating how local depolarization triggers adjacent voltage-gated channels, allowing the action potential to propagate in a wave-like manner toward the axon terminal. Labels indicate saltatory conduction in myelinated axons, where the action potential jumps between nodes of Ranvier, significantly increasing conduction velocity. Arrows indicate the sequential opening of channels and directional flow of the impulse. Insets may magnify nodes and internodal regions, highlighting myelin’s role as an electrical insulator.
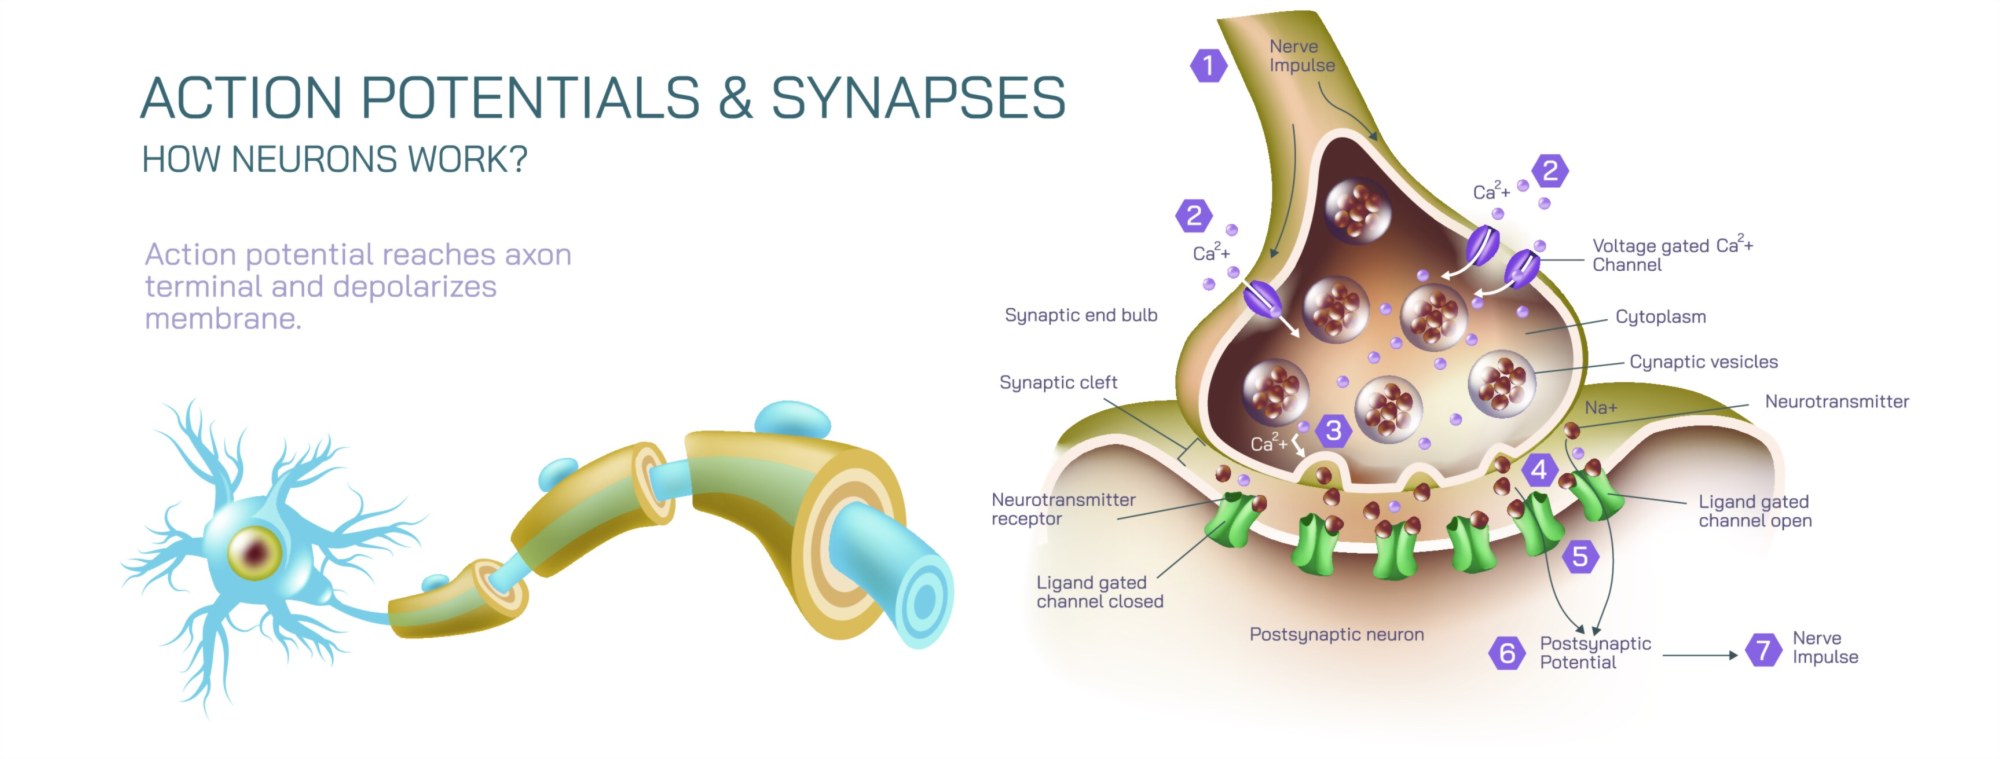
Additional educational features may include neurotransmitter release at synaptic terminals, connecting the propagated action potential to chemical signaling across synapses. Arrows depict calcium influx, vesicle fusion, and neurotransmitter exocytosis, demonstrating how electrical impulses are translated into communication with target cells. Labels may indicate excitatory or inhibitory outcomes, linking action potentials to functional nervous system responses.
By combining resting potential, depolarization, repolarization, hyperpolarization, refractory periods, and directional impulse propagation, a vector illustration or summary of the action potential provides a detailed, visually intuitive understanding of neuronal signaling. Color gradients, labeled ion movements, directional arrows, and magnified insets allow learners to link cellular mechanisms to functional outcomes in a clear, stepwise manner.
Ultimately, the action potential vector illustration or conceptual summary demonstrates the mechanistic basis of nerve signal transmission, highlighting how ion dynamics, voltage-gated channel activity, and sequential membrane potential changes enable rapid communication within the nervous system. Through labeled ion channels, membrane regions, voltage changes, and impulse pathways, the diagram transforms an abstract electrochemical process into an educational, visually engaging, and intuitive tool for neuroscience, physiology, and medical learning.