Photosynthesis Process Explained: Conversion of Light Energy into Chemical Energy in Plants
Photosynthesis is the fundamental biochemical process by which green plants, algae, and certain bacteria convert light energy into chemical energy, sustaining nearly all life on Earth by forming the base of the food chain. It occurs primarily in the chloroplasts of plant cells and involves the transformation of carbon dioxide and water into glucose and oxygen through a series of light-dependent and light-independent reactions. Understanding photosynthesis requires knowledge of chlorophyll, light absorption, electron transport, ATP and NADPH synthesis, and carbon fixation, all of which can be effectively visualized through a detailed vector illustration. By combining labeled chloroplast structures, directional arrows, and reaction flows, such illustrations allow learners to grasp both the mechanisms and the significance of this essential biological process.
At the center of the illustration is a chloroplast, depicted with its key internal structures: outer membrane, inner membrane, stroma, thylakoid membranes, and grana stacks. Labels identify the site of light-dependent reactions in the thylakoid membranes and the site of light-independent (Calvin cycle) reactions in the stroma. Color gradients or shading distinguish the membrane systems, lumen spaces, and surrounding stroma, clarifying the spatial organization of the organelle. Arrows illustrate the flow of energy and molecules through the chloroplast, linking structure to function.
Light-dependent reactions are depicted on the thylakoid membranes. Labels indicate photosystem II (PSII), photosystem I (PSI), the electron transport chain (ETC), and ATP synthase complexes. Arrows show the absorption of photons by chlorophyll pigments, excitation of electrons, and the movement of electrons through the ETC. Labels highlight the splitting of water (photolysis) in PSII, releasing oxygen (O₂) as a byproduct. Color-coded arrows indicate the transfer of protons (H⁺) into the thylakoid lumen, creating a proton gradient that drives ATP synthesis. Magnified insets may illustrate photon energy absorption and electron excitation, helping learners visualize how light energy is converted into chemical energy carriers, ATP and NADPH.
The production of chemical energy carriers is illustrated with arrows linking the electron transport process to the formation of ATP (via photophosphorylation) and NADPH. Labels indicate that these molecules are essential for powering the Calvin cycle, and color coding distinguishes ATP (energy currency) from NADPH (reducing power), emphasizing their complementary roles in carbon fixation. Directional arrows reinforce the movement of energy and electrons from the thylakoid membrane to the stroma.
Light-independent reactions (Calvin cycle) are depicted in the chloroplast stroma. Labels highlight the three main phases: carbon fixation, reduction, and regeneration of ribulose-1,5-bisphosphate (RuBP). Arrows indicate the sequential incorporation of CO₂ molecules into 3-phosphoglycerate, reduction to glyceraldehyde-3-phosphate (G3P) using ATP and NADPH, and the regeneration of RuBP for continuous cycling. Insets may show enzyme-mediated steps, such as the role of ribulose-1,5-bisphosphate carboxylase/oxygenase (RuBisCO), emphasizing the molecular mechanisms that convert inorganic carbon into sugar. Color coding differentiates input molecules (CO₂, ATP, NADPH) from outputs (G3P, ADP, NADP⁺), visually clarifying the flow of materials and energy.
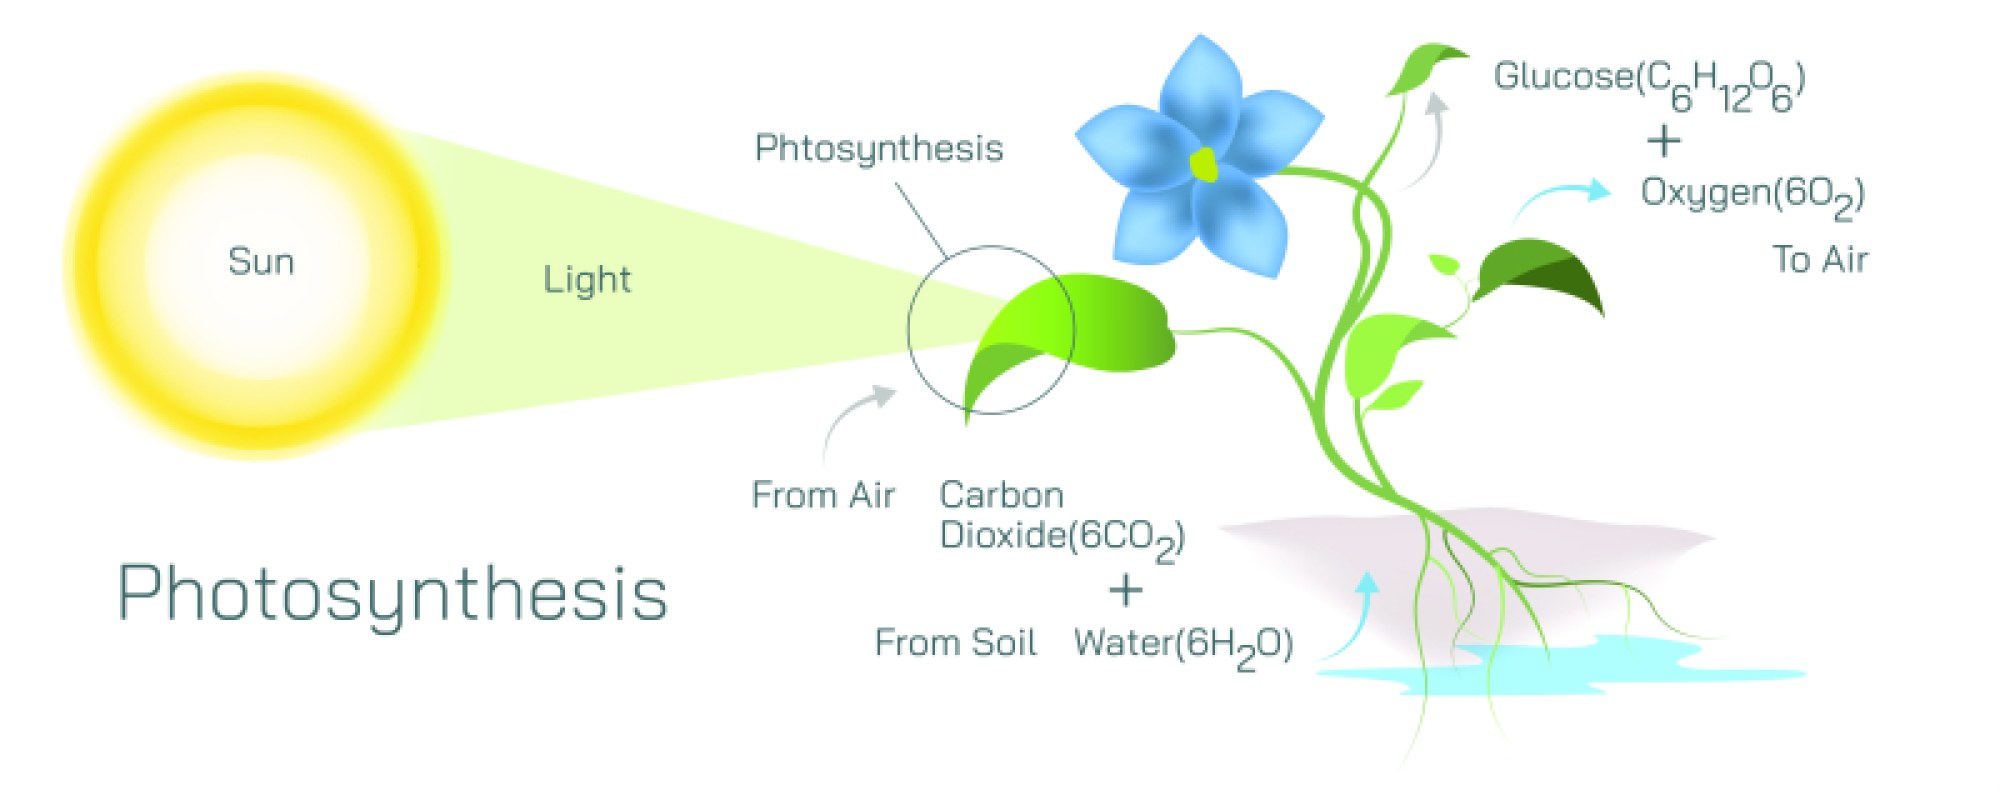
The illustration often includes external inputs and outputs of photosynthesis. Arrows indicate sunlight striking the leaf, CO₂ uptake through stomata, and H₂O absorption by roots, entering the chloroplast for processing. The outputs, glucose (C₆H₁₂O₆) and O₂, are shown leaving the chloroplast and the leaf, highlighting their importance for plant metabolism and ecosystem oxygen supply. Color-coded paths visually trace these movements, connecting molecular reactions to macroscopic ecological relevance.
Vector diagrams may also incorporate energy flow diagrams, showing how light energy is captured, stored as chemical energy in ATP and NADPH, and then transferred to glucose. Arrows may illustrate conversion efficiency and energy transformations, helping learners understand the thermodynamic principles underlying photosynthesis. Optional panels may include comparisons of C3, C4, and CAM pathways, highlighting adaptations to different environmental conditions.
By combining chloroplast structure, light-dependent reactions, Calvin cycle, molecular carriers, and input-output pathways, a vector illustration of photosynthesis provides a comprehensive and visually intuitive understanding of the process. Color coding, directional arrows, labeled molecules, and magnified insets allow learners to connect organelle anatomy to chemical reactions and energy transformation, linking microscopic molecular events to macroscopic plant function.
Ultimately, a photosynthesis vector illustration demonstrates the conversion of light energy into chemical energy, the interrelation of molecular and organelle structures, and the global significance of oxygen and carbohydrate production. Through labeled chloroplasts, reaction flows, energy carriers, and input-output paths, the diagram transforms complex biochemical processes into an educational, visually engaging, and intuitive tool for students, educators, and biology enthusiasts.