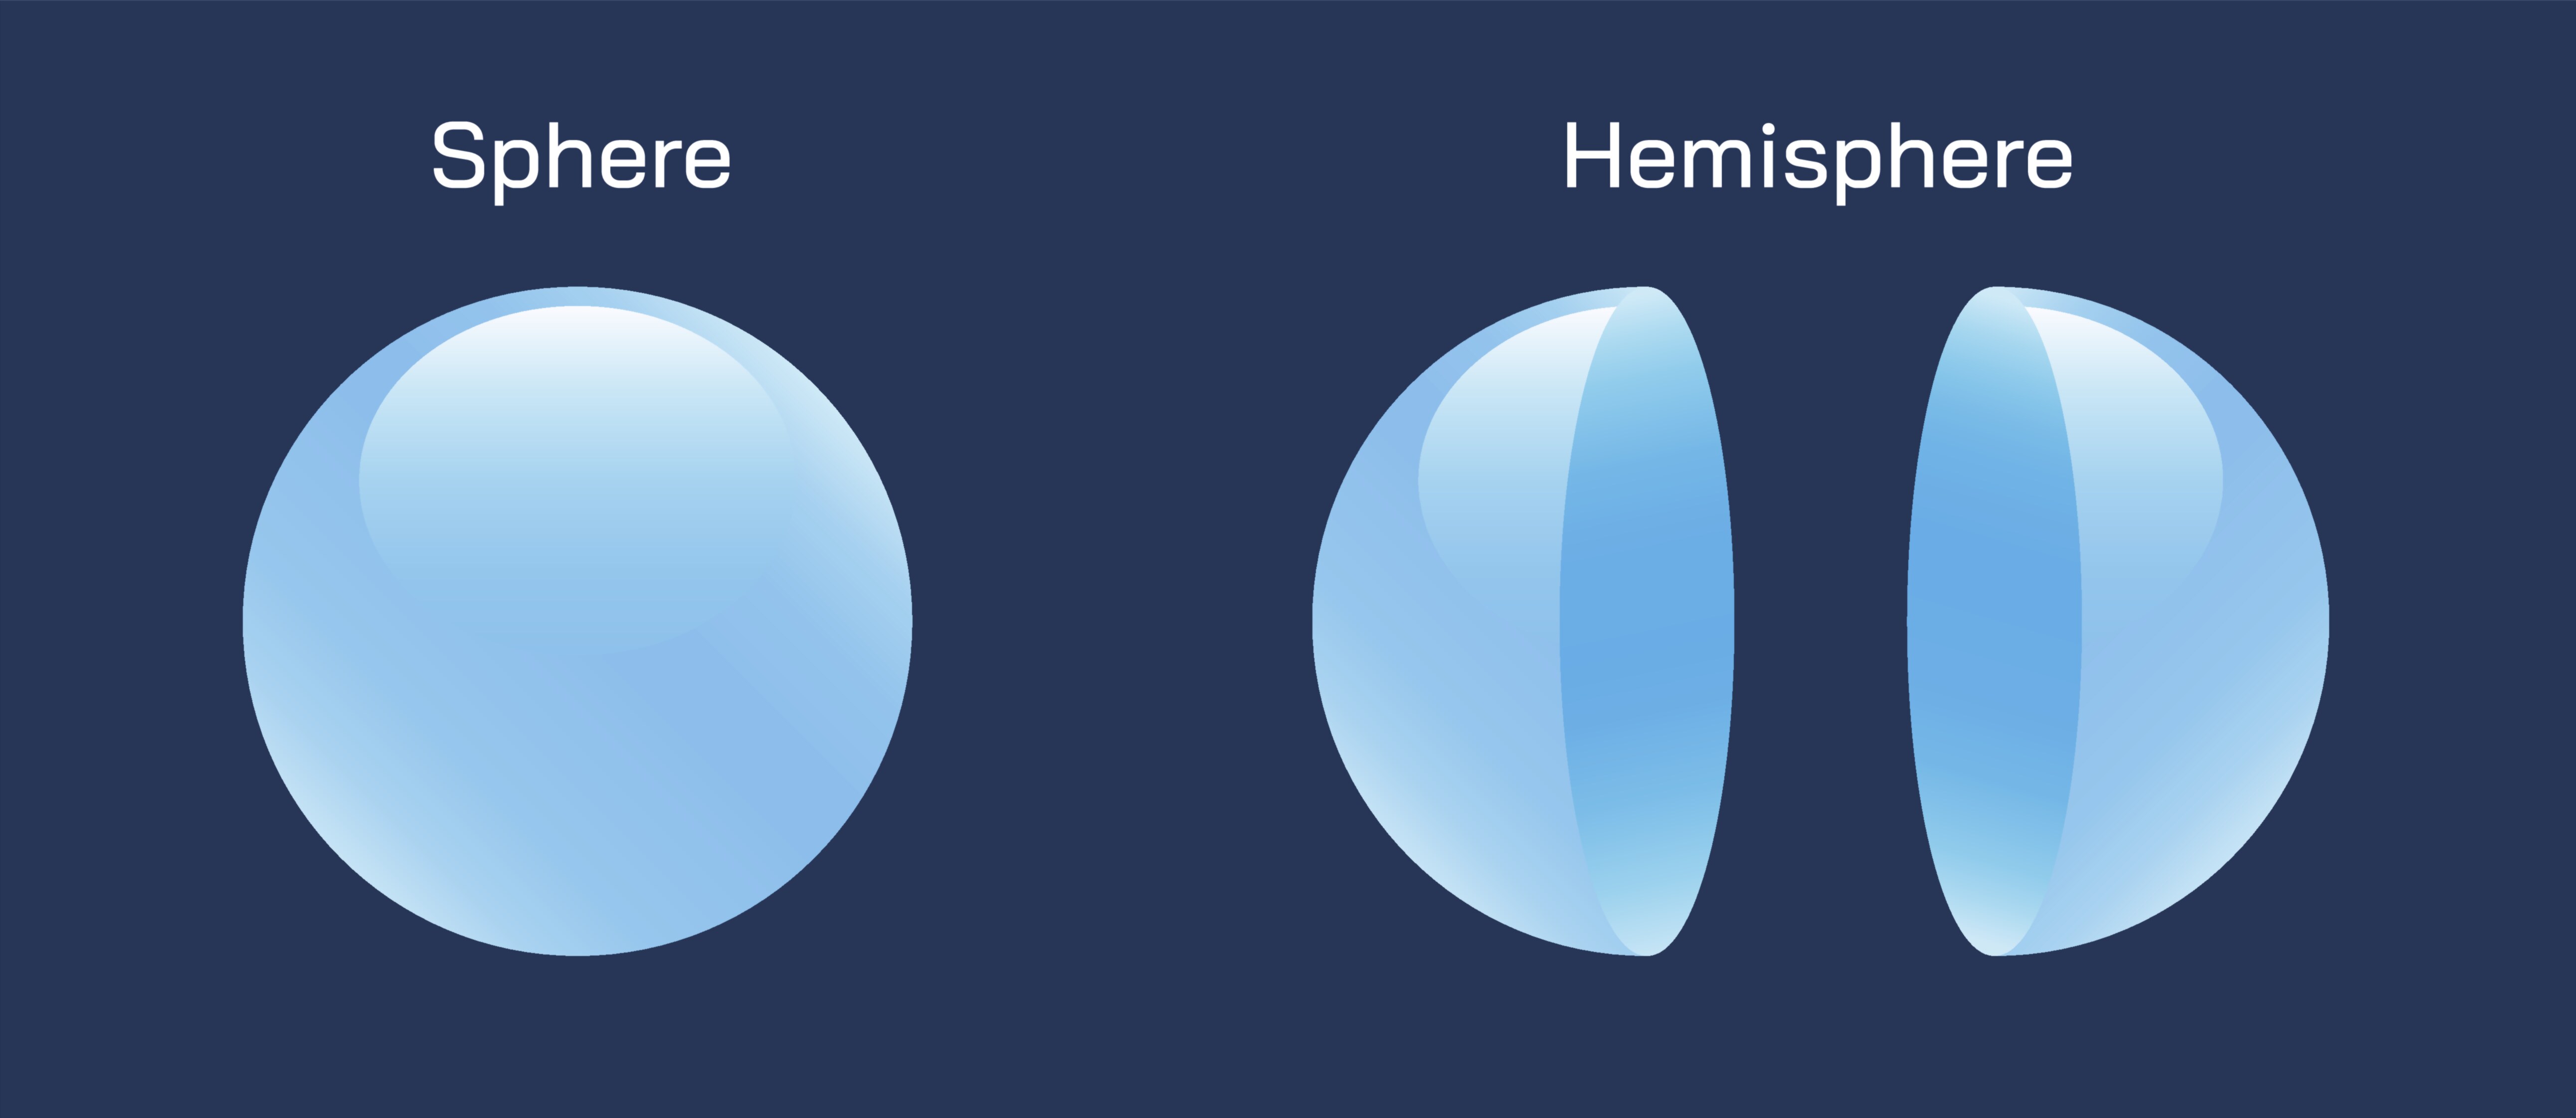
Sphere and Hemisphere Vector Illustration Showing 3D Geometric Shapes with Cross Section and Volume Concept
The sphere and hemisphere are fundamental three-dimensional geometric shapes that frequently appear in mathematics, physics, engineering, and computer graphics. Understanding their properties, including surface area, volume, and cross-sectional views, is essential for solving spatial problems, designing structures, and visualizing 3D objects. A vector illustration of a sphere and hemisphere typically combines a 3D perspective, cross-sectional diagrams, and labeled dimensions, providing a comprehensive visual framework for understanding their geometry. By integrating shape, volume, and sectional concepts, the diagram helps learners grasp both the abstract mathematical properties and practical applications of these forms.
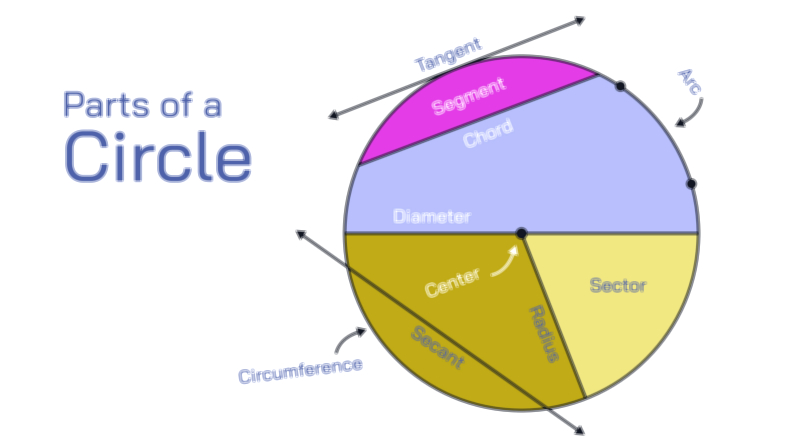
At the core of the illustration is the sphere, a perfectly round 3D shape in which every point on the surface is equidistant from the center. In vector diagrams, the sphere is often represented in perspective with shading to convey depth and curvature. Labels typically include the radius (r), diameter (d), and center point, helping viewers identify key geometric elements. The vector illustration may also include cross-sectional views, showing a plane slicing through the center of the sphere to create a circle, demonstrating the relationship between the 3D object and its 2D representation. Arrows or dashed lines often indicate the slicing plane and highlight the circular cross section, reinforcing the concept that a sphere consists of an infinite set of concentric circles stacked around the center.
The hemisphere is half of a sphere, divided by a plane passing through the sphere’s center. In vector illustrations, the hemisphere is usually depicted with the flat circular base facing downward and the curved surface extending upward. Labels indicate the radius, flat base, and curved surface area, while shading or color gradients convey the 3D form. The diagram may include a cross-sectional view of the hemisphere, showing the curved profile above the flat circular base. Arrows or dashed lines highlight the dividing plane, helping viewers understand that a hemisphere is essentially a sphere cut along its diameter. This perspective allows learners to visualize how volume and surface area are distributed between the flat base and curved surface.
Vector illustrations frequently depict volume relationships for both the sphere and hemisphere. For a sphere, the volume is represented conceptually by showing how the space inside the sphere is occupied, often with transparent or semi-transparent shading to allow viewers to see the entire interior. The volume of a hemisphere is shown as exactly half of the corresponding sphere’s volume, with the cross-sectional diagram reinforcing this proportion. Arrows or labels may indicate the mathematical relationships between radius, surface area, and volume, helping learners connect visual representation with quantitative understanding. Although formulas are not included in the illustration itself, highlighting radius-based dimensions implicitly demonstrates how volume scales with the cube of the radius, offering a visual comprehension of size and capacity.
The cross-sectional views in vector diagrams are crucial for bridging the 3D shape with 2D geometric reasoning. For the sphere, the cross section is a perfect circle through the center, while for the hemisphere, cross sections parallel to the flat base produce smaller circles of varying radius, demonstrating the concept of slicing planes. Shading gradients can indicate depth, and concentric circles may be drawn to visualize layers within the 3D object, making abstract spatial concepts tangible. This approach also helps learners understand real-world applications such as spherical tanks, domes, or hemispherical bowls, where cross-sectional reasoning is critical for design and measurement.
Vector illustrations may also include dimensional labeling, showing the height of the hemisphere from the base to the apex and the radius of the base circle. Arrows can indicate how the diameter of the base relates to the sphere’s radius, reinforcing proportional understanding. By combining labels for radius, center, apex, base, and curved surface, the diagram provides a complete framework for understanding spatial geometry. Color gradients or shading can further enhance the visual depth, emphasizing the curved nature of the surfaces.
Additional elements in the vector illustration may depict comparisons between sphere and hemisphere, highlighting how the hemisphere retains the spherical curvature but only occupies half the volume. Labels or side-by-side diagrams can show that while the curved surface area of a hemisphere is half of the sphere plus the area of the flat base, the visual representation clarifies how the two shapes are related. This comparative approach helps learners appreciate geometric relationships and prepares them for practical applications in engineering, physics, and architecture.
Vector illustrations often integrate perspective and isometric views, showing the sphere and hemisphere from multiple angles to reinforce three-dimensional comprehension. Transparent overlays, dashed lines, and cross-sectional highlights provide depth cues, helping viewers understand interior and exterior relationships. Arrows may indicate measurement directions, such as from the center to the surface, illustrating radius orientation in a visually intuitive way.
By combining 3D perspective, cross-sectional views, labeled dimensions, and volumetric representation, a vector illustration of the sphere and hemisphere conveys a complete understanding of these essential geometric shapes. The diagram clarifies relationships between radius, diameter, surface area, and volume while demonstrating how slicing planes create circular cross sections. It bridges abstract geometry and practical visualization, allowing learners to conceptualize both the forms themselves and their applications in real-world contexts.
Ultimately, a vector illustration of the sphere and hemisphere demonstrates the elegant symmetry, spatial relationships, and volumetric properties of these shapes. By integrating depth, shading, labels, and cross sections, the diagram provides an educational framework for visualizing three-dimensional geometry, enabling learners to understand, analyze, and apply the concepts of spheres and hemispheres across mathematics, engineering, and scientific disciplines.