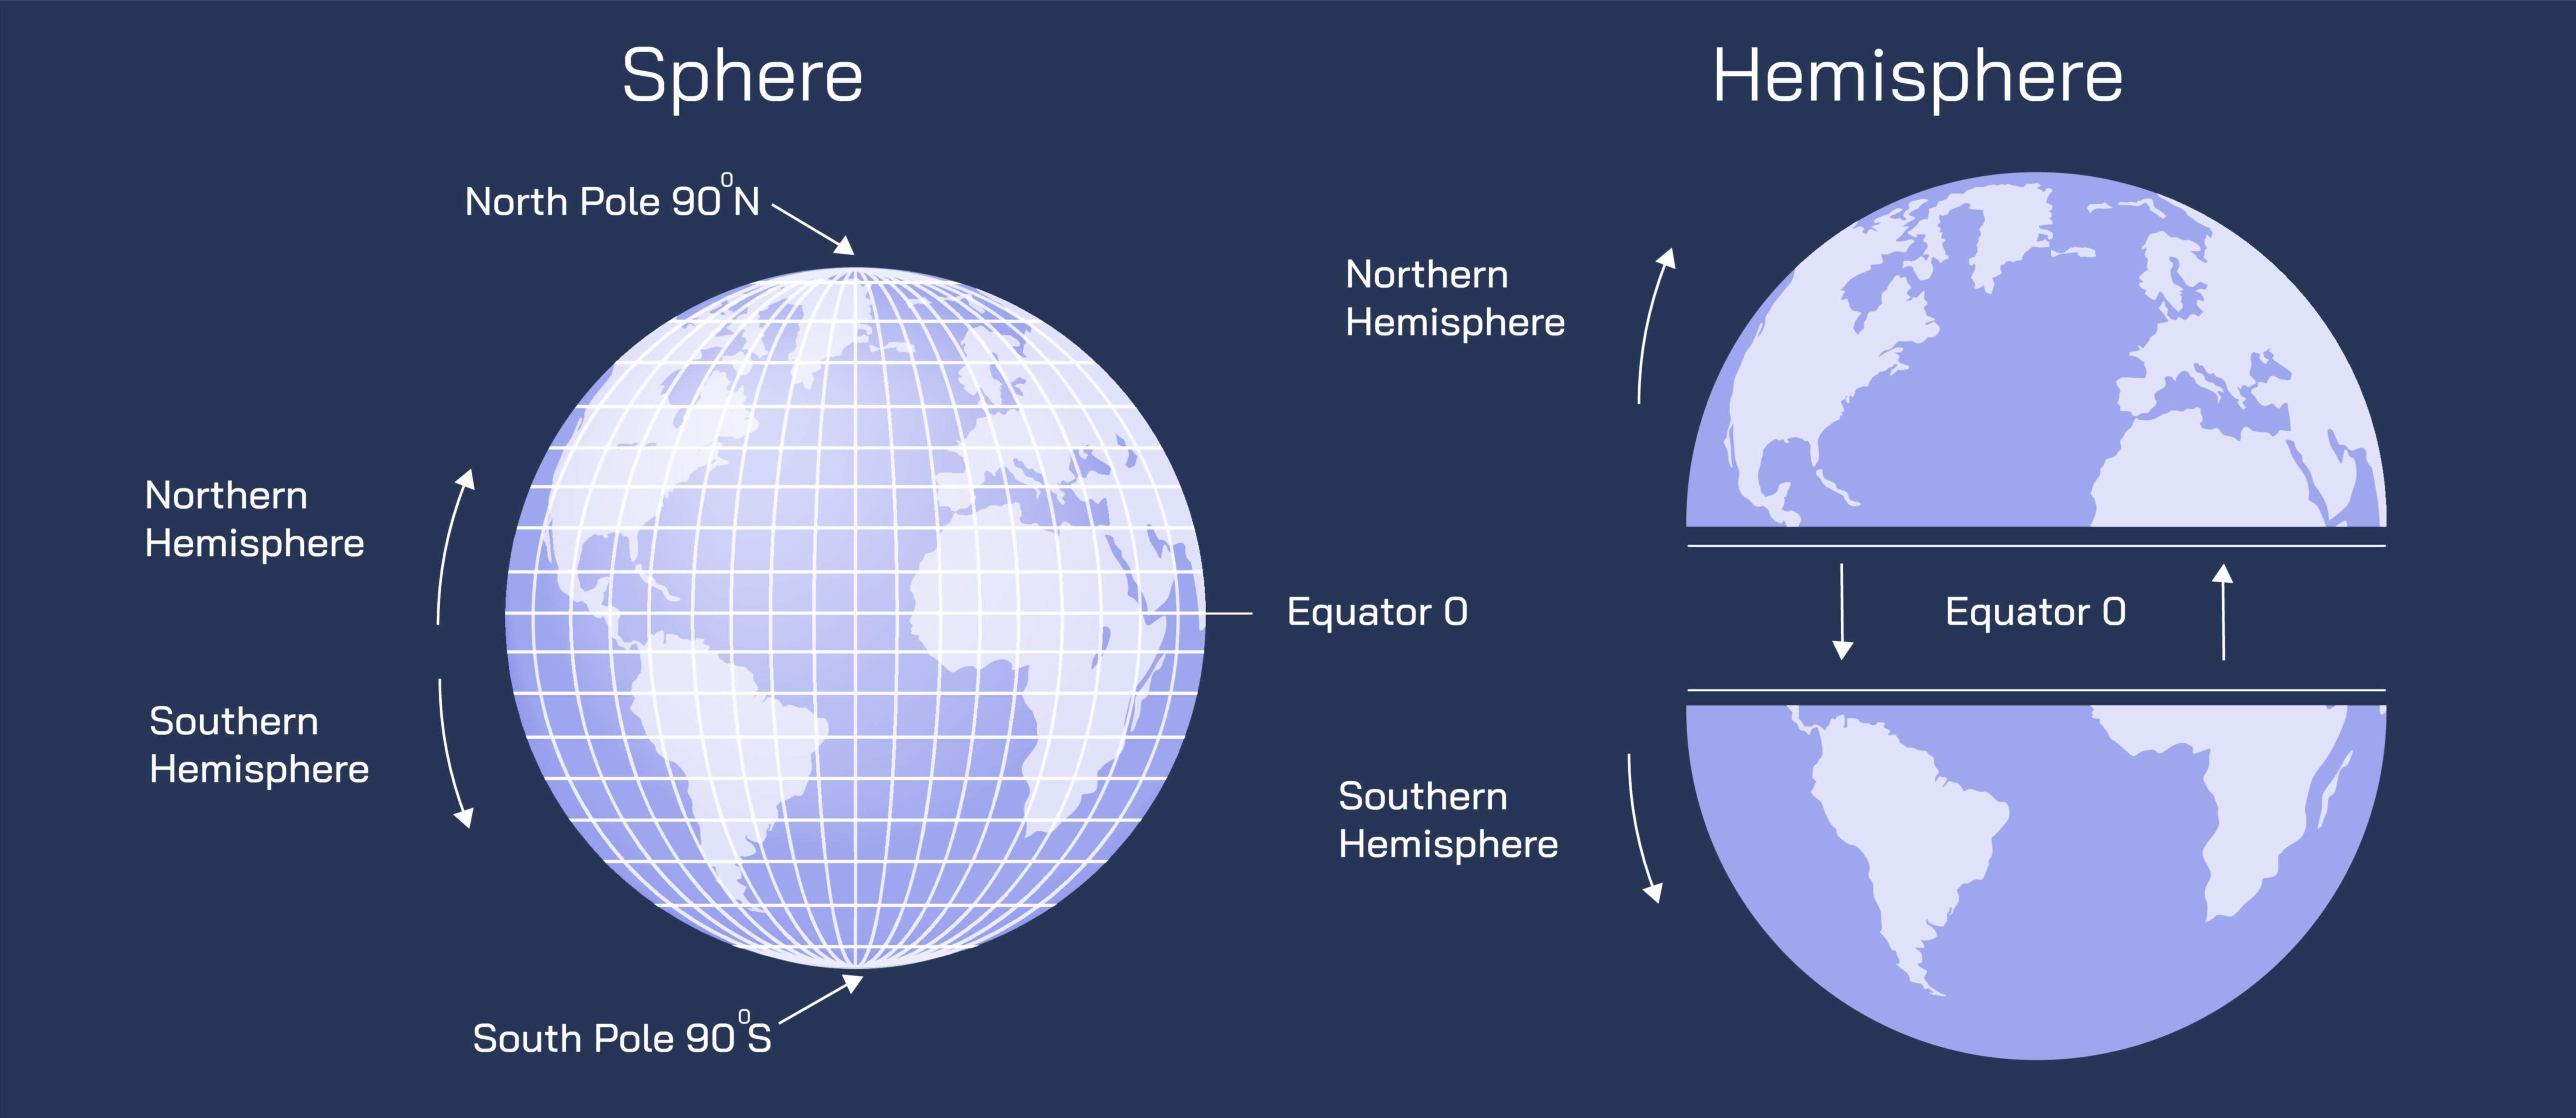
Sphere and Hemisphere Vector Illustration Showing 3D Shapes, Dimensions, and Geometric Properties for Mathematics Learning
Spheres and hemispheres are fundamental three-dimensional (3D) geometric shapes extensively studied in mathematics, physics, engineering, and design. A sphere is defined as the set of all points in space equidistant from a fixed center, forming a perfectly round 3D object, while a hemisphere represents half of a sphere, often divided along a plane passing through the center. A vector illustration of spheres and hemispheres typically integrates 3D rendering, labeled dimensions, cross-sectional views, and geometric properties, providing a clear visual understanding of these shapes for learners. By combining perspective views, color-coded surfaces, and annotations, such illustrations make abstract spatial concepts accessible, intuitive, and educational.
At the center of the illustration is the full sphere, depicted in perspective to showcase its three-dimensionality. The sphere is often rendered with shading or gradient colors to convey depth and curvature, and arrows indicate the radius (r) extending from the center point to the surface. Labels identify the center (O) and the diameter (2r), visually connecting linear dimensions with the overall structure. Optional dashed lines may indicate great circles or cross-sections, illustrating the symmetry of the sphere and providing context for surface area and volume discussions.
Adjacent to the full sphere is the hemisphere, oriented to display both its curved surface and the flat circular base. The curved surface is typically shaded to emphasize the 3D nature, while the base is outlined to illustrate the planar circle. Labels highlight key dimensions, including radius (r), height (h = r), curved surface area, and base area, providing learners with visual references for calculating geometric properties. Arrows may indicate axis orientation, helping to connect the hemisphere to the sphere from which it is derived.
Vector illustrations often include cross-sectional views for both shapes. For the sphere, a cut through the center reveals a circle with radius r, labeled to reinforce the relationship between 2D and 3D geometry. For the hemisphere, a vertical cross-section shows a semi-circle atop a flat plane, clarifying how the hemisphere represents half the volume of the sphere and how its curved and flat surfaces combine. Color gradients or hatching may be used to distinguish the curved surface from the base.
Geometric properties are emphasized through labeled annotations. For the sphere, surface area (4πr²) and volume (4/3πr³) can be indicated through arrows pointing to the curved surface and interior, visually linking formulas with structural features. For the hemisphere, curved surface area (2πr²), base area (πr²), and volume (2/3πr³) are labeled in separate panels or insets, providing a comprehensive view of mathematical relationships. Arrows may indicate how the hemisphere’s properties relate proportionally to the full sphere, reinforcing comparative understanding.
The illustration may also include perspective and orthographic views. Perspective views highlight 3D depth and spatial orientation, while orthographic projections display exact dimensions and plan views. For example, a top view of the hemisphere may show a circle representing the base, while a side view emphasizes the curvature of the dome. Arrows and grid lines can indicate axes of symmetry, enhancing spatial comprehension.
To support mathematical learning, vector diagrams often incorporate proportional scaling and dimensional guides. Arrows can indicate the radius, diameter, and height, while numerical labels illustrate relative measurements. Magnified insets may highlight points of interest, such as the center, equator line of the sphere, or the intersection edge of the hemisphere, providing a clear geometric reference.
Additional features may include comparison panels showing a sphere alongside a hemisphere to illustrate relationships such as volume ratio (1:2) and surface area proportion, reinforcing conceptual understanding. Color coding distinguishes curved surfaces from flat planes, helping learners visualize differences between the complete 3D shape and its halved form.
By combining 3D rendering, radius and diameter labeling, cross-sectional views, surface shading, and geometric property annotations, a vector illustration of spheres and hemispheres provides a thorough, visually intuitive understanding of these fundamental shapes. Color-coded surfaces, perspective arrows, and labeled dimensions clarify abstract concepts, supporting learners in both visualization and mathematical computation.
Ultimately, a sphere and hemisphere vector illustration demonstrates the relationship between 3D shapes, their dimensions, and geometric properties, linking abstract mathematical formulas to visual representations. Through labeled axes, radii, diameters, surface areas, volumes, and cross-sectional views, the diagram transforms theoretical geometry into an educational, engaging, and intuitive tool for mathematics learning, spatial reasoning, and applied geometry.