Eye Colors and Color Blindness Vector Illustration Showing Normal Vision and Color Deficiency Types
The human eye exhibits a remarkable range of eye colors, determined primarily by the distribution and concentration of melanin in the iris, and this pigmentation has both aesthetic and functional significance. A vector illustration depicting eye colors and color blindness typically combines representations of common iris colors, the underlying melanin variation, and the different types of color vision deficiency. By showing both normal vision and color deficiency types in a single diagram, the illustration provides a comprehensive understanding of how visual perception is influenced by genetics, photoreceptor function, and light absorption, highlighting both physiological and neurological aspects of sight.
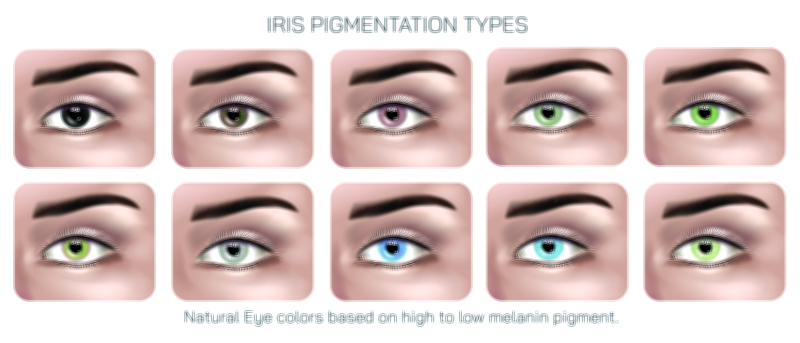
At the core of such an illustration is the depiction of normal eye colors, which range from brown, the most common globally, to blue, green, hazel, and variations in between. Brown eyes contain high concentrations of melanin in the iris stroma and epithelium, absorbing more light and providing greater protection against ultraviolet radiation. In vector illustrations, the iris is often represented as a circular ring with gradients and textures to mimic natural pigmentation. Lighter eye colors, such as blue and green, result from lower melanin levels and the Tyndall effect, where light scattering within the stroma determines perceived hue. Hazel eyes show a mixture of brown and green or amber tones, and the illustration may depict the radial variation in pigmentation across the iris to explain this heterogeneity.
Beyond color variation, the vector illustration typically introduces color vision and photoreceptors. Normal vision, or trichromacy, relies on three types of cone cells in the retina: S-cones sensitive to short wavelengths (blue), M-cones sensitive to medium wavelengths (green), and L-cones sensitive to long wavelengths (red). The diagram may include small insets showing these cones, labeled with their peak sensitivity ranges and corresponding colors. Arrows may indicate the path of light from the iris to the retina and the stimulation of specific cones, illustrating how the combination of cone responses enables humans to perceive a wide spectrum of colors.
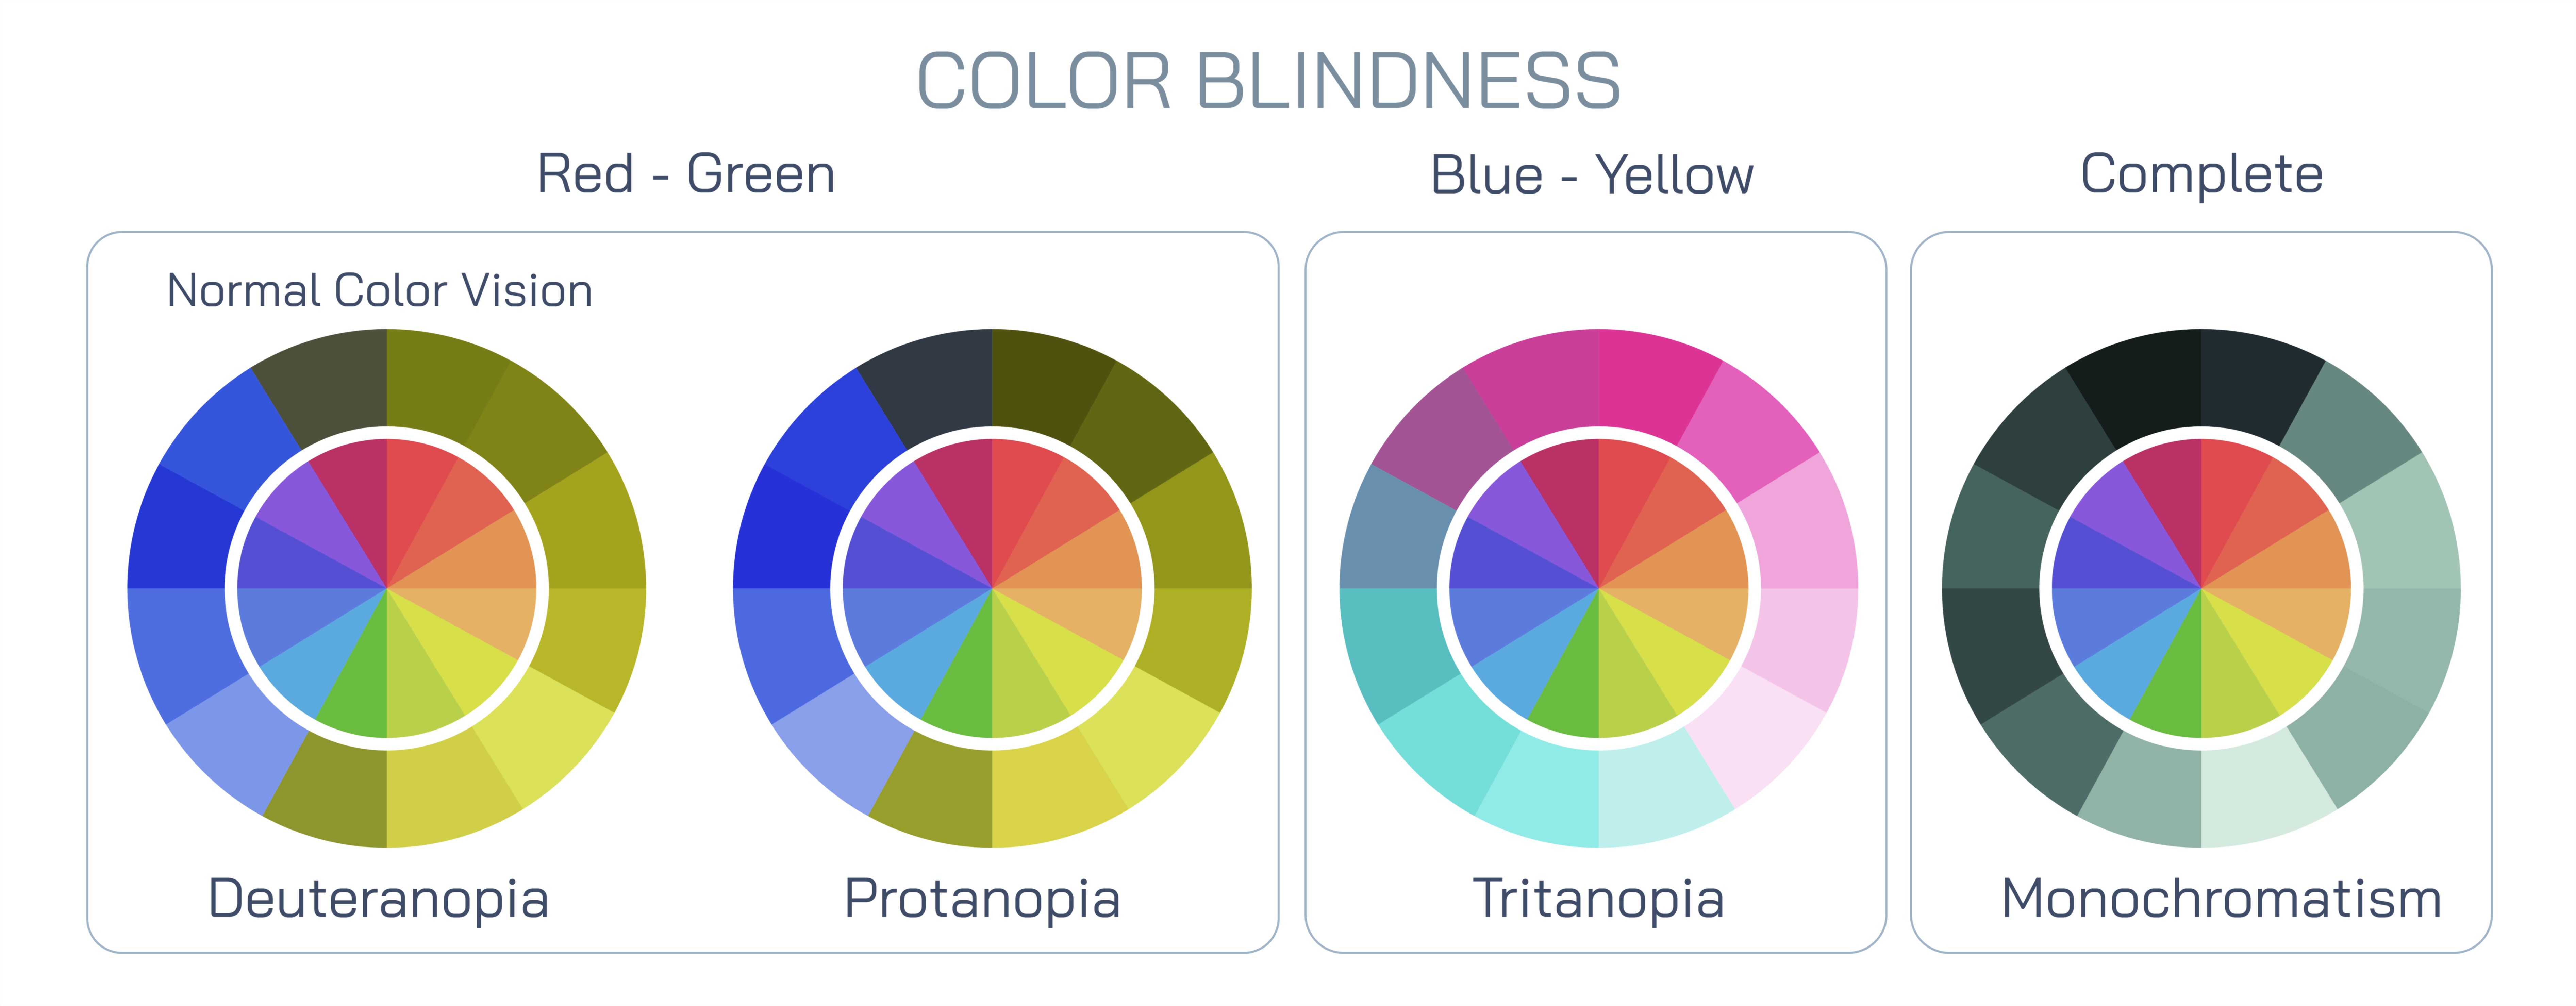
A critical component of the illustration is the depiction of color blindness, or color vision deficiency (CVD), which occurs when one or more types of cone cells are absent, non-functional, or altered in spectral sensitivity. The most common type is red-green color blindness, which can be further divided into protanopia (absence of L-cones) and deuteranopia (absence of M-cones). Vector diagrams often show examples of how normal color patterns, such as colored shapes or gradient bars, appear to individuals with these deficiencies, providing a direct visual comparison. For instance, reds may appear darker or indistinguishable from greens in protanopia, while deuteranopia affects green perception more prominently. The illustration may use side-by-side comparisons to make the differences intuitive.
Other types of color blindness include tritanopia, or blue-yellow deficiency, caused by the absence or malfunction of S-cones, although this condition is less common. In a vector illustration, tritanopia can be represented with colors shifted to show difficulty distinguishing between blues and yellows. More severe forms, such as achromatopsia, involve a complete absence of cone function, resulting in grayscale vision. The diagram may include examples of scenes or objects as perceived in grayscale to illustrate this condition. This visual comparison between normal vision and different types of CVD provides a clear, educational understanding of how cone function and spectral sensitivity influence color perception.
Vector illustrations often include genetic and population-based information to contextualize color blindness. Red-green color blindness is generally inherited in an X-linked recessive pattern, affecting a higher proportion of males than females. Diagrams may use simple genetic symbols or icons to show how the condition is transmitted through families. Additionally, the illustration may highlight global variations in eye color distribution, with higher frequencies of brown eyes in certain populations and blue or green eyes more common in others, connecting pigmentation with evolutionary and genetic factors.
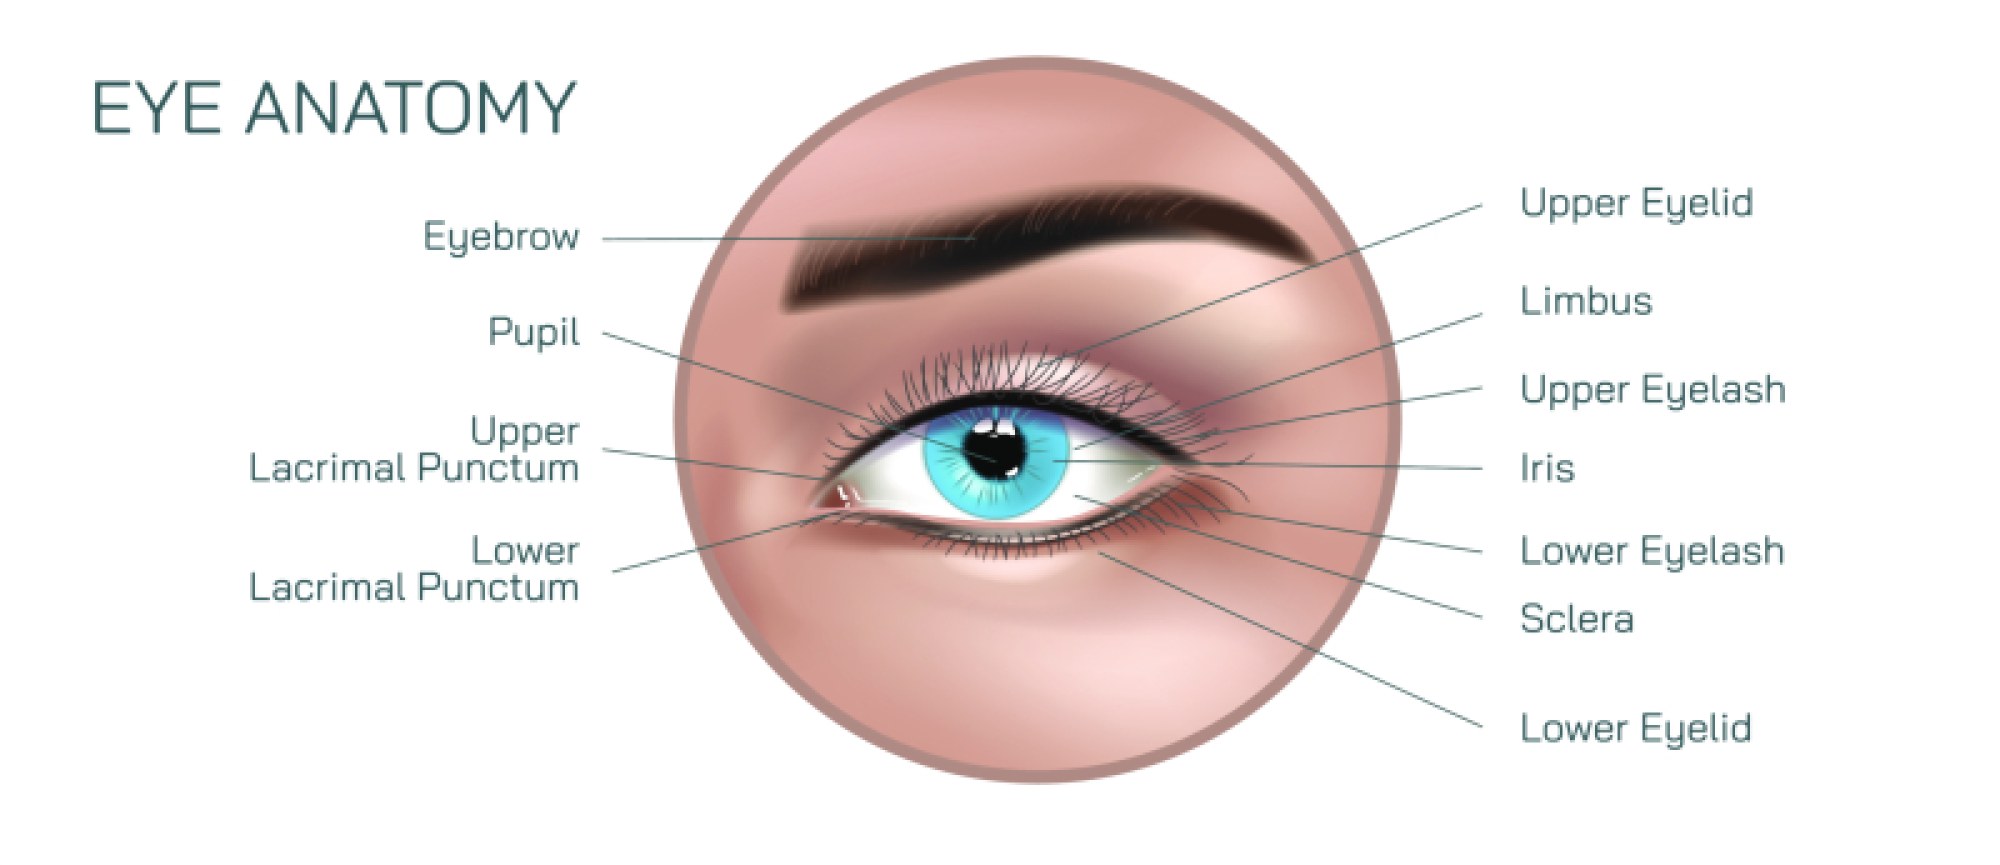
Another common feature of such illustrations is the representation of the iris structure and its relationship to eye color. The iris contains both a stroma, a fibrous layer affecting light scattering, and pigment epithelium, which absorbs light. Vector diagrams may depict a cross-sectional view of the iris, with labeled melanin concentrations and light scattering directions, to explain how variations in pigmentation create the full spectrum of observed eye colors. This adds an anatomical and physiological perspective to the visual representation, linking external color perception with internal tissue structure.
Educational vector illustrations may also include practical examples, such as simulated images of everyday objects, traffic lights, or educational charts as perceived by individuals with normal vision versus different types of color blindness. These examples help viewers understand the real-world implications of CVD, from distinguishing signals to selecting colors in design and safety applications. The use of side-by-side comparisons in the illustration enhances comprehension, making it easy to appreciate how variations in cone function affect color discrimination.
By combining iris pigmentation, retinal photoreceptor function, and color perception comparisons, a vector illustration of eye colors and color blindness provides a comprehensive view of human vision. It emphasizes the interplay between anatomical structure and visual experience, showing how genetic and physiological factors influence the colors we perceive. The illustration not only educates about eye anatomy and melanin distribution but also conveys the functional impact of color deficiencies, offering insight into both normal vision and color vision disorders.
Ultimately, a well-designed vector illustration communicates the diversity and complexity of human vision. It allows viewers to understand how the iris determines eye color, how photoreceptor cells convert light into color perception, and how deficiencies in these cells lead to altered or impaired color vision. By integrating anatomical, physiological, and perceptual elements into a single visual framework, the diagram serves as a valuable educational tool for students, healthcare professionals, and the general public, enhancing understanding of both the aesthetic and functional aspects of the human eye.