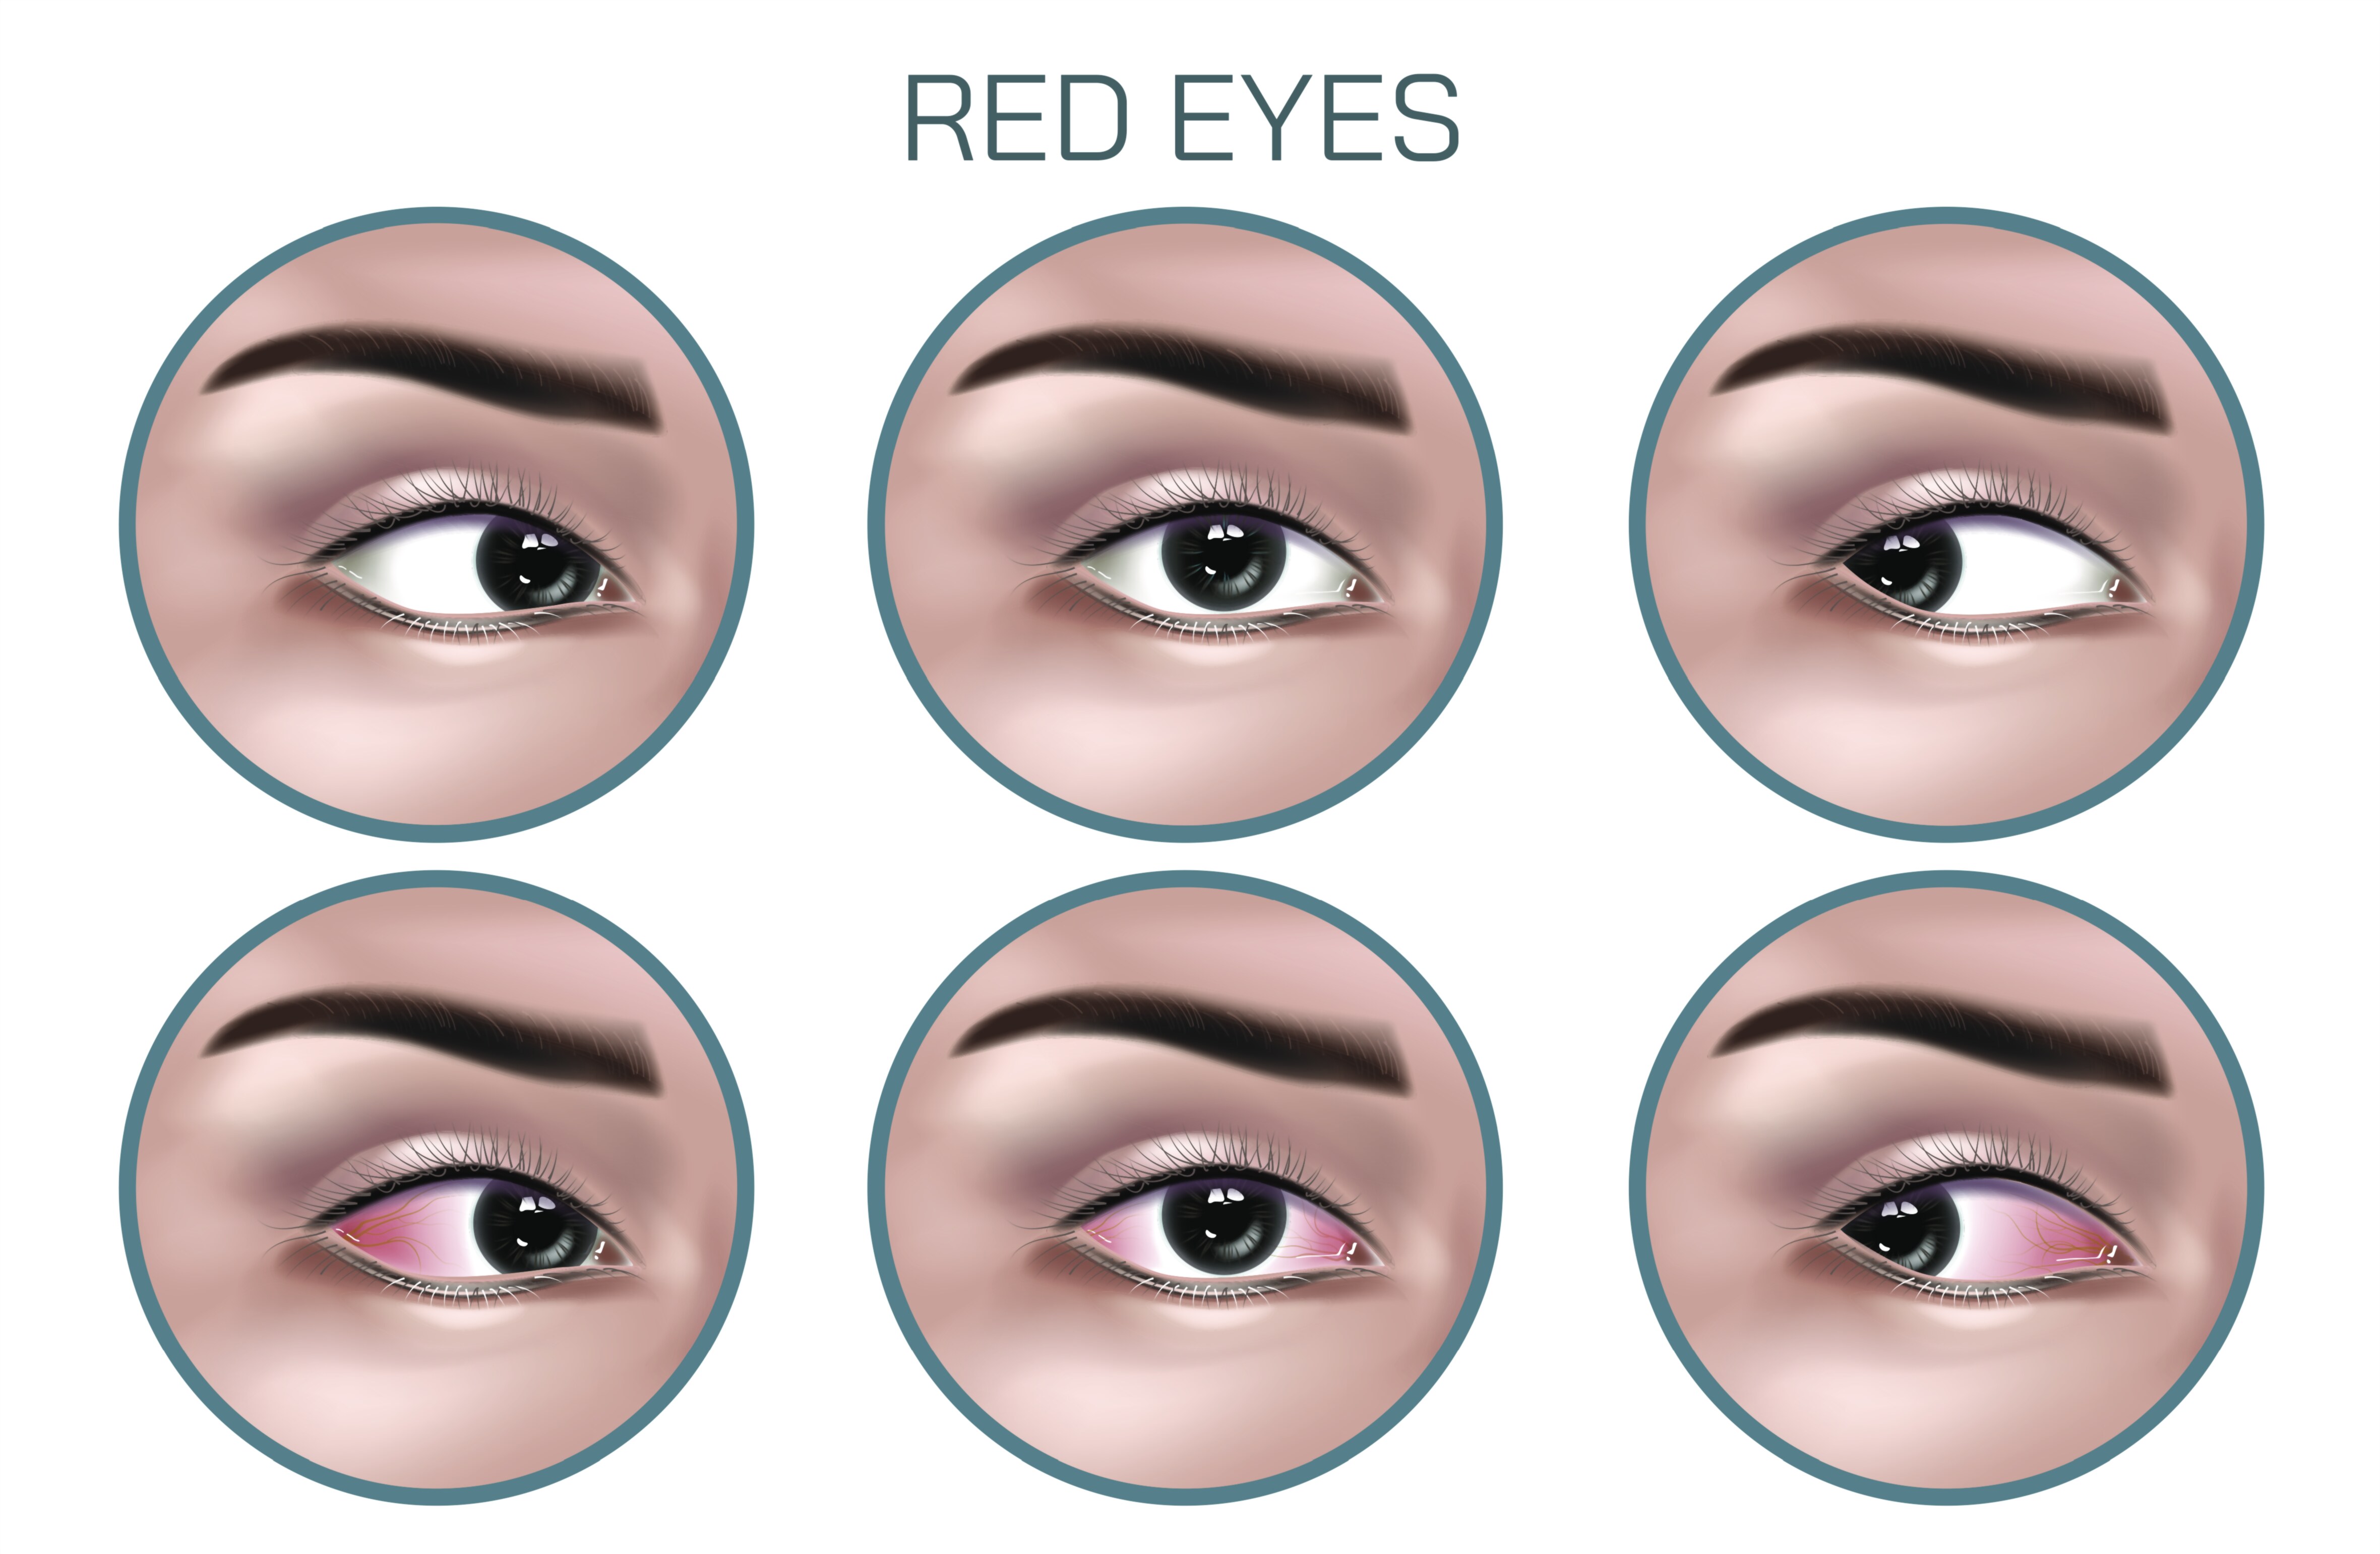
Red Eye Disease Vector Illustration for Medical and Ophthalmology Education
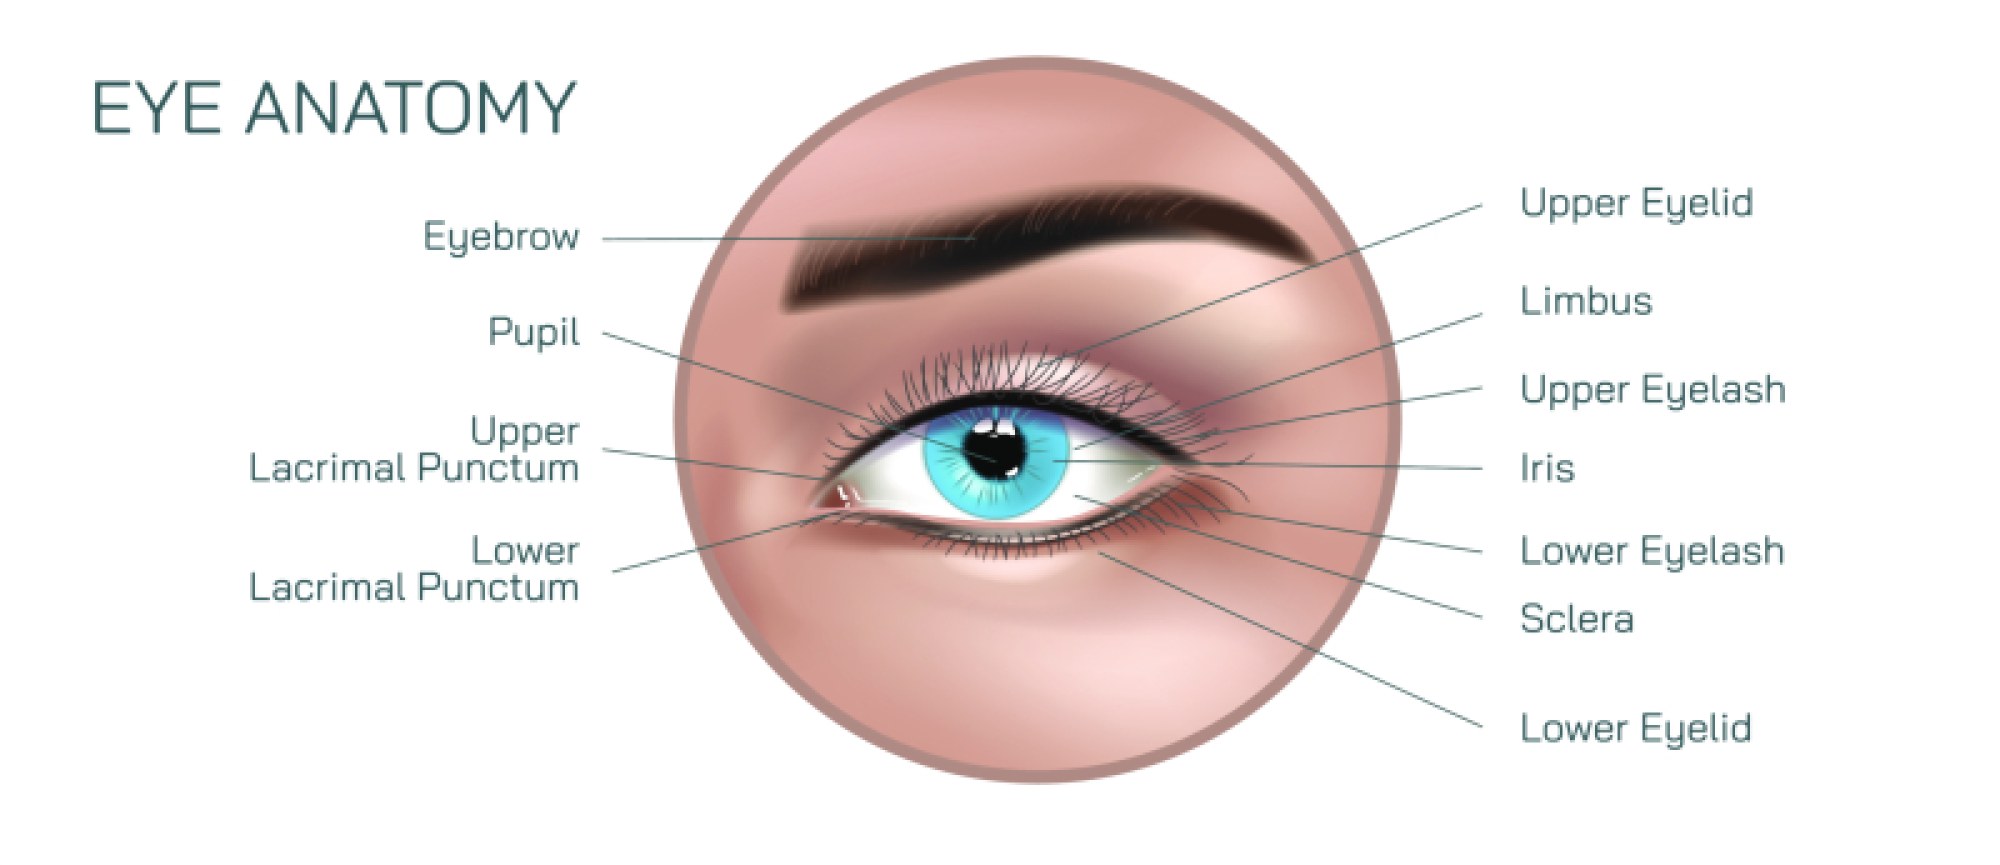
Red eye is one of the most frequent reasons patients seek ophthalmologic or general medical care, and while it may appear straightforward externally, its causes range from simple irritation to potentially sight-threatening disease. A vector illustration designed for medical and ophthalmology education transforms this everyday complaint into a structured, understandable visual model that reveals the underlying anatomy and mechanisms responsible for ocular redness. Because red eye is not a disease in itself but rather a symptom of various ocular conditions, a high-quality vector graphic becomes an essential teaching tool for clinicians, medical students, and patients by showing how different types of inflammation or irritation manifest in the blood vessels of the conjunctiva, episclera, and sclera, and how these patterns help guide differential diagnosis.
At the core of a red eye educational illustration is the depiction of vasodilation—dilation and congestion of blood vessels on or within the surface of the eye. Under normal circumstances, the conjunctiva overlying the sclera contains fine, barely visible blood vessels. In red eye, inflammatory or irritative signals cause these vessels to widen and fill with blood, creating the familiar appearance of redness. A side-by-side vector depiction of normal conjunctival vasculature versus the exaggerated vessel pattern of inflammation is invaluable in training clinicians to recognize how this physiological response forms the basis of many eye-related complaints. Because vector graphics can render thin vascular structures with precision, they allow detection of subtle differences such as superficial branching vascularity versus deeper, fixed episcleral vessel congestion.
Educational illustrations of red eye frequently differentiate common causes so that learners can associate characteristic redness patterns with specific conditions. For example, conjunctivitis (bacterial, viral, or allergic) typically presents with diffuse superficial dilation—bright, widespread redness accompanied by tearing, discharge, or itching. Episcleritis causes sectoral or localized redness and tenderness without deep pain. In contrast, scleritis produces a deeper, more violaceous hue with severe pain and tenderness, reflecting inflammation of the sclera rather than the conjunctiva. A vector diagram that labels each vascular pattern breaks down the complexity of clinical presentation in an intuitive visual way that helps learners avoid misdiagnosis.
One of the most valuable functions of a red eye vector illustration is helping clinicians recognize emergency presentations. Certain causes of red eye appear similar to benign conjunctivitis but carry risk of permanent vision loss if not treated promptly. Acute angle-closure glaucoma may produce diffuse redness accompanied by corneal haze, pupil dilation, and severe pain. Uveitis (iritis) typically shows circumcorneal injection—a ring of redness around the cornea caused by deep ciliary body inflammation. Corneal ulceration presents with focal redness plus an epithelial defect, frequently due to infection and more common in contact lens wearers. Showing these differences clearly within a single vector chart enables medical learners to build pattern recognition skills quickly and prioritize urgent referrals appropriately.
Beyond vascular patterns, vector illustrations can depict associated physical findings that guide diagnosis. For example, follicles or papillae inside the eyelids help distinguish allergic from viral conjunctivitis. A mucopurulent discharge can suggest bacterial etiology, while clear, watery discharge is more consistent with viral inflammation. Dry, irritated ocular surface with punctate epithelial staining can point toward dry eye disease. A subconjunctival hemorrhage—where a patch of blood collects beneath the conjunctiva—can be portrayed as well, highlighting its dramatic appearance and benign nature. Each of these features is easier to convey visually than verbally, especially when observing real-world variations that differ from textbook descriptions.
Patient experience can also be represented to support empathetic clinical understanding. While many individuals describe redness as cosmetic or uncomfortable, the condition can significantly affect daily life when associated with pain, light sensitivity, blurred vision, foreign body sensation, or excessive tearing. In education, vector simulations of how redness affects light perception or how corneal haze blurs visual clarity help caregivers and clinicians understand subjective symptoms in objective terms. This strengthens communication during consultations and increases adherence to treatment plans.
Treatment pathways can also be visually structured in a vector-based diagram to illustrate the logic of clinical decision-making. For example, allergic conjunctivitis treatment focuses on antihistamines and mast-cell stabilizers; bacterial conjunctivitis on antibiotics; viral conjunctivitis on supportive care and hygiene; episcleritis on mild anti-inflammatory therapy; and scleritis on systemic immunosuppression due to its association with autoimmune disease. A clearly labeled illustration showing therapeutic targets—such as conjunctiva, sclera, tear film, or aqueous humor—helps both clinicians and patients understand why one treatment is appropriate while another may be ineffective or harmful.
Vector graphics are especially valuable because they can be scaled, animated, or adapted for different levels of learning. A pediatric clinic may use a simplified, friendly version to reassure families about viral conjunctivitis, while a postgraduate ophthalmology course may use a highly detailed version showing vascular depth, limbal injection, anterior chamber cellular activity, or keratic precipitates. The clarity of vector artwork ensures that these layers can be added or removed without sacrificing accuracy.
In public health communication, red eye illustrations serve an important role in reducing unnecessary anxiety while simultaneously improving safety. Many cases of red eye resolve with conservative care, yet certain presentations demand urgent evaluation. A vector-based educational chart helps raise awareness among healthcare providers and the public by illustrating both harmless and high-risk signs visually rather than relying on potentially confusing descriptions. This encourages appropriate triage, protects sight, and supports confident medical decision-making.
Ultimately, a red eye disease vector illustration is more than an anatomical drawing. It is a compact visual education system that unifies physiology, pathology, pattern recognition, patient experience, and clinical urgency into a single narrative. By presenting the hidden mechanisms behind visible redness in a way that is both scientifically reliable and visually intuitive, the illustration strengthens diagnostic accuracy, improves communication between clinicians and patients, and supports a more informed and proactive approach to eye health across all levels of care.