Electromagnetic Frequency Vector Illustration Showing Spectrum from Radio Waves to Gamma Rays
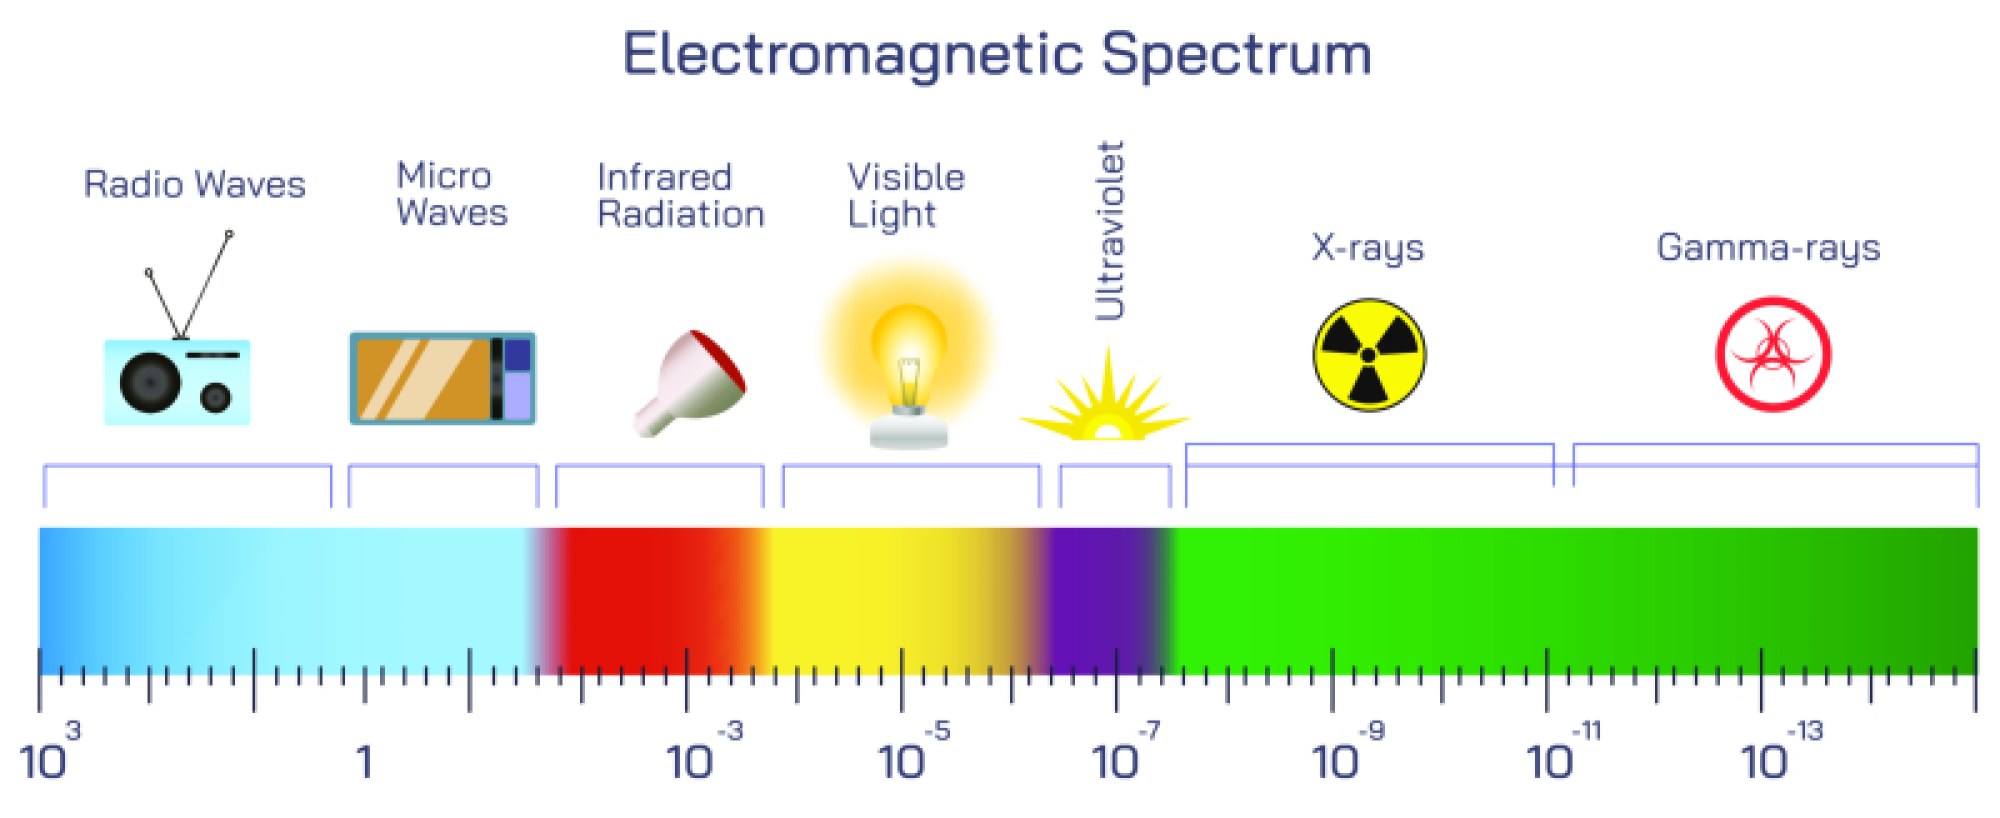
The electromagnetic spectrum represents the full range of electromagnetic radiation, spanning an extraordinary array of wavelengths and frequencies, from the long, low-energy radio waves to the extremely short, high-energy gamma rays. A vector illustration of the electromagnetic frequency spectrum typically visualizes the entire range of electromagnetic waves, emphasizing frequency, wavelength, energy levels, and applications for each type of radiation. This type of diagram provides a clear and intuitive understanding of how different parts of the spectrum behave physically, how energy changes across the spectrum, and how humans utilize each type of electromagnetic radiation in science, technology, medicine, and daily life. By combining frequency, wavelength, and energy into a single visual representation, the vector illustration translates complex physics concepts into an accessible and educational format suitable for students, researchers, and engineers.
The spectrum begins at the low-frequency, long-wavelength end with radio waves. In vector illustrations, radio waves are often shown with the longest waveforms and the lowest frequency values, ranging from a few kilohertz (kHz) to hundreds of megahertz (MHz). Radio waves carry minimal energy compared to other forms of electromagnetic radiation and are widely used in communication technologies, such as AM and FM radio broadcasting, television transmission, and wireless networks. In diagrams, the radio wave region may be visually expanded to emphasize the scale of its wavelength, highlighting its capacity to travel long distances and penetrate the atmosphere with minimal absorption. The vector illustration often includes labeled examples of technology that rely on radio waves, connecting abstract physics parameters to everyday experience.
Next in the spectrum are microwaves, with slightly higher frequencies and shorter wavelengths, typically ranging from about 300 MHz to 300 GHz. Vector illustrations depict microwaves as slightly compressed waveforms compared to radio waves. Microwaves are widely used in satellite communication, radar, microwave ovens, and wireless networking. Their shorter wavelengths allow higher data transmission rates than radio waves and enable targeted heating of water molecules in food. In an educational vector diagram, arrows or color gradients may indicate the relationship between wavelength, frequency, and energy, showing the gradual increase in energy as one moves across the spectrum.
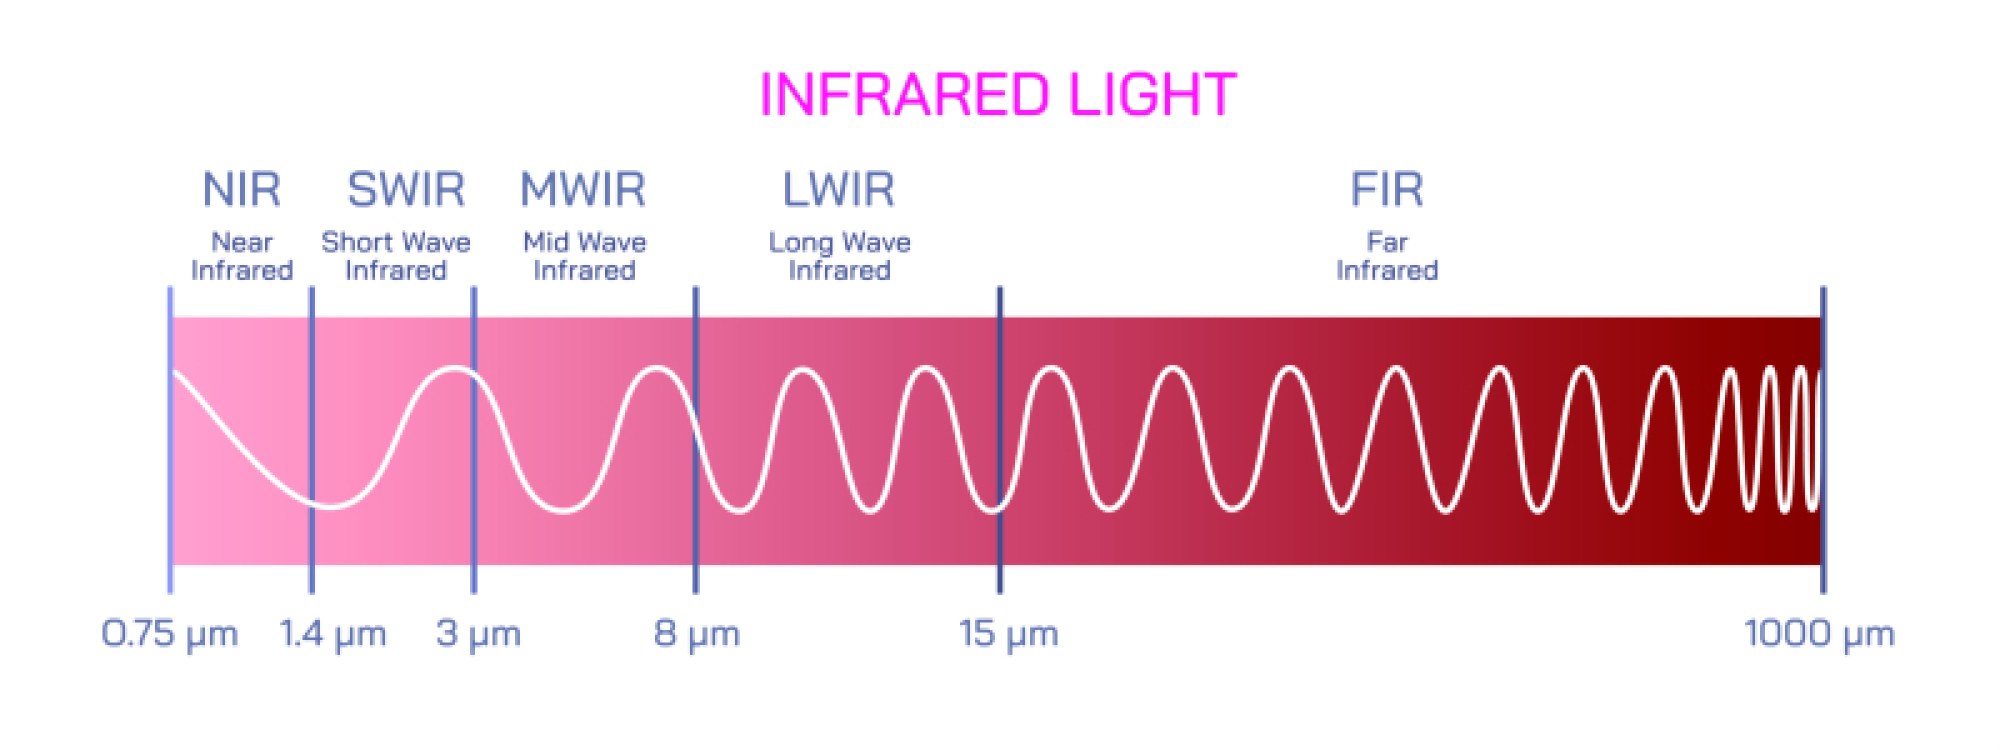
Following microwaves are infrared (IR) waves, which occupy a region of even shorter wavelength, typically from 700 nanometers (nm) to 1 millimeter (mm). Infrared radiation is associated with heat emission from objects and is widely utilized in thermal imaging, remote controls, heating devices, and optical sensors. In vector illustrations, IR waves are depicted as progressively compressed waveforms relative to microwaves, with annotations indicating that energy levels are higher and wavelengths shorter. The diagram may also differentiate between near-infrared, mid-infrared, and far-infrared to show the subcategories within this part of the spectrum. Infrared radiation is absorbed by molecules that then re-emit energy, which is why it is strongly linked to temperature measurement and thermal processes.
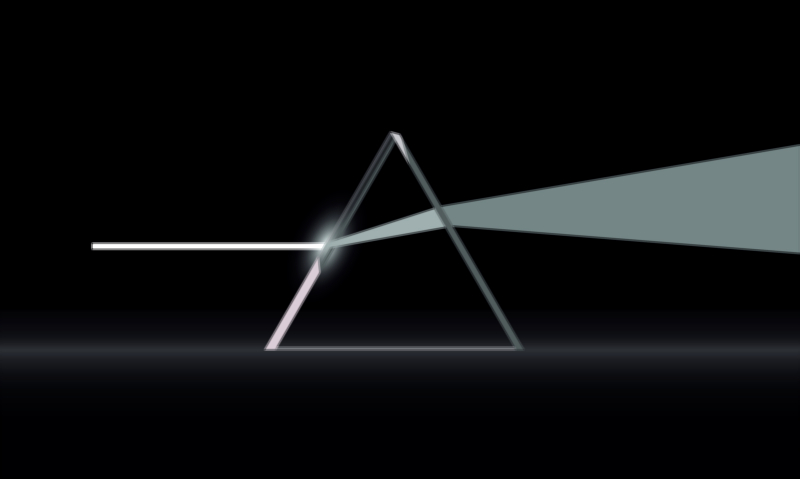
Visible light, the narrow band perceptible to the human eye, occupies wavelengths from approximately 400 nm (violet) to 700 nm (red). In vector illustrations, this section is often represented as a colorful band, showing the gradual change of wavelength across the colors of the rainbow. Visible light has higher energy than infrared and microwaves, and its frequencies correspond to those that can stimulate photoreceptor cells in the retina. Applications of visible light include vision, photography, optical instruments, fiber optics, and lighting technologies. Vector diagrams may use a spectrum gradient to show the sequence of violet, blue, green, yellow, orange, and red, illustrating the correlation between wavelength, frequency, and perceived color.
Immediately following visible light is ultraviolet (UV) radiation, with wavelengths ranging from approximately 10 nm to 400 nm. UV radiation carries higher energy than visible light and is capable of inducing chemical reactions, causing fluorescence, and affecting biological tissue. In vector illustrations, UV waves are shown as more compressed waveforms with higher frequency labels, emphasizing the increase in photon energy. Applications of UV radiation include sterilization, fluorescence detection, UV curing in industrial processes, and medical therapies. The diagram may also distinguish between UV-A, UV-B, and UV-C subcategories, each with specific energy levels and biological effects.
Next are X-rays, with wavelengths typically between 0.01 nm and 10 nm. X-rays are high-energy radiation that can penetrate matter to varying degrees depending on density, making them invaluable in medical imaging, security scanning, and material analysis. In vector illustrations, X-rays are depicted as even shorter, higher-frequency waves, with compressed waveform spacing and annotations indicating energy per photon. X-ray applications rely on their ability to pass through soft tissue while being absorbed by denser materials like bone, allowing imaging of internal structures. Advanced diagrams may also note the ionizing potential of X-rays, highlighting the need for shielding and safety measures.
At the extreme high-energy end of the spectrum are gamma rays, with wavelengths less than 0.01 nm and frequencies exceeding 10¹⁹ Hz. Gamma rays carry immense energy per photon and are typically produced by nuclear reactions, radioactive decay, or cosmic phenomena. In vector illustrations, gamma rays are represented as the most compressed waveforms with the highest frequency labels. Their applications include cancer radiotherapy, sterilization, astrophysics research, and nuclear detection. Gamma rays are ionizing, capable of breaking chemical bonds and affecting biological tissues at the atomic level, emphasizing the need for controlled handling in practical applications.
A comprehensive vector illustration of the electromagnetic frequency spectrum integrates frequency, wavelength, and energy, often depicted as a continuous gradient from low-energy, long-wavelength radio waves to high-energy, short-wavelength gamma rays. Labels typically include:
Wavelength ranges in meters, centimeters, nanometers, or picometers
Frequency ranges in Hertz, kilohertz, megahertz, gigahertz, and terahertz
Photon energy levels in electron volts or joules
Common applications for each type of radiation
Subdivisions of certain categories, such as UV-A/B/C, near/mid/far infrared, or long/short radio waves
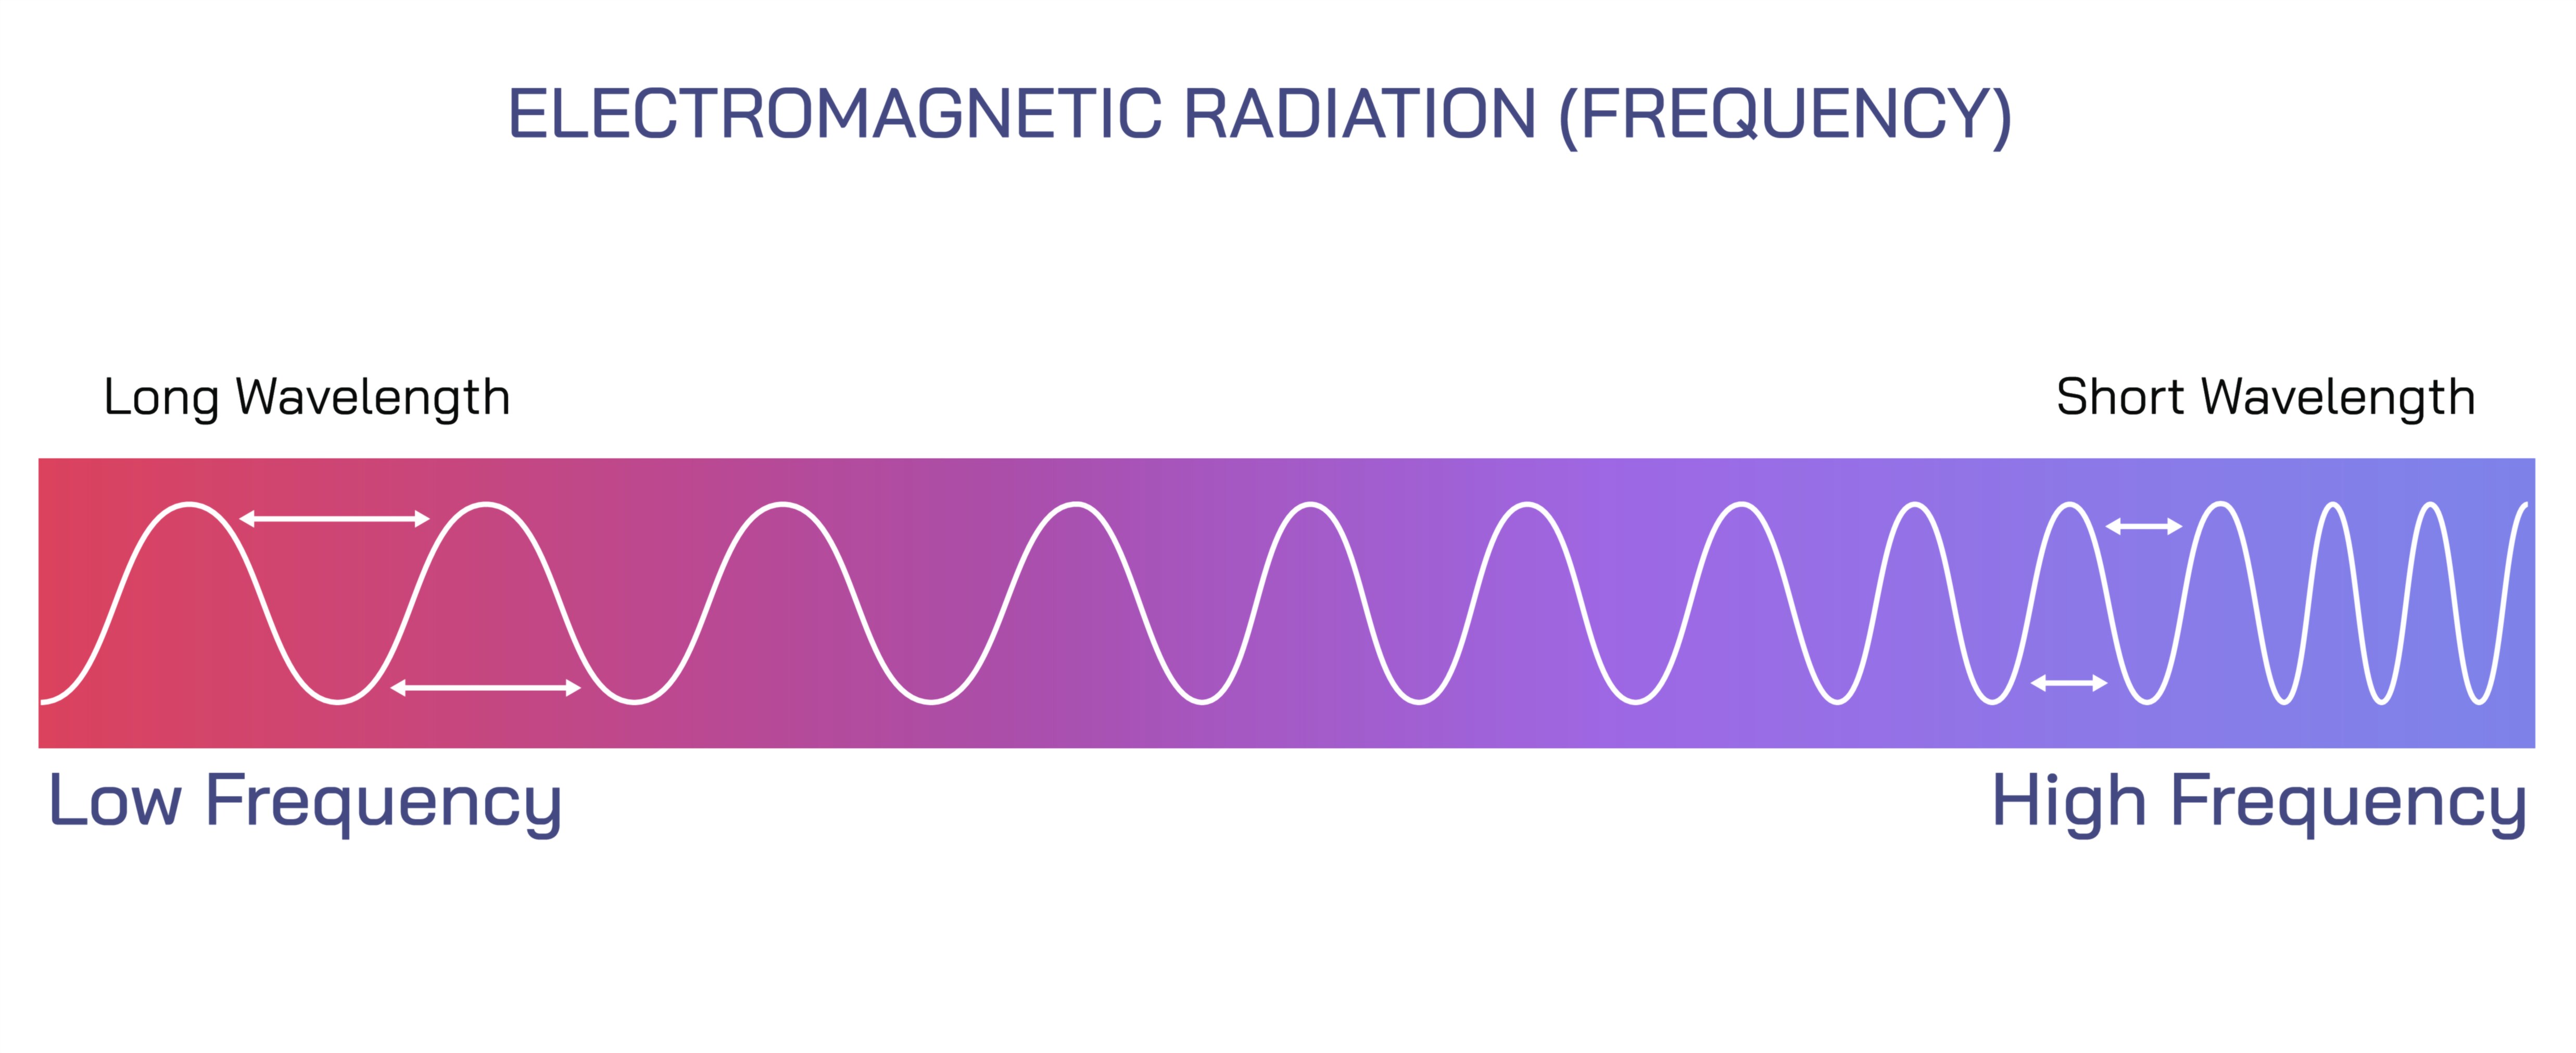
Vector illustrations may also include arrows showing the inverse relationship between wavelength and frequency, reinforcing that shorter wavelengths correspond to higher frequencies and higher photon energy. Color coding, gradients, and waveform depictions help viewers intuitively understand the continuous nature of the spectrum while distinguishing specific regions and their practical uses.
By visually integrating the entire electromagnetic spectrum from radio waves to gamma rays, the vector illustration provides an intuitive understanding of the hierarchy of energy, wavelength, and frequency. It allows learners to see the transitions between different types of radiation, appreciate their applications, and understand their physical properties in a single, coherent diagram. Such illustrations are essential in physics, astronomy, communications, medical imaging, and engineering, offering a clear visual reference for the vast range of electromagnetic phenomena that influence technology, scientific research, and everyday life.