Infrared Radiation Illustration: Wavelength, Energy, and Applications Explained
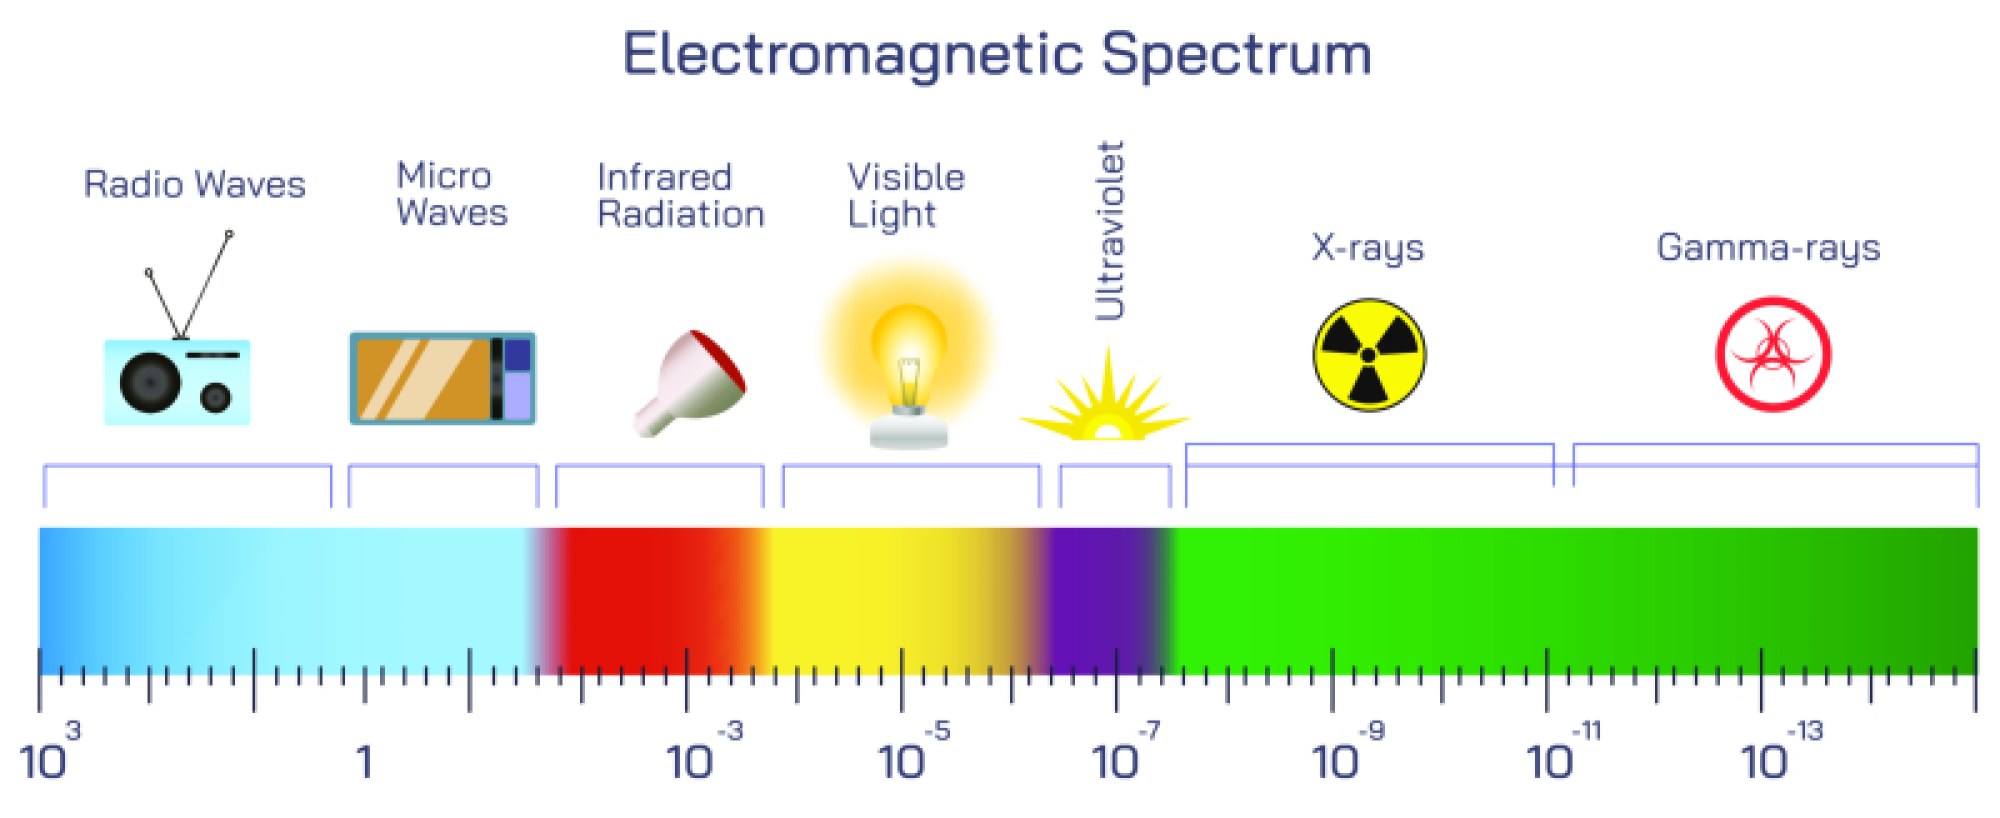
Infrared (IR) radiation is a key region of the electromagnetic spectrum, and an illustration explaining its wavelength range, energy properties, and practical applications helps make clear how invisible radiation influences daily life, science, and technology. Although the human eye cannot detect infrared radiation, we constantly interact with it because IR is closely tied to heat. Every object warmer than absolute zero emits infrared radiation, and visual depictions often show infrared energy as glowing arcs or long waves radiating from heated bodies. In diagrams of the electromagnetic spectrum, infrared sits just beyond visible red light, bridging the relatively low-energy microwaves and the higher-energy visible band. These illustrations make it easy to see why IR radiation behaves both like a communication medium and a thermal energy carrier.
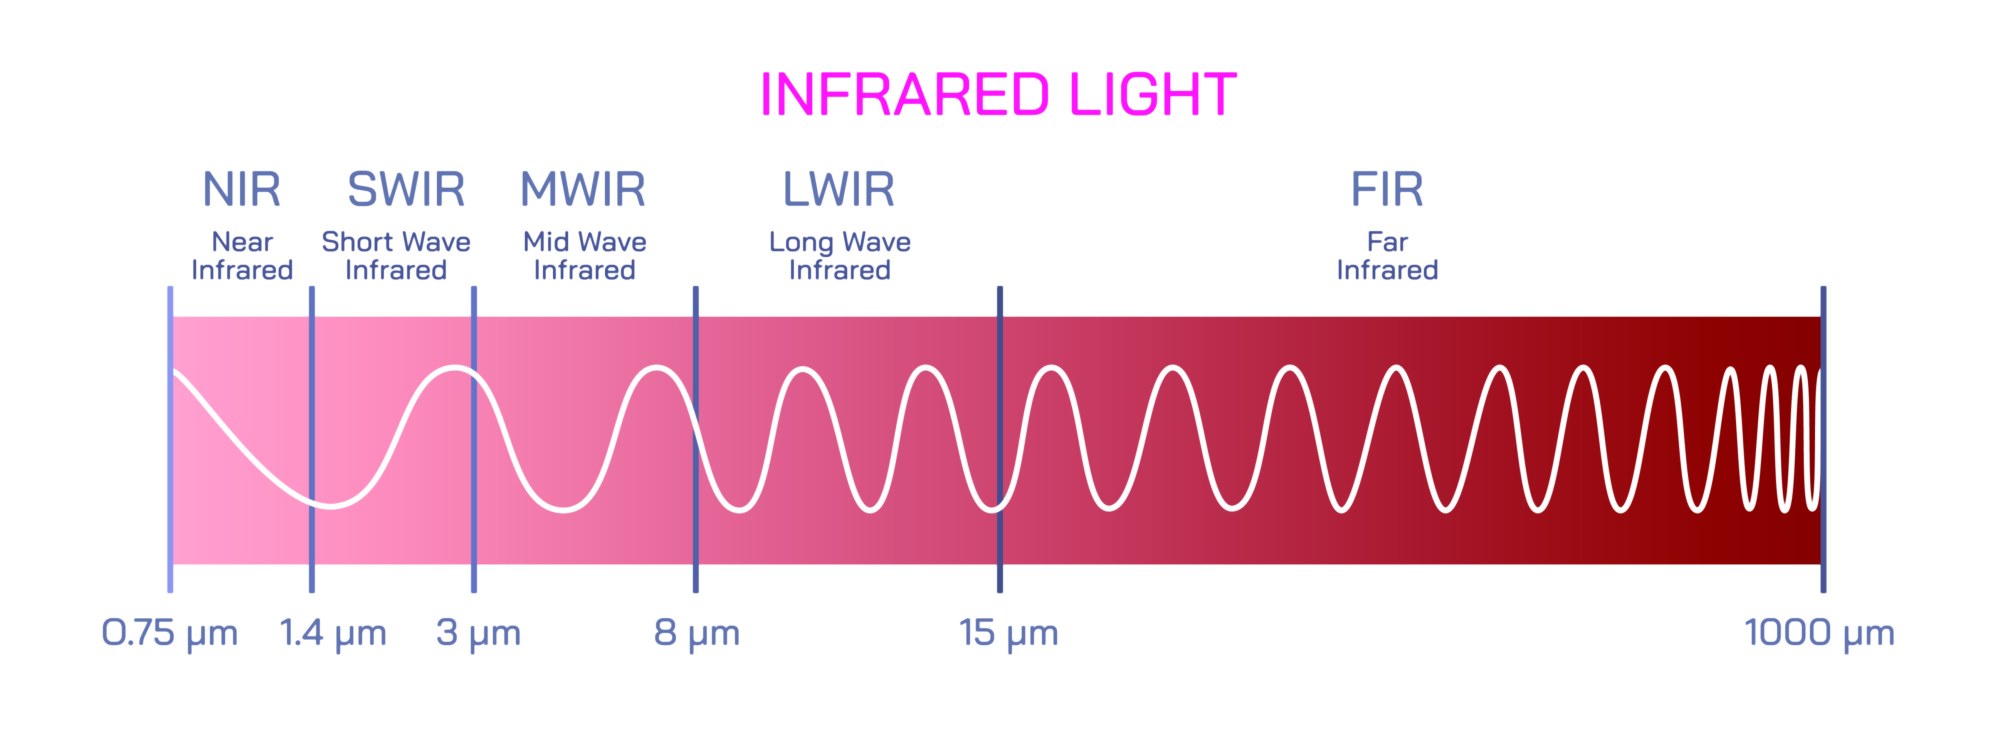
Spectrum diagrams typically show infrared spanning wavelengths from roughly 700 nanometers to 1 millimeter, divided into three major subdivisions: near-infrared, mid-infrared, and far-infrared. Near-infrared lies closest to visible light and features shorter wavelengths and higher frequencies. It is commonly shown on illustrations as the range used in fiber-optic communication, remote sensing, biometric scanners, and infrared photography. Mid-infrared radiation is depicted as interacting strongly with molecular vibrations, making it useful in spectroscopy, gas sensing, and thermal imaging. Far-infrared sits closest to the microwave region and is heavily associated with heat emission; images often represent far-IR with glowing thermal gradients radiating from warm bodies, volcanic surfaces, heating elements, or living organisms.
A valuable element of infrared visualizations is the inverse relationship between wavelength and energy. In explanatory diagrams, IR photons have lower energy than visible light photons but higher energy than microwaves. Illustrations show energy increasing when moving from far-IR toward near-IR and visible light, making it clear why different subregions behave differently in technology. For example, near-infrared can transmit through glass and optical fibers, while far-infrared is strongly absorbed by water and most biological tissues, turning into heat. These diagrams often color-code absorption patterns in materials and atmospheric gases, demonstrating that Earth’s atmosphere selectively absorbs much of the mid- and far-infrared radiation emitted by the planet—a process central to climate and the greenhouse effect.
Infrared detection illustrations commonly show that IR radiation reveals temperature differences, not just heat output. Thermal-imaging cameras, often shown in diagrams of building inspections or wildlife monitoring, convert IR energy into visible color maps. Warmer regions appear brighter or more saturated, and cooler regions appear darker. This capability allows firefighters to locate people in smoky buildings, engineers to find overheating machine components, and surgeons to analyze blood flow during operations. Thermography illustrations highlight that IR imaging works in complete darkness because it depends on emitted heat rather than visible light.
Another recurring theme in infrared diagrams is communication and signal transmission. Near-IR radiation powers fiber-optic data transfer because it can travel long distances with minimal signal loss. Illustrations of network cables or data pulses travelling through glass fibers show packets of light bouncing along their internal surfaces. IR is also used in remote controls, which transmit encoded infrared pulses to televisions and appliances. Diagrams often overlay these signals with arrows or wave patterns showing line-of-sight transmission and short-range functionality.
Biological and medical illustrations emphasize therapeutic uses of infrared radiation. Far-infrared lamps and heating pads appear in diagrams about physiotherapy, where IR energy increases blood circulation in tissues and relaxes muscles. Biomedical imaging illustrations sometimes show IR spectroscopy identifying oxygenation levels in tissues or measuring metabolism without ionizing radiation.
Environmental diagrams show how infrared radiation plays a central role in the Earth–atmosphere energy balance. The Sun emits visible and near-infrared radiation, which warms Earth’s surface. That surface then re-emits energy primarily as far-infrared radiation. Greenhouse gases—including carbon dioxide, methane, and water vapor—absorb and reradiate this infrared energy, trapping heat in the atmosphere. These diagrams often show arrows cycling between Earth’s surface and atmosphere to illustrate the long-wave radiation feedback process.
Astronomy illustrations highlight the power of infrared telescopes, which can detect radiation from dust-shrouded regions of space that are invisible to optical telescopes. Diagrams may show IR telescopes peering through interstellar dust clouds to observe star and planet formation, or detecting faint objects such as brown dwarfs and exoplanets. Infrared astronomy images often connect IR detection to temperature, showing that cold cosmic bodies emit infrared rather than visible light.
Industrial and safety illustrations focus on infrared sensors and automation systems. Motion detectors and security systems rely on IR detection to sense changes in emitted heat signatures. In manufacturing, IR heating enables rapid drying, welding, curing, and surface finishing because far-infrared radiation is absorbed efficiently by many materials. These applications are frequently shown using schematic representations of machinery emitting directional IR waves that heat, detect, or activate processes.
Household examples in IR illustrations help reinforce everyday relevance:
• stovetop burners and heaters glowing red-orange but radiating mostly infrared heat
• smartphones using IR for facial recognition sensors
• night-vision binoculars detecting infrared emission from animals and people
• airport body scanners generating thermal maps to detect fever or concealed objects
When these scenarios are grouped side-by-side, viewers see that infrared radiation is not a narrow scientific concept but part of everyday living and modern technology.
Ultimately, an illustration of infrared radiation connects wavelength, energy, and use cases into a coherent visual narrative. It shows that although humans cannot see infrared radiation with the naked eye, it surrounds us—warming us, communicating for us, diagnosing us, monitoring environments, and revealing hidden details of the world. By depicting IR waves radiating from objects, interacting with materials, and powering devices across science and society, the illustration transforms an invisible form of light into an understandable and tangible part of the electromagnetic landscape.