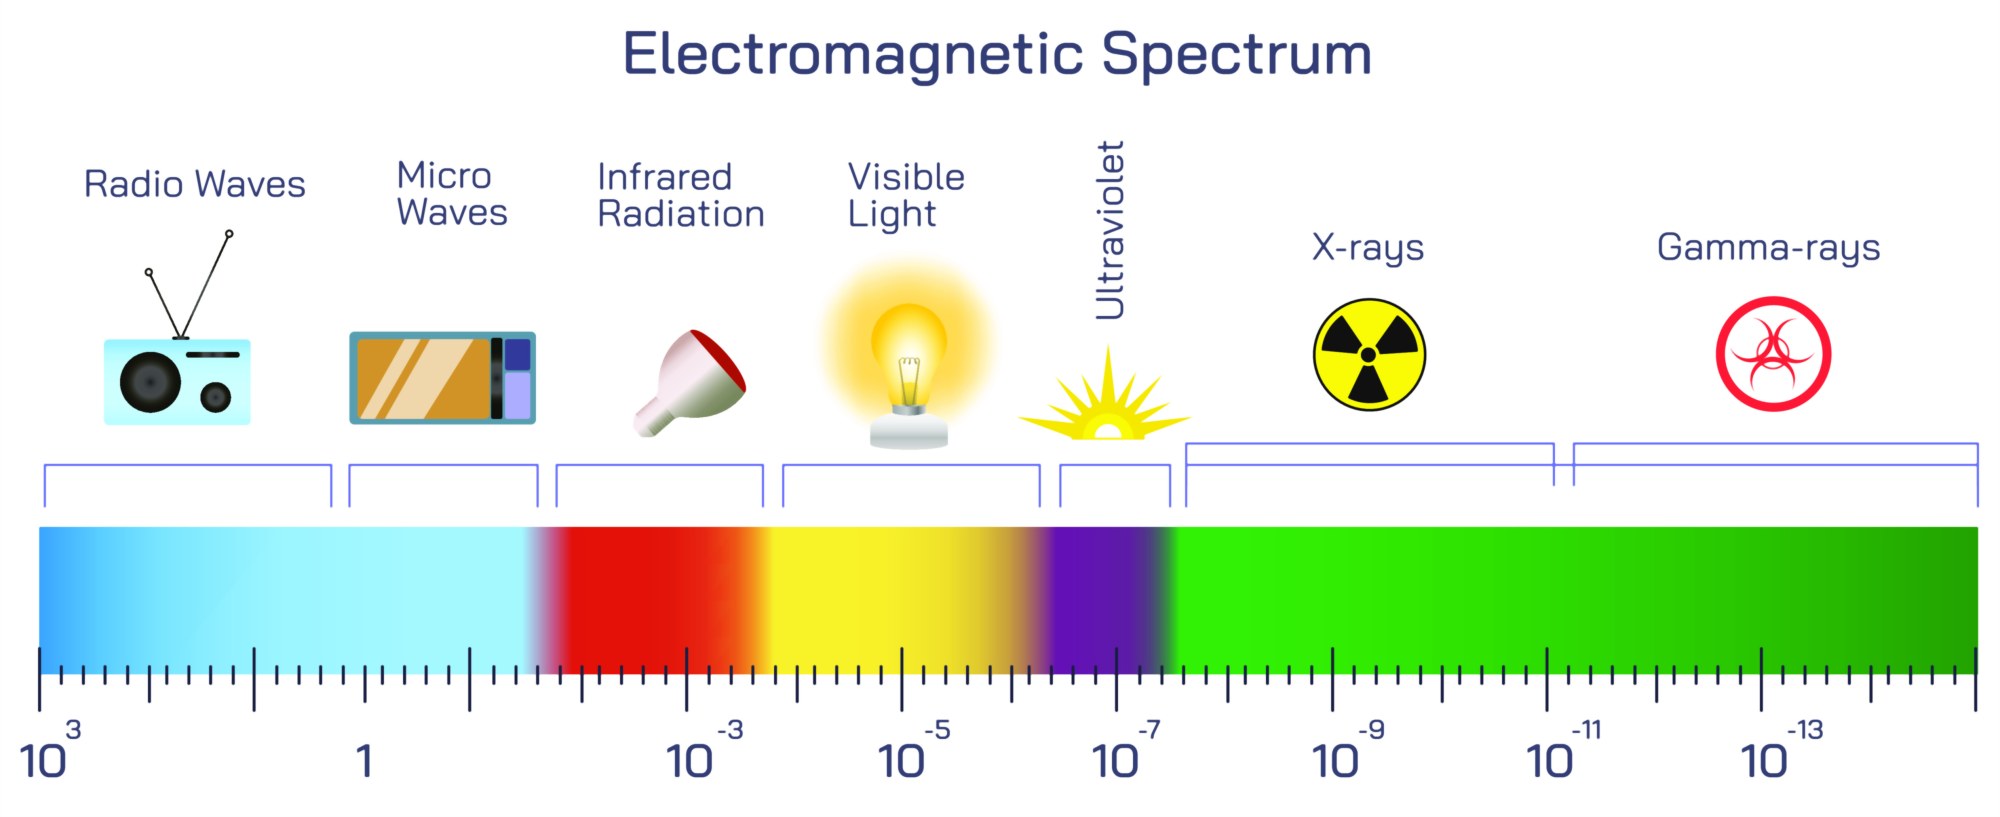
Electromagnetic Spectrum Illustration: Types, Wavelengths, and Applications Explained
The electromagnetic spectrum is a sweeping continuum of electromagnetic waves arranged according to their wavelength and frequency, and an illustration displaying this full range helps make sense of how light, radio signals, X-rays, Wi-Fi, microwaves, and countless other forms of radiation are all manifestations of the same underlying physical phenomenon. At the most fundamental level, electromagnetic waves consist of oscillating electric and magnetic fields that travel through space at the speed of light. Although they share the same physical nature, different categories of electromagnetic radiation vary dramatically in their wavelengths, their ability to penetrate matter, the amount of energy they carry, and the purposes for which humans use them. A detailed visual representation of the electromagnetic spectrum typically stretches from long-wavelength, low-frequency waves on one end to extremely short-wavelength, high-frequency waves on the other, showing a smooth but vast transition between types of radiation. This continuum illustrates how familiar technologies and environmental phenomena fit together in a single framework.
On the far left of a spectrum illustration appear radio waves, the longest electromagnetic waves. Their wavelengths can span from kilometers down to meters, and they carry the lowest energy among electromagnetic radiation types. Radio waves travel efficiently through the atmosphere and around obstacles due to their long wavelengths, which is why they are widely used for broadcast communication, AM and FM radio, long-range navigation systems, and wireless transmission. Visual diagrams frequently show large antennas emitting broad wavefronts to emphasize radio’s long-distance propagation. Moving slightly rightward along the spectrum, microwaves emerge, with wavelengths ranging from centimeters to millimeters. They penetrate clouds, smoke, and non-metallic materials, making them useful in weather radar, satellite communications, GPS technology, and microwave ovens. An illustration may identify how microwaves cause water molecules to vibrate and generate heat, explaining why they are used in kitchen appliances and scientific heating systems.
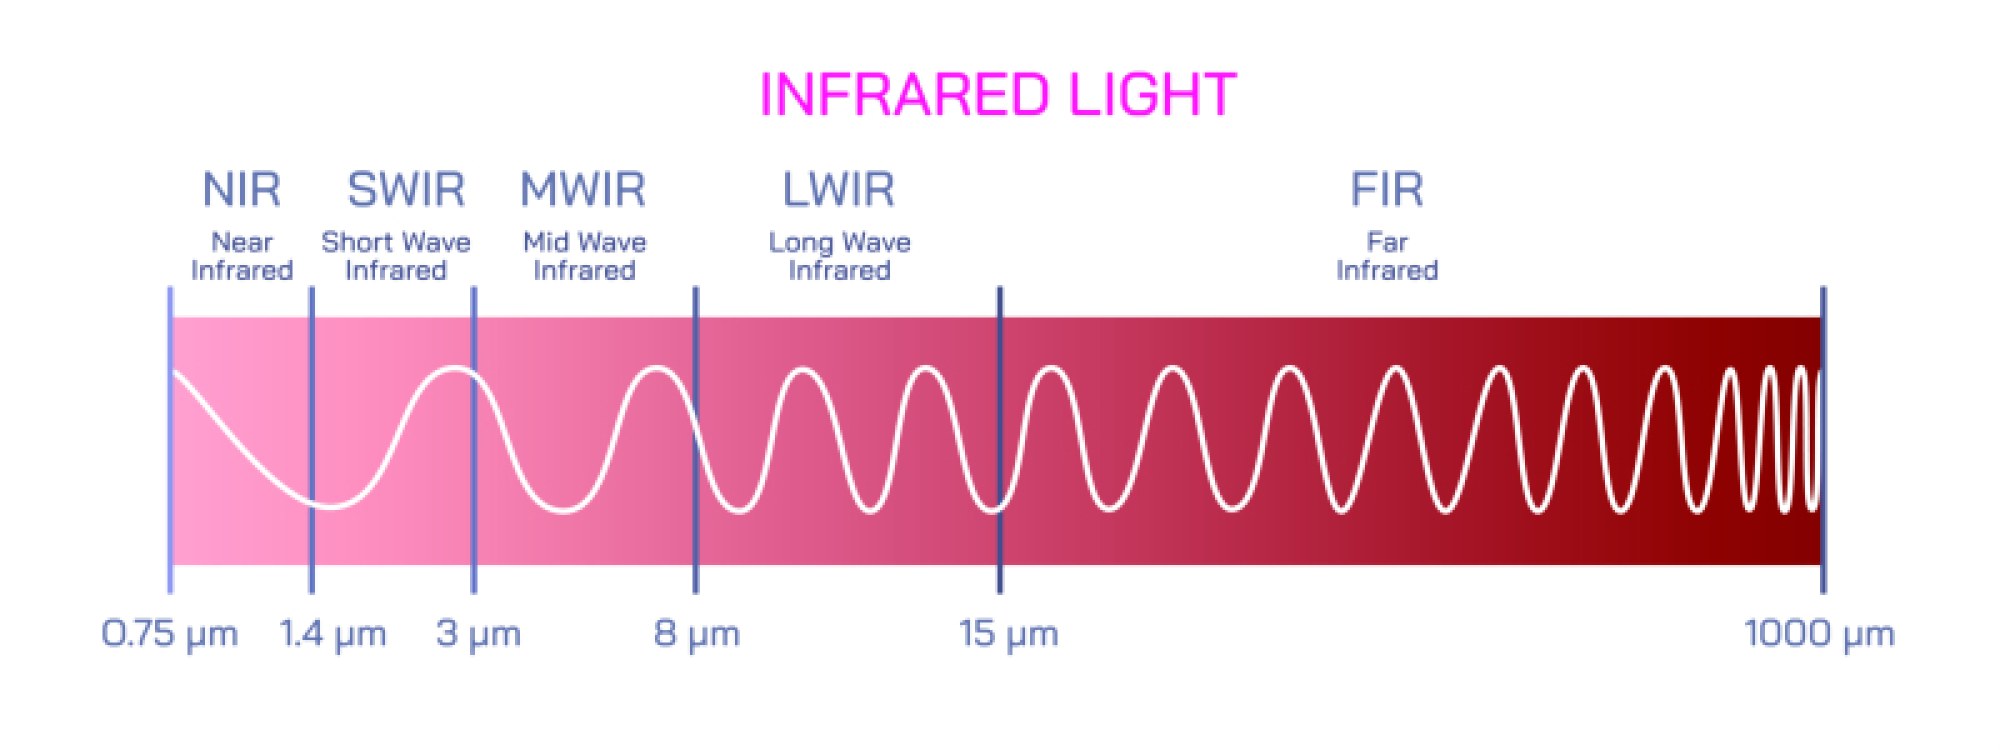
Next in most spectrum diagrams come infrared waves, whose wavelengths shorten into the micrometer scale. Infrared radiation is strongly associated with heat because all warm objects emit infrared energy. When depicted visually, infrared often appears as a heat glow radiating from people, animals, and engines. It plays key roles in remote controls, night-vision cameras, thermal imaging equipment, fire detection, and industrial monitoring. By the time the illustration reaches the center of the spectrum, the group most familiar to humans appears: visible light. The visible range is extraordinarily small compared with the rest of the spectrum, yet it forms the only portion detected naturally by the human eye. An illustration commonly spreads these wavelengths into the rainbow we recognize—red, orange, yellow, green, blue, indigo, violet—from longest to shortest wavelength. Visible light allows us to see the world, yet it occupies just a tiny sliver of the electromagnetic landscape.
Just beyond the violet end of the visible band lie ultraviolet (UV) waves, shorter in wavelength and higher in energy. UV radiation contributes to suntanning and sunburns, sterilizes medical equipment, supports vitamin D production in the skin, and is used in forensic and fluorescence applications. A spectrum illustration often separates UV into near-UV, far-UV, and extreme-UV categories, displaying increasing energy and biological impact. Continuing rightward, electromagnetic waves intensify into X-rays. With far shorter wavelengths, X-rays penetrate human tissue but are absorbed by dense structures like bone or metal. Illustrations pairing X-rays with medical imaging systems emphasize how X-ray absorption patterns produce diagnostic images used in hospitals and dentistry. Just beyond X-rays appear gamma rays, the highest-frequency, shortest-wavelength, and most energetic form of electromagnetic radiation. Gamma radiation is generated in nuclear reactions, radioactive decay, supernovas, and high-energy astrophysical events. In medical applications, gamma rays are harnessed to destroy cancer cells, sterilize equipment, and trace molecular processes, though protection is essential due to their extreme penetrating power.
A compelling aspect of electromagnetic spectrum illustrations is the inverse relationship between wavelength and frequency. As wavelength decreases from left to right, frequency and photon energy increase. Diagrams reinforce this relationship with horizontal scales labeled in meters, micrometers, nanometers, and picometers, alongside growing frequency scales that rise from kilohertz (kHz) and megahertz (MHz) to gigahertz (GHz), terahertz (THz), and beyond. This dual-axis representation makes it clear that electromagnetic radiation cannot be categorized by wavelength alone; different groups of waves are interconnected and follow consistent mathematical relationships across the entire spectrum. When energy is shown as a rising bar or upward-sloping line parallel to decreasing wavelength, the viewer grasps why high-energy radiation demands additional shielding and safety while low-energy radiation is suitable for communication and broadcasting.
Illustrations also highlight how interaction with matter depends on wavelength and energy. Radio waves may pass easily through the atmosphere and non-conductive solids, while microwaves interact strongly with polar molecules like water. Infrared is absorbed by most solids and liquids and is detected as heat. Visible light is absorbed or reflected depending on surface chemistry, producing color. Ultraviolet can break molecular bonds and damage DNA, X-rays are energetic enough to penetrate soft tissues, and gamma rays can pass through thick shielding unless heavy-metal barriers are used. A cross-section illustration of the human body interacting with each wavelength makes these effects intuitive: radio waves pass around the body harmlessly, infrared is emitted by warm skin, visible light reflects to form images, UV penetrates the epidermis and can cause damage, and X-rays pass through soft tissue to produce skeletal shadows, while gamma rays continue through, requiring protective materials.
Earth’s atmosphere plays a critical role in shaping how electromagnetic radiation reaches the surface, and many diagrams include an atmospheric absorption overlay. Radio waves and some microwaves reach Earth easily, allowing long-range communication. Infrared radiation is partially absorbed by greenhouse gases like carbon dioxide and water vapor, contributing to atmospheric heat trapping. Visible light transmits efficiently through the atmosphere, bathing the surface in sunlight. Most UV radiation is blocked by the stratospheric ozone layer, preventing severe biological harm. X-rays and gamma rays are almost completely absorbed before reaching the surface, ensuring that high-energy radiation from space does not constantly bombard life. These atmospheric absorption bands, often drawn as shaded regions across the spectrum diagram, demonstrate why Earth’s environment and biological systems evolved within specific electromagnetic windows.
In modern technology, electromagnetic radiation is essential across virtually every industry. Illustrations linking spectrum segments to their applications demonstrate how each region supports daily life: radio waves for broadcasting, Wi-Fi, and telecommunications; microwaves for GPS, radar, and data links; infrared for remote sensing, fiber-optic control, and temperature scanning; visible light for imaging, display systems, photography, and illumination; ultraviolet for sterilization, mineral identification, and electronics manufacturing; X-rays for medical scanning, security screening, and material analysis; gamma rays for cancer therapy, nuclear science, and deep-space astrophysics. The spectrum image becomes an organizational map for the entire technological world.
Educational illustrations sometimes connect electromagnetic waves to quantum transitions. Energy absorbed by electrons in atoms moves them to higher energy levels; when electrons return to lower levels, they emit photons of specific wavelengths. This model explains why neon lights glow red, why sodium streetlights glow yellow, and why stars emit distinct spectral signatures. Astronomical spectrum diagrams show stars, nebulae, and galaxies emitting radiation across multiple wavelength bands, and observatories are designed accordingly: radio telescopes for long-wave astronomy, infrared telescopes for heat signatures, optical telescopes for visible light, ultraviolet space observatories, X-ray telescopes for black holes and neutron stars, and gamma-ray space detectors for cosmic explosions. A single electromagnetic spectrum illustration can incorporate all of these observational windows, making it clear that no single band tells the full story of the universe.
Ultimately, an electromagnetic spectrum illustration is not just a chart of wavelengths—it is a visual bridge connecting physics, technology, biology, environmental science, and astronomy. It shows that the light we see is only a tiny component of a vastly broader spectrum and that the full range of electromagnetic waves is essential to understanding the Earth, the universe, and modern civilization. By presenting these waves side by side, grouped by wavelength and purpose, the illustration transforms an abstract scientific concept into a unified framework that reveals how electromagnetic energy shapes the movement of information, the function of machines, the health of living organisms, and the exploration of space.