Earthquake Showing Seismic Waves, Epicenter, Fault Lines, and Ground Vibration Patterns
An earthquake is a sudden and often dramatic release of energy within the Earth's crust, producing vibrations that propagate through the ground and can have profound geological, structural, and human impacts. A vector illustration of an earthquake typically combines several key elements: the epicenter, the fault lines, the seismic waves that radiate outward, and the ground vibration patterns, providing a comprehensive visual representation of the phenomenon. Such an illustration serves as both an educational tool and a way to convey the mechanics of earthquakes in geoscience, engineering, and disaster preparedness contexts.
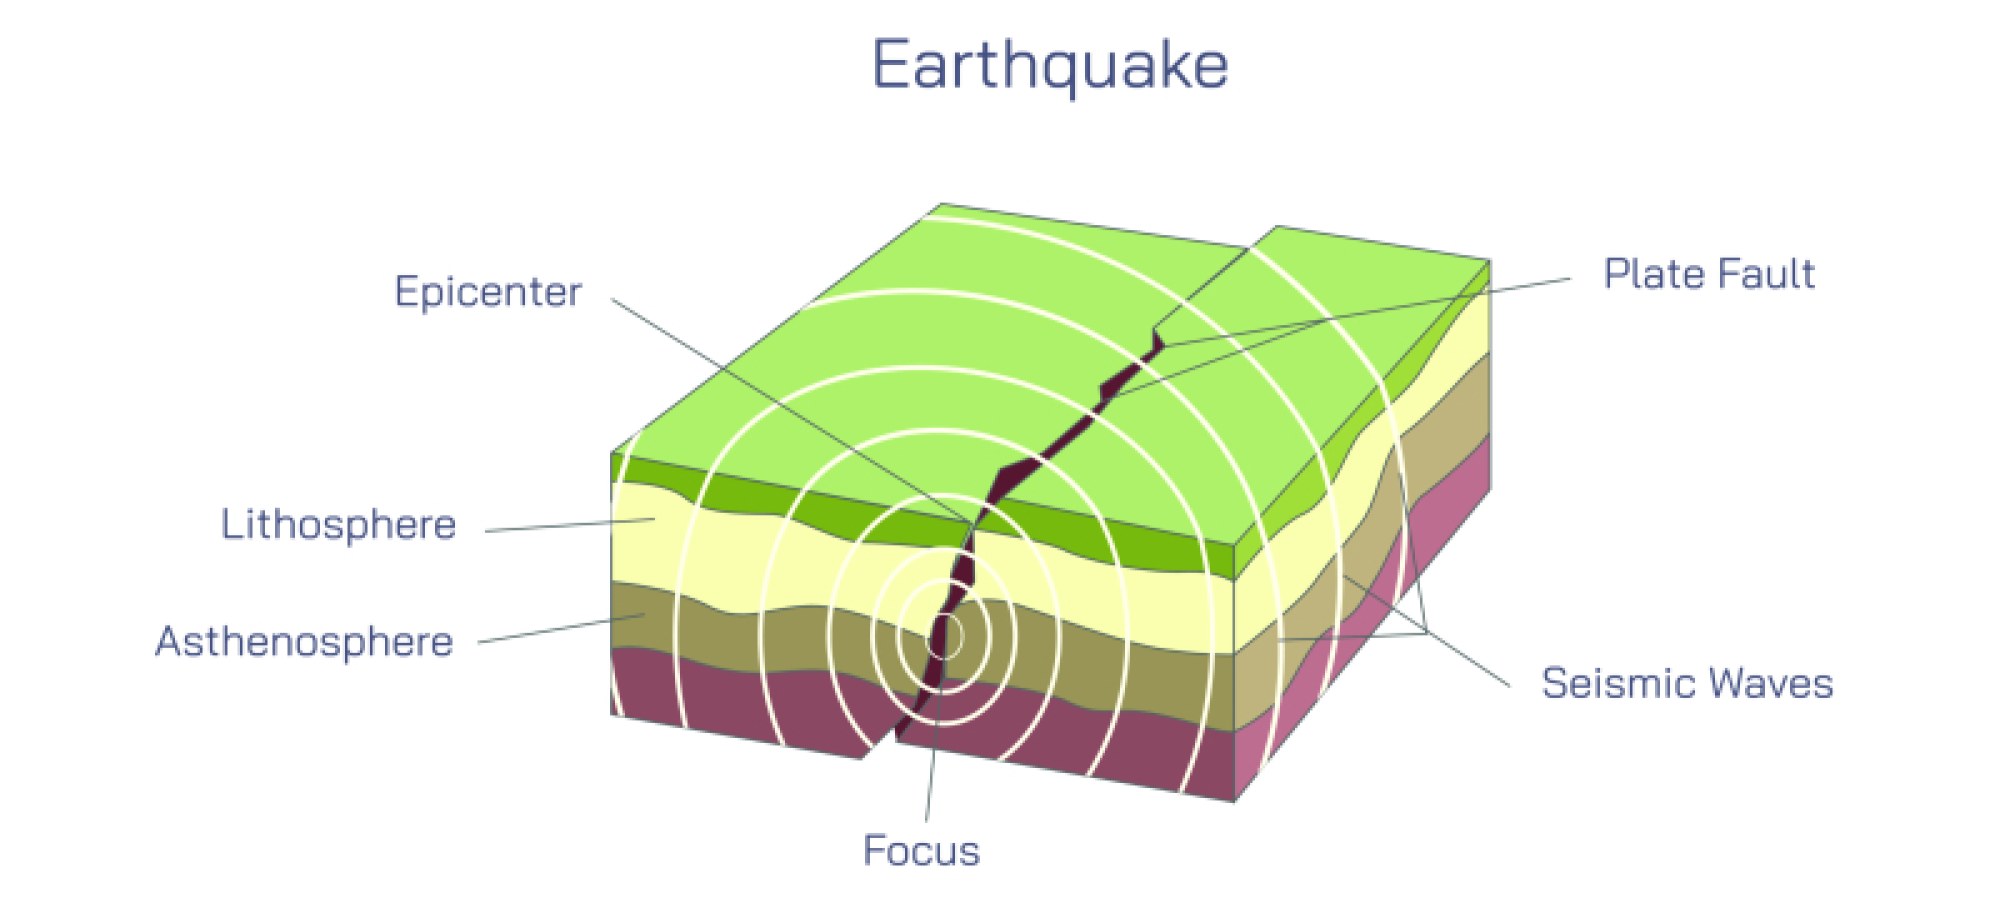
At the core of an earthquake is the epicenter, the point on the Earth's surface directly above the initial rupture within the crust, known as the hypocenter or focus. In vector diagrams, the epicenter is usually marked with a star or dot on a surface map, often accompanied by concentric circles indicating the spreading of seismic waves. This is the point from which the energy originates, and its location is crucial for assessing potential damage, emergency response, and understanding the tectonic context. The focus, beneath the surface, is where strain accumulated along a fault suddenly releases, triggering the movement of rock layers and generating the earthquake’s seismic energy.
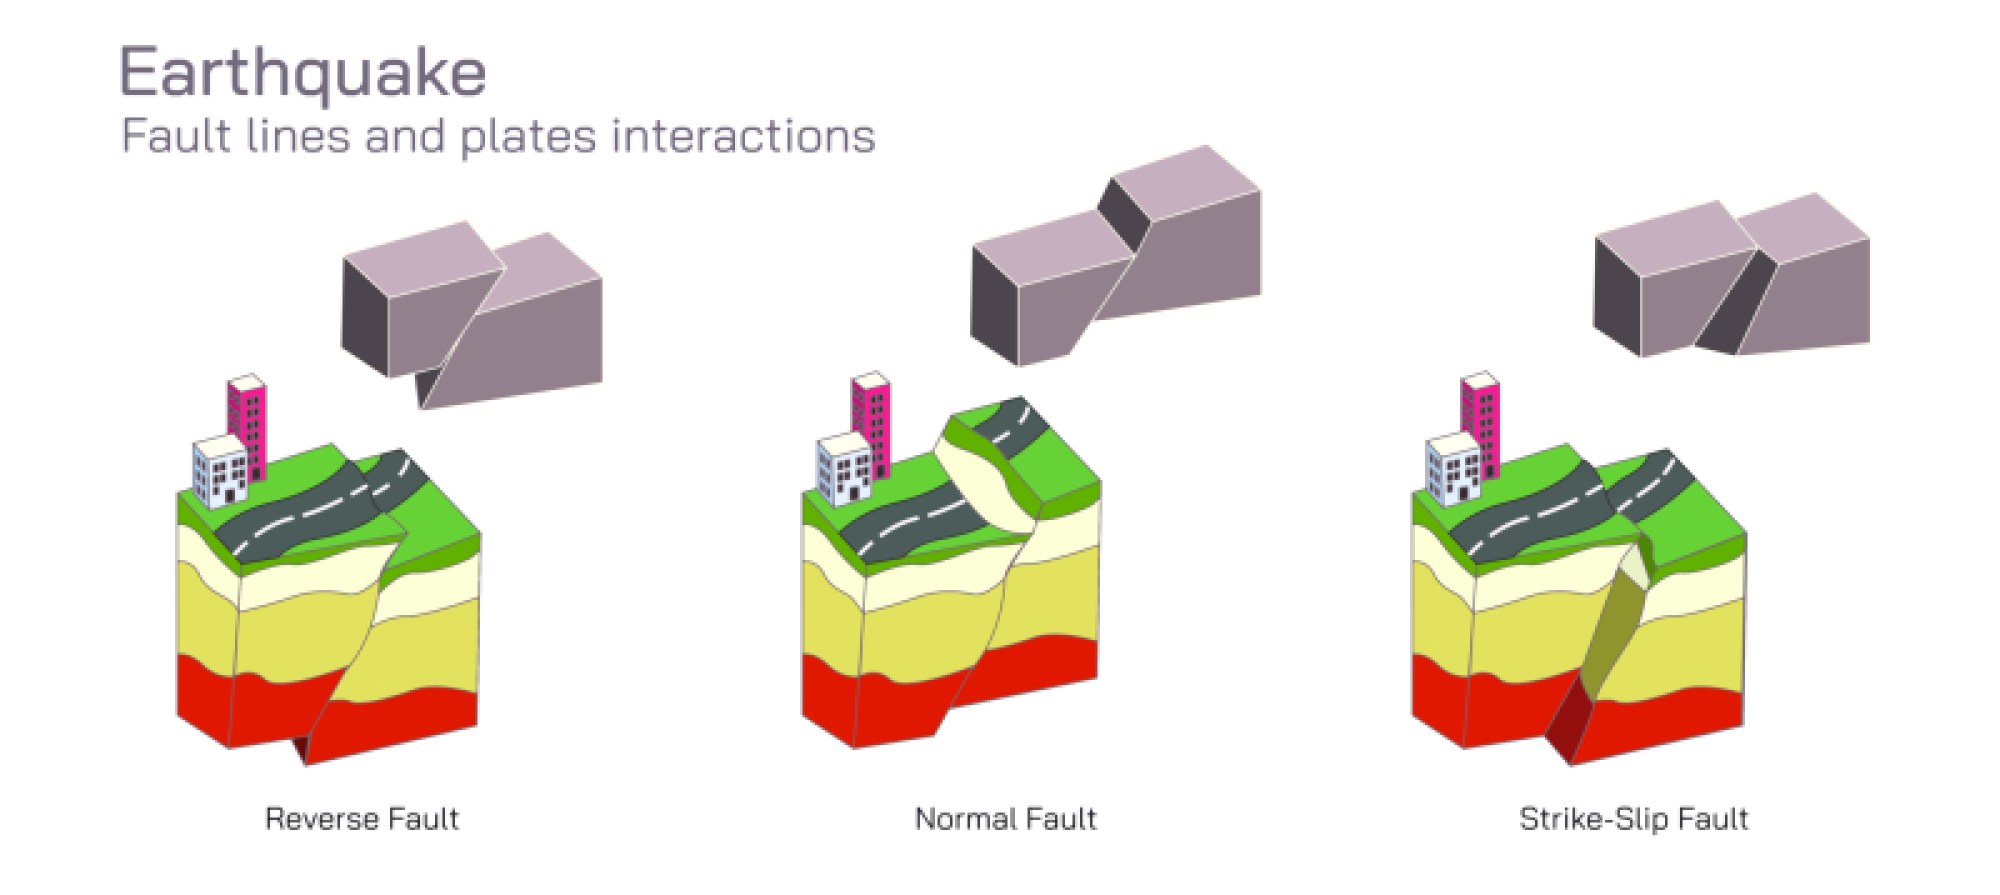
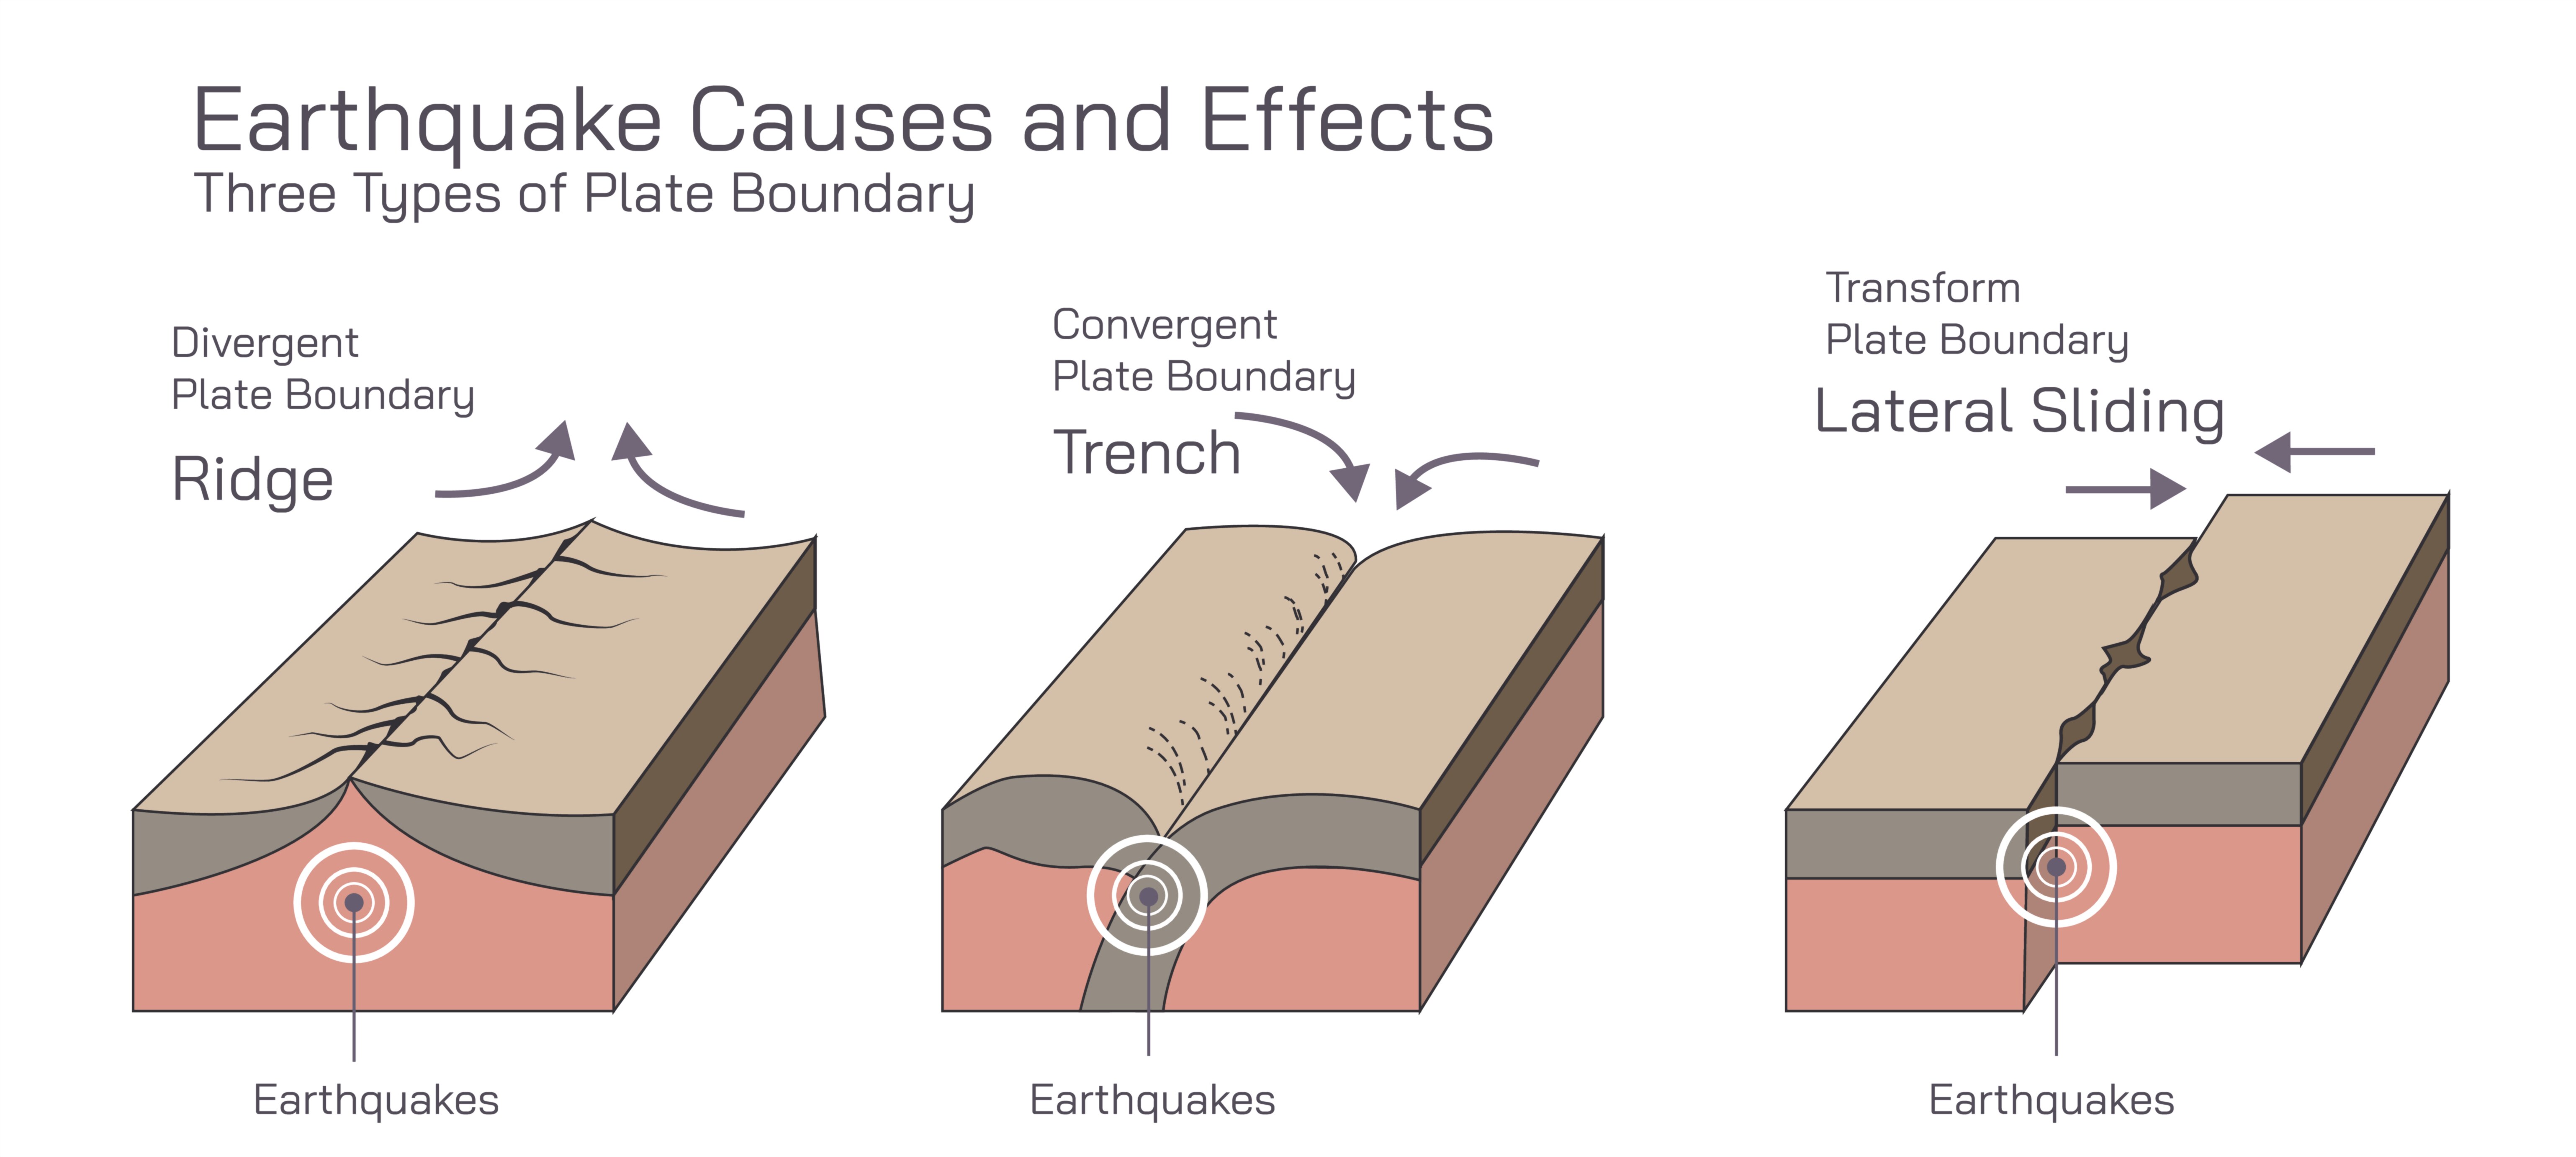
Fault lines are fractures in the Earth’s crust along which tectonic plates or rock masses slide past one another. In an earthquake illustration, these are often represented as bold lines on a cross-section or surface map, showing areas of potential movement. Different fault types—normal, reverse, and strike-slip—produce distinctive motion patterns, which can influence the direction and intensity of ground shaking. By highlighting these fault lines, vector diagrams contextualize the earthquake within the broader tectonic framework, illustrating why certain regions are more prone to seismic activity than others.
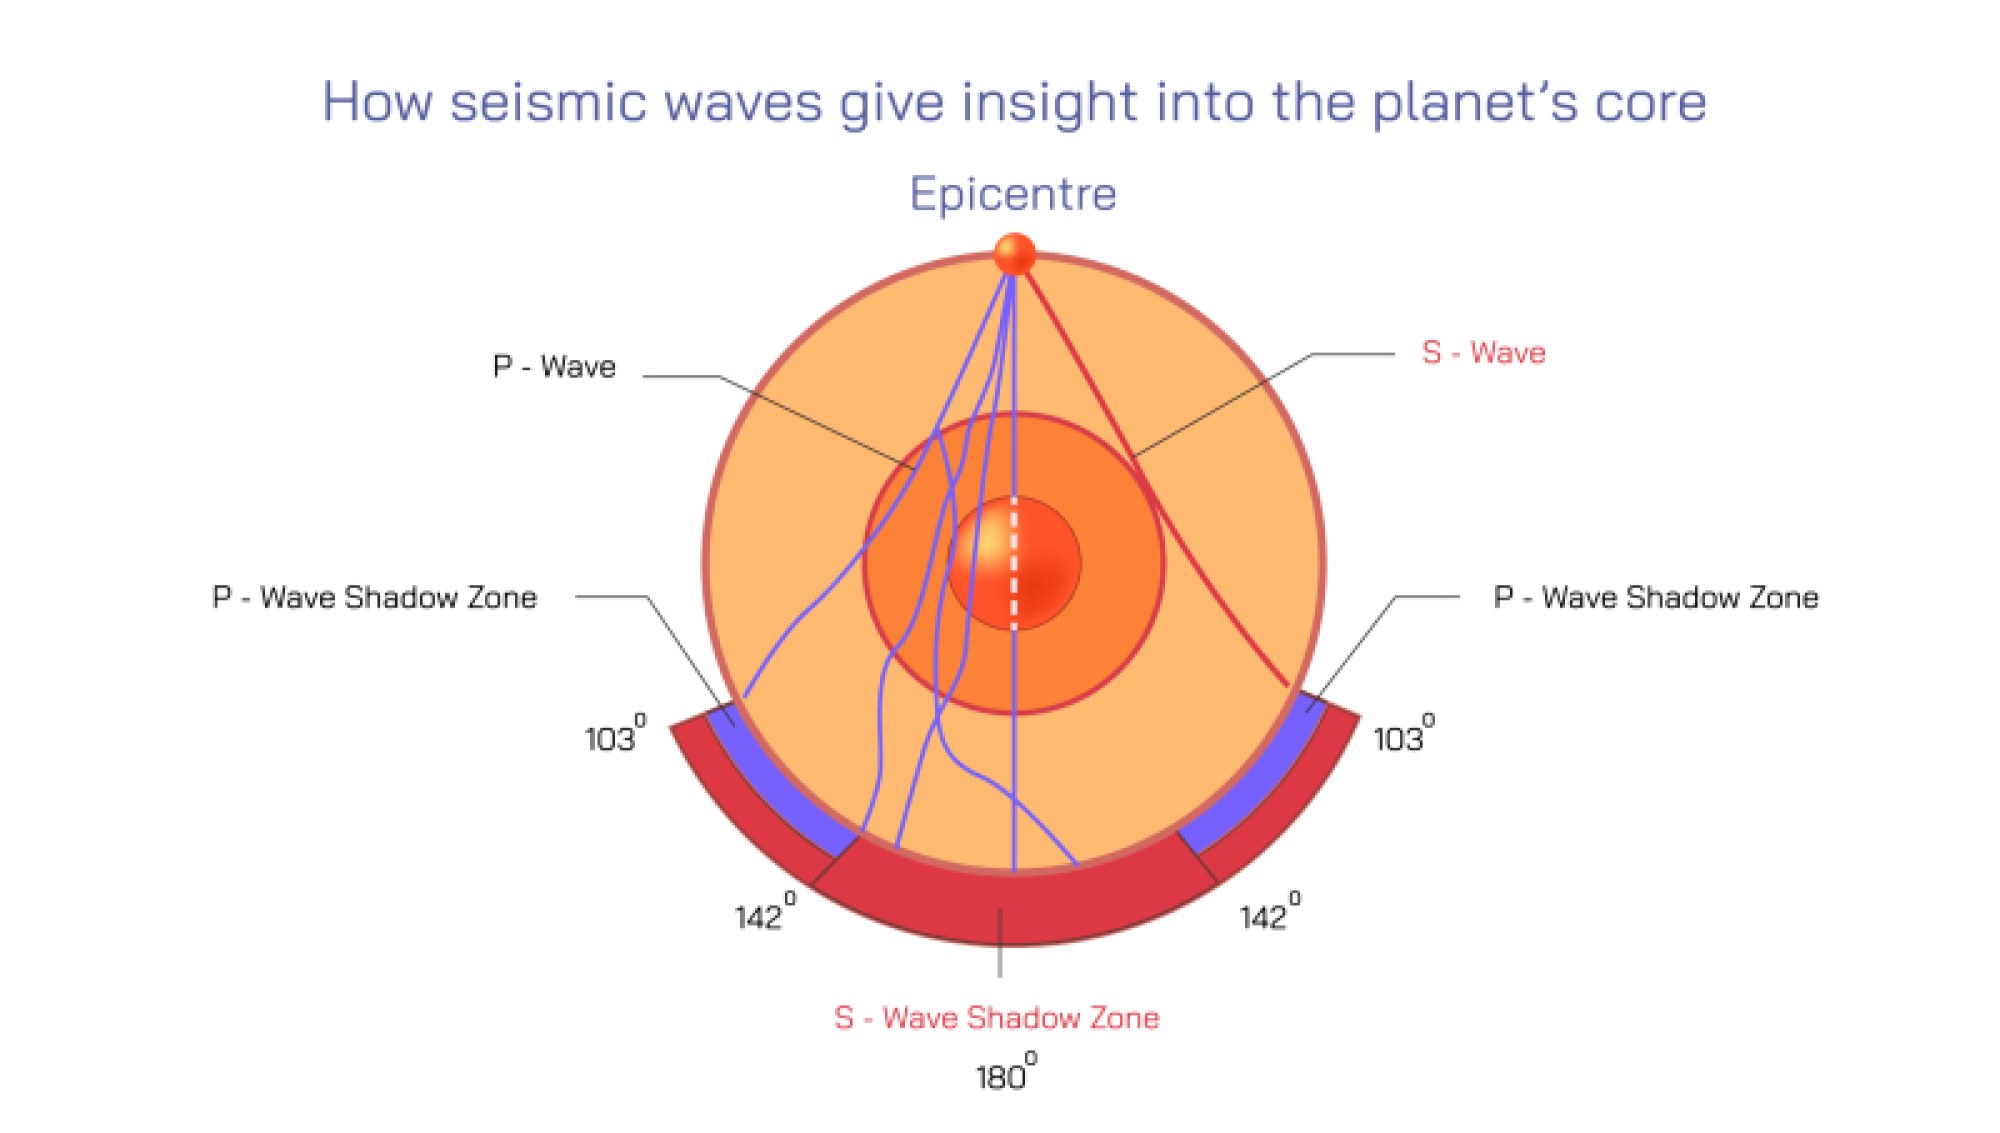
Once an earthquake occurs, seismic waves propagate outward from the focus, transferring energy through the Earth. Vector illustrations typically depict these waves as expanding concentric circles or arcs radiating from the epicenter. There are multiple wave types, each with unique characteristics: Primary (P) waves, which are compressional and travel fastest; Secondary (S) waves, which are shear waves traveling slightly slower; and surface waves, which move along the Earth’s exterior and often cause the most structural damage due to their larger amplitude. The illustration may use different colors or arrow styles to distinguish these wave types and indicate their movement, showing how energy spreads through both the interior and surface layers of the Earth.
Ground vibration patterns are the visual representation of the impact these seismic waves have on the surface. In diagrams, waves can be drawn as sinusoidal undulations along the ground, with amplitude corresponding to the intensity of shaking. These patterns demonstrate how energy diminishes with distance from the epicenter but may be amplified in certain terrains, such as soft soils or sedimentary basins. By representing ground motion, the vector illustration connects abstract seismic energy to the tangible shaking experienced by buildings, infrastructure, and people.
Vector illustrations may also include cross-sectional views of the Earth's crust, showing how the fault slips and the propagation of waves at different depths. This adds a three-dimensional perspective, helping viewers understand that seismic energy does not only travel horizontally but also moves upward and downward, influencing regions far from the epicenter. Labels may identify key geological layers, plate boundaries, or tectonic zones, linking the earthquake event to broader Earth dynamics.
Additionally, intensity and magnitude indicators may be incorporated into the illustration, showing how wave amplitude relates to potential damage. Larger amplitudes near the epicenter illustrate stronger shaking, while the gradual decrease with distance demonstrates energy dispersion. Some diagrams also include arrows indicating the direction of fault movement or lateral displacement, emphasizing the mechanics of tectonic stress release.
Overall, a vector illustration of an earthquake serves multiple educational purposes: it demonstrates where earthquakes originate, how tectonic forces accumulate along faults, how energy is transmitted through the Earth, and how it manifests as ground vibrations affecting the surface. By combining the epicenter, fault lines, seismic wave propagation, and ground vibration patterns in a clear and labeled diagram, such illustrations make an invisible geological process visible, allowing learners and professionals to conceptualize, analyze, and prepare for seismic events effectively.