Diabetes Type One and Type Two Showing Blood Sugar Levels, Insulin Function, and Glucose Regulation
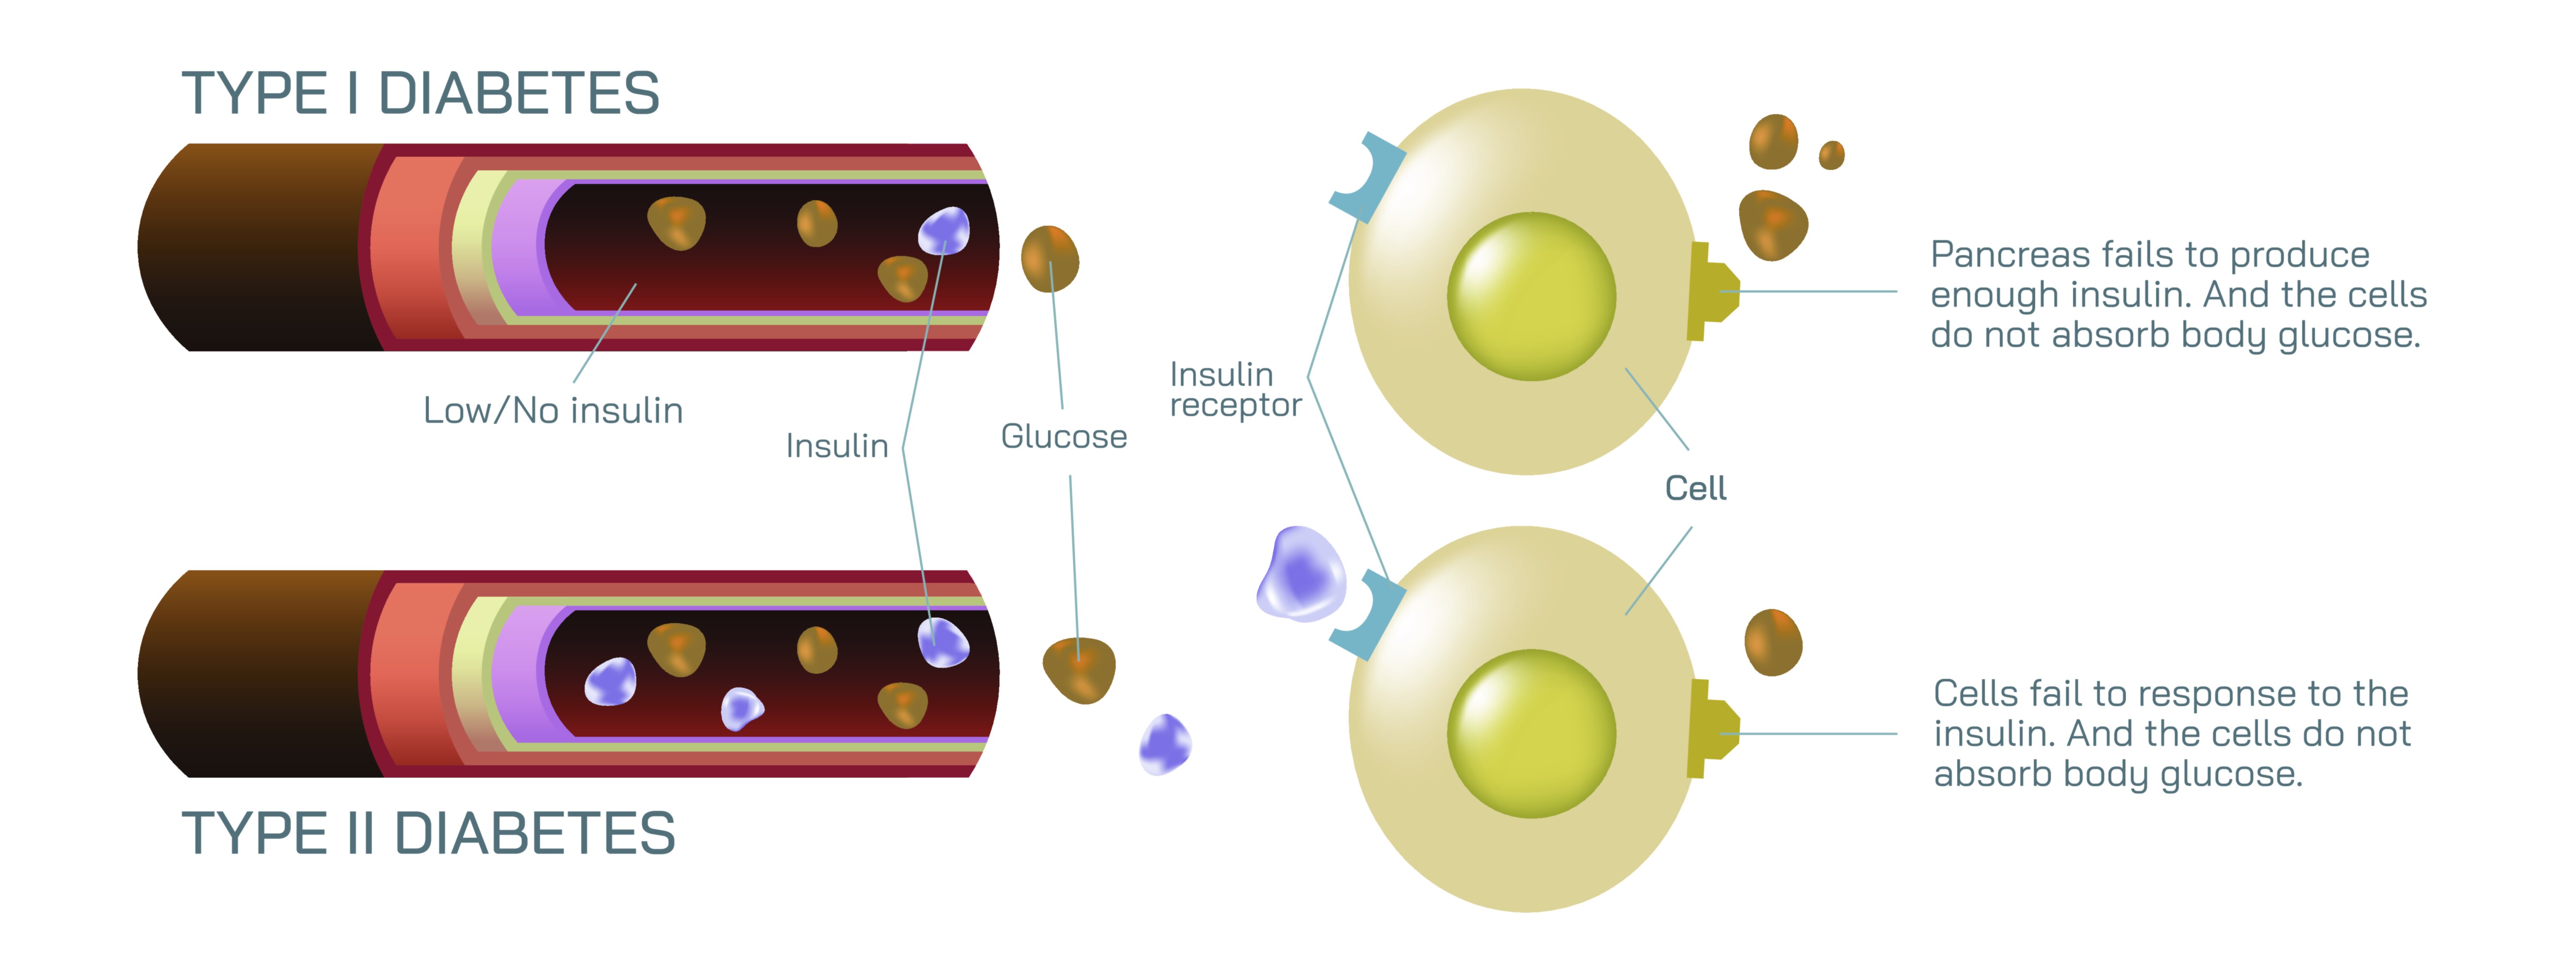
Diabetes mellitus is a metabolic disorder characterized by impaired glucose regulation in the body, with Type One (T1D) and Type Two (T2D) representing the two primary forms. A vector illustration comparing Type One and Type Two diabetes typically highlights differences in blood sugar levels, insulin production and function, and how the body responds to glucose, providing a visual explanation of the physiological mechanisms underlying each condition. Such illustrations help convey complex interactions between the pancreas, insulin, glucose, and body cells in a clear, educational format suitable for both medical study and public health awareness.
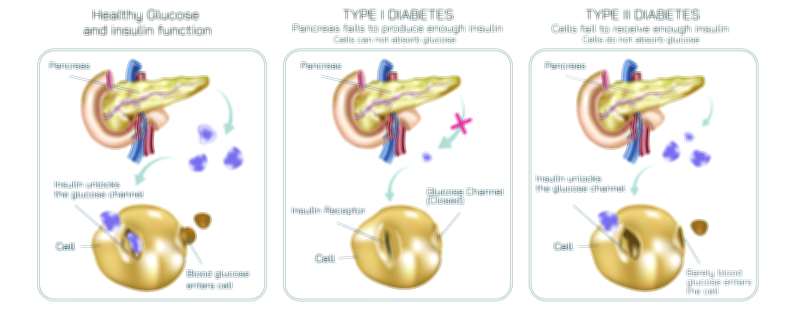
In Type One diabetes, the pancreas’s beta cells are damaged or destroyed, often due to an autoimmune response. This results in little to no insulin production. In a vector diagram, the pancreatic islets are depicted with absent or reduced insulin signaling, while glucose molecules accumulate in the bloodstream. Blood sugar levels remain elevated because glucose cannot efficiently enter muscle, liver, or fat cells without insulin acting as a key. The illustration often shows glucose circulating freely, unable to be transported into cells, leading to hyperglycemia. Additional annotations may indicate symptoms such as excessive thirst, frequent urination, fatigue, and unintended weight loss, which result from cells being starved of energy despite abundant circulating glucose. In essence, Type One diabetes is primarily a deficiency in insulin production, making external insulin administration essential for glucose regulation.
Type Two diabetes, in contrast, is primarily associated with insulin resistance, where the body’s cells do not respond effectively to insulin. In a vector illustration, insulin molecules are shown being secreted by the pancreas but struggling to facilitate glucose uptake into target cells. The pancreas may initially compensate by producing higher insulin levels, but over time, this can lead to pancreatic beta-cell dysfunction and eventual decreased insulin production. The diagram may depict glucose levels as moderately elevated initially and significantly elevated in advanced stages. Unlike Type One, lifestyle factors such as diet, exercise, and body weight play a more significant role in Type Two diabetes, and management may include medications that improve insulin sensitivity, along with dietary and physical interventions.
A comprehensive vector illustration will typically compare the two types side by side:
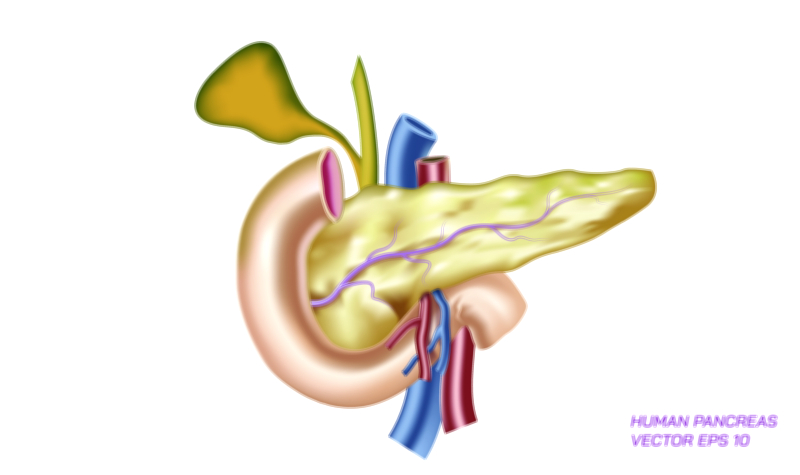
Pancreas depiction: showing beta cells destroyed in Type One versus partially functional but stressed beta cells in Type Two
Insulin pathway: showing the absence of insulin in Type One and the ineffective action of insulin in Type Two
Blood glucose levels: indicating chronic hyperglycemia in both types, but with different underlying causes
Cellular uptake: demonstrating how glucose enters cells under normal conditions versus being blocked or reduced in diabetes
Symptoms or consequences: optionally including visual cues like thirst, fatigue, or complications in long-term diabetes
The illustration may also integrate the concept of glucose regulation under normal physiology for comparison. In a healthy system, after a meal, elevated blood sugar triggers insulin release from pancreatic beta cells. Insulin binds to receptors on muscle, liver, and adipose cells, allowing glucose uptake and storage, reducing blood sugar levels to a balanced range. Type One diabetes interrupts this process at the production level, while Type Two disrupts the signaling pathway at the receptor level. By showing these contrasts visually, the diagram educates the viewer on both the mechanisms and consequences of impaired glucose regulation.
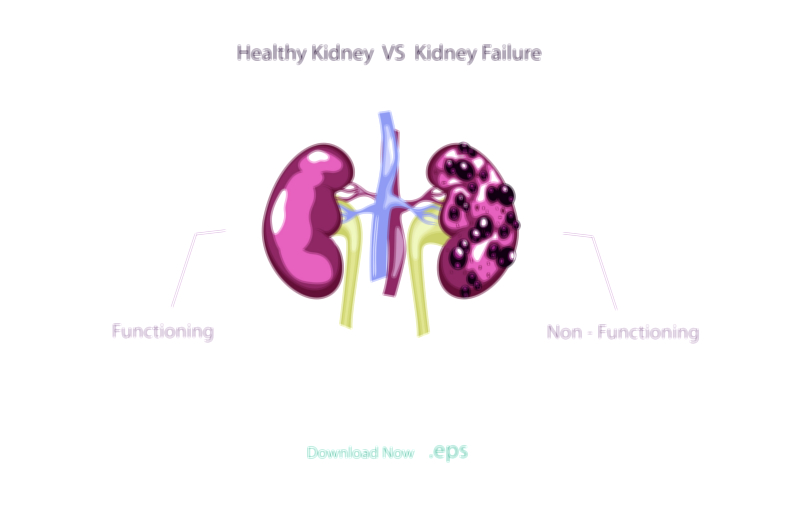
In addition, vector illustrations often highlight long-term consequences of poor glucose control, including cardiovascular complications, neuropathy, kidney disease, and retinopathy. Elevated blood sugar levels over time damage blood vessels and nerves, a concept sometimes represented through color-coded vessels or organ depictions to indicate areas susceptible to complications.
Overall, a vector illustration of Type One and Type Two diabetes conveys a multi-layered story: the disruption of insulin production or action, the resultant hyperglycemia, and the downstream effects on cells and organs. By visually contrasting these two types, the diagram provides a clear, educational view of how each form of diabetes impacts the body’s ability to regulate glucose and why management strategies differ between them.