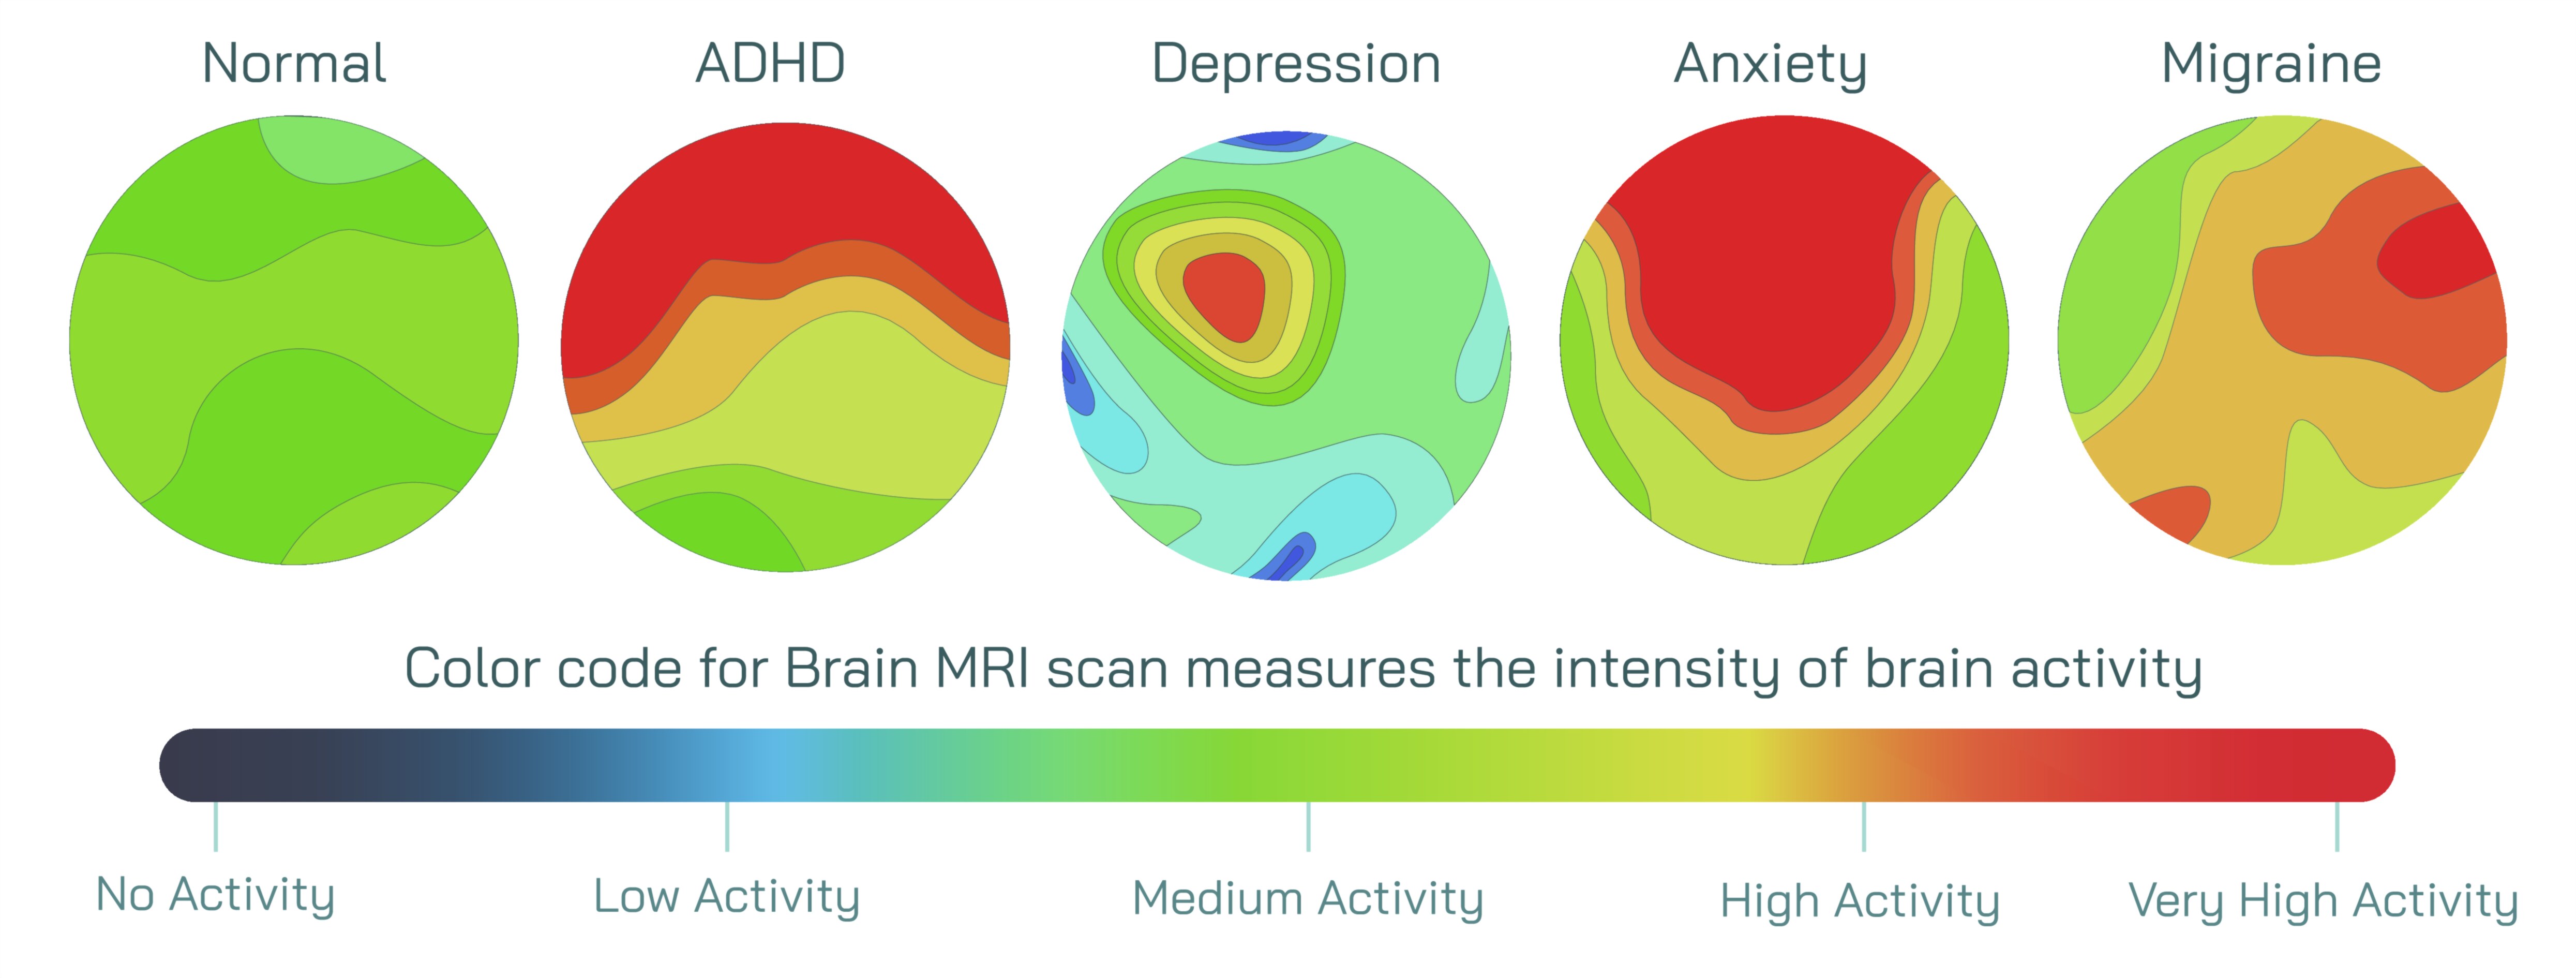
Brain MRI Color Codes Showing Normal, ADHD, Anxiety, Depression, and Migraine Patterns in the Human Brain
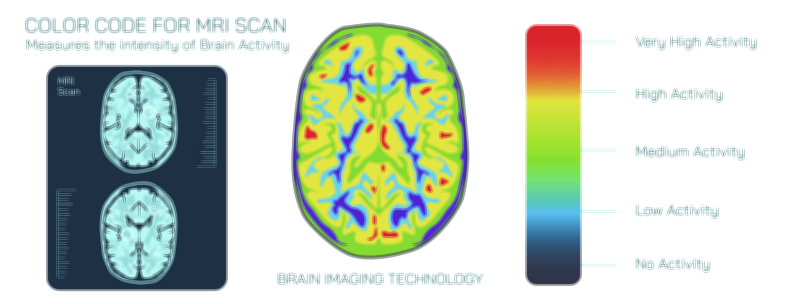
Brain MRI color-coded scans are one of the most visually powerful ways to understand how neurological and psychological conditions influence brain activity. Although MRI itself detects structural information using magnetic fields and radio waves, advanced functional imaging techniques — such as fMRI, PET, and SPECT — apply color maps to represent differences in brain metabolism, blood flow, and electrical activation. In a color-coded brain imaging illustration, each region of the brain is overlaid with warm or cool colors depending on whether activity is increased, decreased, or normal. This provides an intuitive representation of patterns that would otherwise remain hidden deep within the tissue. When such a diagram compares a normal brain with those showing patterns associated with ADHD, anxiety, depression, and migraine, it helps clarify how different disorders alter communication between neural networks, even when the anatomy itself looks normal on a standard MRI. Rather than focusing on damage or lesions, these scans focus on how actively the brain is working, revealing distinct patterns of hyperactivity, hypoactivity, or dysregulated activation that contribute to symptoms.
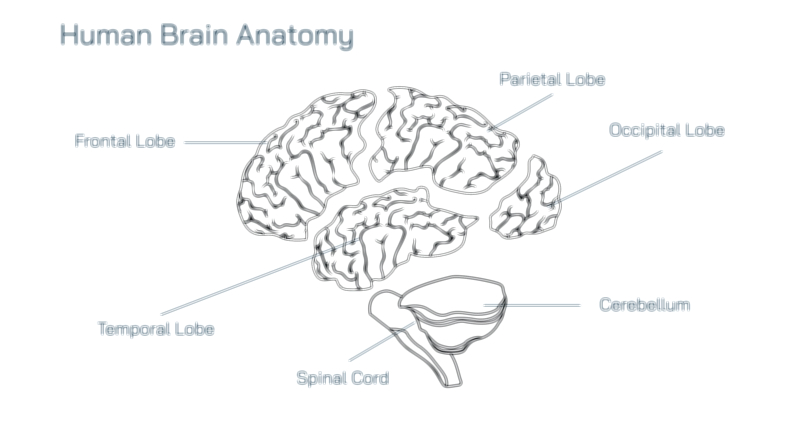
In a normal brain MRI color map, activity is generally balanced — regions responsible for cognition, sensory processing, emotion, motor control, and decision-making show consistent levels of metabolic function. The frontal lobe, parietal lobe, temporal lobe, occipital lobe, limbic system, and brainstem maintain a synchronized pattern in which no single region is excessively dominant or unusually suppressed. The color distribution in such scans is typically even and symmetrical across both hemispheres, representing healthy blood flow and uniform communication between neural networks. A normal scan does not mean every region is equally active at every moment — the brain constantly shifts energy depending on tasks — but it shows that networks can upregulate and downregulate efficiently. Emotional regulation, memory, attention, movement, and sensory perception work in harmony because the underlying brain activity levels are appropriately modulated. This balanced color pattern acts as the baseline against which other conditions are compared.
In contrast, images associated with ADHD (Attention-Deficit/Hyperactivity Disorder) often show lower-than-normal activation in regions responsible for focus, impulse control, planning, and sustained attention. The prefrontal cortex, particularly the dorsolateral and orbitofrontal areas, may appear in cooler colors indicating underactivation. The basal ganglia and anterior cingulate cortex, which regulate motivation, reward anticipation, and behavioral prioritization, may also show decreased metabolic activity in ADHD patterns. Although ADHD symptoms appear behaviorally as restlessness or distractibility, the underlying mechanism frequently involves difficulty activating and maintaining the brain circuits that support focus, task persistence, and impulse inhibition. Because the brain works harder to maintain attention when the required circuits are underactive, color-coded scans sometimes show compensatory overactivity in regions unrelated to the task at hand. These illustrations demonstrate that ADHD is not simply a lack of discipline but a measurable pattern of neurological activation in self-regulation networks.
Color maps representing anxiety usually display the opposite pattern — rather than underactivation, anxiety states are marked by persistent hyperactivity in the amygdala and other fear-processing regions of the limbic system. The insula, responsible for internal bodily awareness, may also appear brightly colored, reflecting heightened sensitivity to physical sensations. Meanwhile, overactivation in the anterior cingulate cortex may contribute to worry, overthinking, and difficulty disengaging from perceived threats. Some areas of the prefrontal cortex may attempt to regulate these emotional responses, but when limbic overactivity dominates, the frontal lobes struggle to suppress excessive fear signals. The resulting color distribution highlights the imbalance: emotional survival circuits are constantly “switched on,” diverting energy from cognitive focus and relaxation. Thus, anxiety is not simply a psychological feeling — it corresponds to measurable hyperactivation in brain regions designed to detect and respond to danger.
Color-coded patterns for depression present a different configuration, where underactivity becomes the defining feature. Many depression scans show reduced activation in the frontal lobes, especially in the dorsolateral prefrontal cortex responsible for motivation, executive planning, and goal-directed behavior. The limbic system — including the hippocampus, amygdala, and associated emotional networks — may show irregular patterns either of suppression or inconsistent bursts of activation. The anterior cingulate cortex and reward pathways are often subdued, correlating with lack of pleasure, fatigue, hopelessness, and emotional numbing. In some cases, the default mode network may be overactive, linking to excessive rumination and self-critical thinking. What stands out visually is the predominance of cool colors across areas responsible for emotional regulation and motivation. Depression therefore appears not as a failure of will but as a global reduction in energy allocation to life-supporting neural circuits, a biological explanation for why effort feels overwhelming and activities lose joy.
Migraine-related brain activity produces yet another distinctive pattern, often characterized by episodic abnormalities rather than constant activation. During a migraine attack, color-coded imaging frequently shows hyperexcitability and heightened blood flow in the visual cortex of the occipital lobe, explaining why many patients experience visual aura, light sensitivity, or shimmering distortions. The trigeminovascular system and pain pathways in the brainstem and thalamus may also show elevated activity, linking to head pain, nausea, and autonomic symptoms. In some individuals, spreading cortical waves of alternating overactivity and underactivity propagate across the brain surface, creating fluctuating color patterns. Outside of acute episodes, some migraine brains demonstrate hypersensitive sensory networks that overreact to external stimuli such as light, noise, smell, or stress triggers. This illustrates that migraine is not simply a vascular headache but a neurological disorder shaped by abnormal sensory processing and amplified pain signaling.
When all five MRI-style color maps — normal, ADHD, anxiety, depression, and migraine — appear side by side, the comparison communicates an important truth: brain-based conditions are rooted in identifiable patterns of neural activation, not personal weakness or poor lifestyle choices. Each condition corresponds to a distinct relationship between overactive and underactive networks. ADHD displays challenges in maintaining activation of frontal executive circuits. Anxiety reveals excessive activation in limbic fear circuitry. Depression shows a global drop in activity across motivation and emotion networks. Migraine presents a unique sensory hyperexcitability pattern centered around visual, pain, and brainstem pathways. Even though symptoms are expressed psychologically or behaviorally, the underlying mechanisms reflect neurobiology, not personality.
A vector illustration that maps these color-coded differences provides more than visual learning — it teaches how interconnected mental health, neurochemistry, cognition, and sensory processing truly are. It also underscores why treatment approaches vary between conditions. ADHD therapies often aim to increase frontal activation; anxiety interventions teach limbic downregulation; depression treatments focus on revitalizing underactive reward networks; migraine management targets sensory overexcitation and pain pathways. Many modern therapies — including behavioral techniques, medication, neuromodulation, and lifestyle strategies — succeed because they modify these exact circuits. The brain is adaptable through neuroplasticity, meaning that activation patterns can change over time when the brain is given support, stimulation, and recovery.
Ultimately, MRI color-coded brain mapping illustrates the incredible precision of the human nervous system. What we experience psychologically reflects measurable physiology. The scanning patterns do not judge or diagnose on their own, but they make the invisible visible: every emotion, thought, sensation, and symptom corresponds to the activity of networks shaped by biology, experience, and environment. The illustration comparing normal activation to ADHD, anxiety, depression, and migraine patterns therefore serves as both a scientific explanation and a human reminder — the brain is not simply an organ; it is the foundation of perception, identity, and lived experience, and its activation patterns tell a profound story about how the mind and body are connected.