Dispersion in Light Showing Spectrum Separation, Prism Refraction, and Wavelength Deviation in Physics
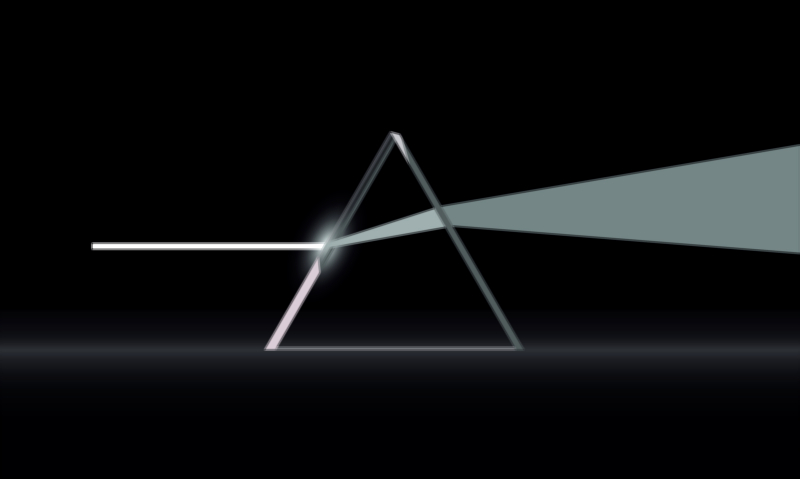
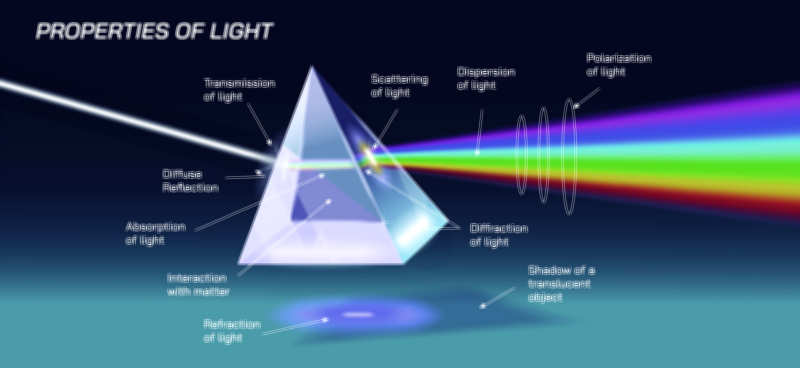
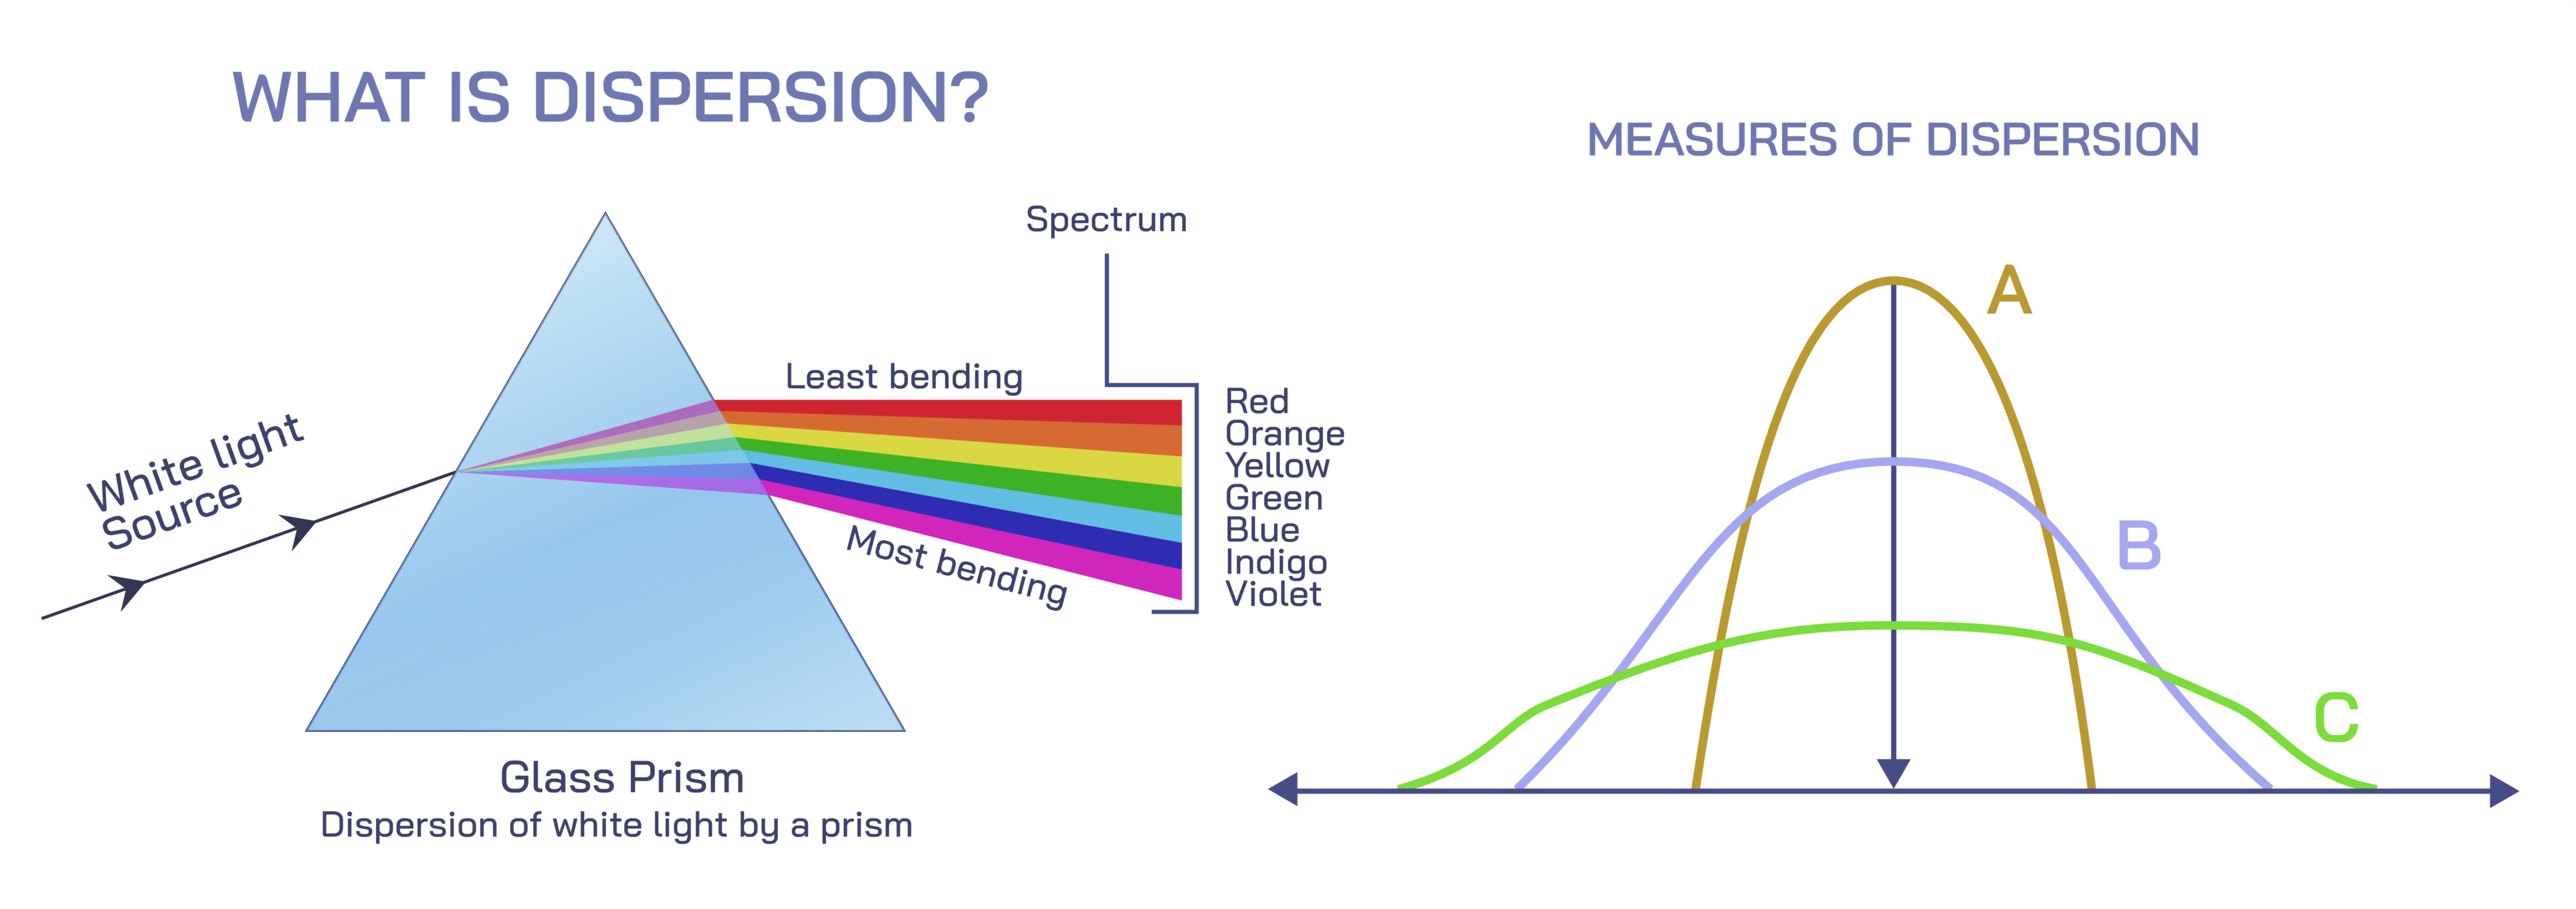
Dispersion is one of the most visually captivating and scientifically revealing phenomena in optics, demonstrating how white light—which appears uniform to the human eye—is actually a blend of many different colors with distinct wavelengths. When a beam of white light passes through a prism, it spreads into a multicolored spectrum ranging from deep violet to bright red. A vector illustration of dispersion vividly captures this breakup of light by showing how a single incoming ray bends as it enters and exits the prism, splitting into multiple rays of different wavelengths that emerge at different angles. Although the separation appears artistic and fluid in illustrations, it reflects a precise physical process governed by the interaction between light waves and the optical density of the material.
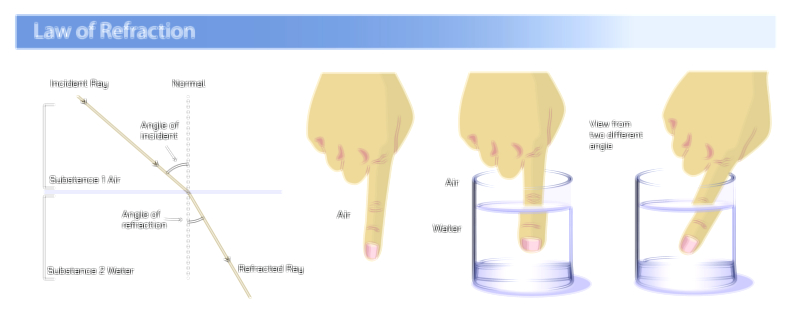
The first step in dispersion is refraction, the bending of light when it moves from one medium into another — in this case, from air into glass or another transparent material. Light slows down as it enters the denser medium, and the change in speed forces the beam to alter its direction. In ordinary refraction diagrams, a single ray bends uniformly, but dispersion reveals that not all colors of light bend equally. The refractive index of the prism varies slightly with wavelength, meaning that shorter wavelengths (violet and blue) experience stronger refraction and bend more sharply, while longer wavelengths (red and orange) bend less. When illustrated, this difference is shown by a fan-like separation of emerging rays, spreading red at the upper edge of the beam and violet at the lower edge, with the other colors arranged in between.
White light is made up of a continuous spectrum of wavelengths, and dispersion provides a visual map of that internal structure. Each color within white light corresponds to a specific wavelength range — violet at the shortest and red at the longest. When the beam travels through air, the wavelengths overlap perfectly, so the light looks white. Inside the prism, each wavelength slows differently, shifting the direction of its path differently. Illustrations emphasize this wavelength-dependent deviation by labeling the spectrum or coloring the paths separately, showing that dispersion results not from splitting light apart mechanically but from letting each wavelength reveal its natural trajectory.
The bending of light occurs twice: once as the beam enters the prism and again as it exits into the air. Both surfaces contribute to the spreading of the spectrum. The triangular shape of a prism enhances this effect, since the angled exit face increases the spread of the colors after they have already been separated to some degree inside the glass. A typical vector diagram displays:
• A single white light beam striking the prism face
• Refraction of the light inside the prism
• Emerging rays separating into red, orange, yellow, green, blue, indigo, and violet
• Diverging directions illustrating wavelength-based angular deviation
Even though prisms are the classic example of dispersion, this behavior occurs in many natural settings. Rainbows form when sunlight enters millions of water droplets in the atmosphere, each acting like tiny prisms. The internal reflection and refraction within droplets disperse sunlight into colored arcs. Haloes around the sun or moon, soap bubbles, diamond brilliance, and iridescent minerals also demonstrate dispersion, all rooted in tiny variations in how materials refract different wavelengths. Illustrations that include multiple media help viewers understand that dispersion does not require a prism — only a medium whose refractive index depends on wavelength.
Dispersion plays a significant role in physics, technology, and optical engineering. In optical fibers and telecommunications, dispersion affects how pulses of light spread, influencing signal clarity. In spectroscopy, dispersion allows scientists to analyze the chemical composition of stars, gases, and unknown substances by reading their wavelength signatures. Even the design of high-performance camera lenses and telescopes must account for dispersion because uncontrolled separation of colors creates chromatic aberration, a distortion where images display colored fringes. Engineers compensate for this using compound lens systems that realign wavelengths, counteracting dispersion effects.
The beauty of dispersion lies in the fact that it reveals something hidden — the composition of white light. Even though the human eye perceives white as a single unified color, the prism demonstrates that white is actually a harmony of wavelengths that separate only when refracted differently. This discovery, famously studied by Isaac Newton, changed scientific understanding of light and laid the foundation for modern optics.
A complete vector illustration of dispersion communicates these ideas visually and intuitively. It captures the incoming beam of white light, the prism refraction process, the fanning-out of rays that form the spectrum, and the order of colors arranged by wavelength. Without equations or mathematical expressions, it conveys the central lesson that different wavelengths of light behave differently when passing through materials — a simple geometric arrangement that unveils a profound physical truth.
Through the combination of spectrum separation, prism refraction, and wavelength deviation, dispersion becomes not just a scientific event but a gateway to understanding the true nature of light.