Acidic and Alkaline Showing pH Scale, Chemical Balance, and Difference Between Acids and Bases
The concepts of acidity and alkalinity form one of the most foundational frameworks in chemistry, biology, environmental science, and medicine, because the balance between acids and bases influences everything from digestion and metabolic function to soil fertility and industrial reactions. A clear illustration showing acidic and alkaline substances along the pH scale, together with chemical balance and the differences between acids and bases, provides an intuitive pathway for understanding a topic that otherwise hides behind numbers and formulas. At the simplest level, the pH scale measures how acidic or alkaline a substance is, but its role extends much further: it reveals the degree of hydrogen ion concentration (H⁺) in a solution and therefore reflects how substances interact chemically. Visualizing this through a color-based pH bar and molecular diagrams allows the viewer to connect numerical values with real-world behavior and everyday substances.
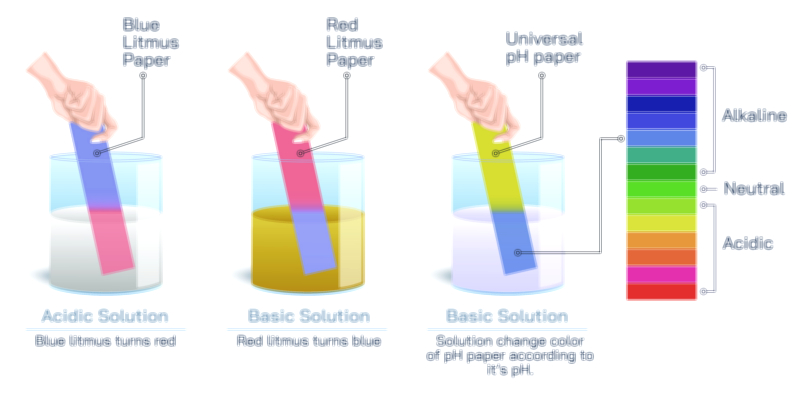
The pH scale ranges from 0 to 14, with the central value of 7 representing neutrality. Pure water sits near this central point because the concentrations of hydrogen ions (H⁺) and hydroxide ions (OH⁻) in it are balanced. When a solution has more hydrogen ions than hydroxide ions, its pH drops below 7 and it becomes acidic. When a solution has more hydroxide ions than hydrogen ions, its pH rises above 7 and becomes alkaline or basic. This shift in ion ratio—rather than a rigid label—is what defines the identity of a solution. A vector illustration that moves from deep red (strong acids) at the low end of the scale to deep blue or violet (strong bases) at the high end visually reinforces the chemical gradient from high H⁺ concentration to high OH⁻ concentration. This visual transformation mirrors the invisible shift occurring at the molecular level.
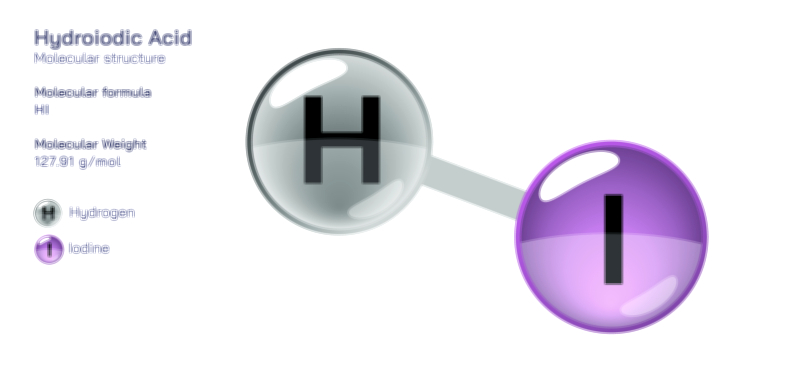
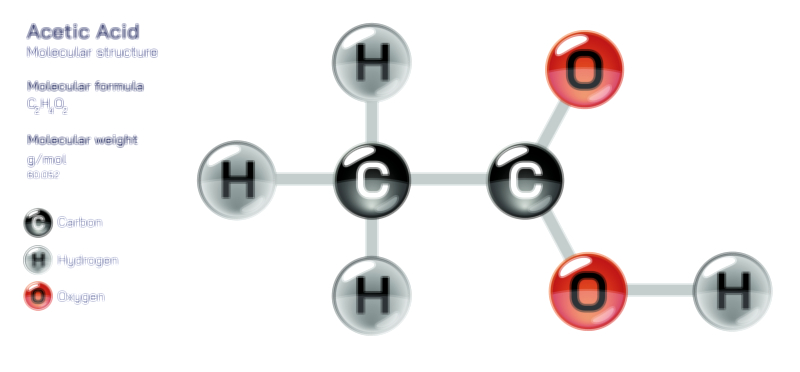
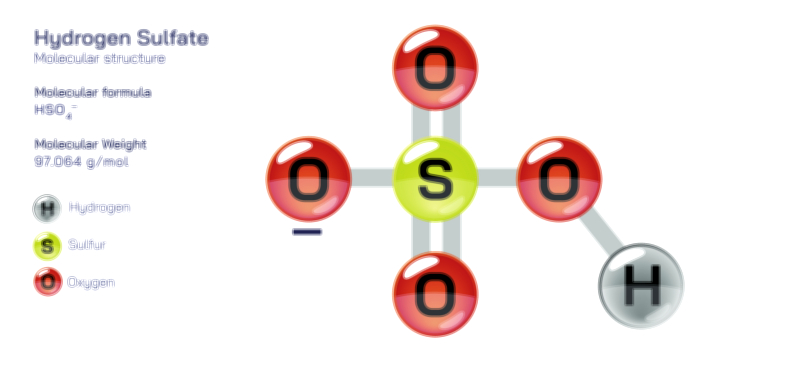
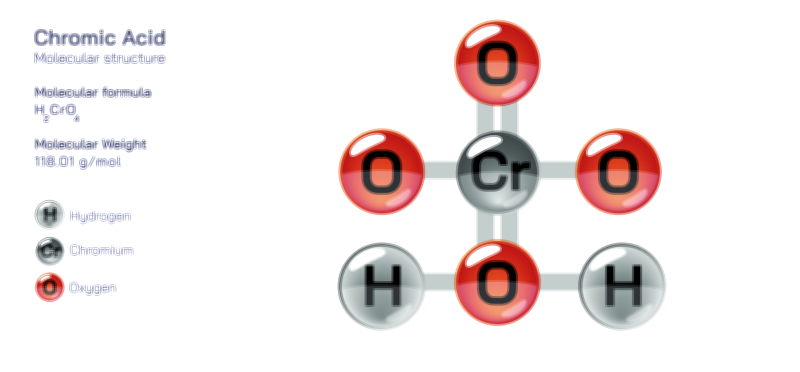
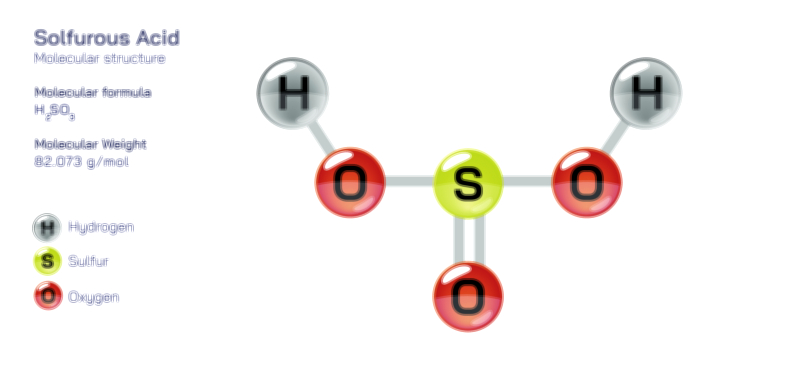
Acids are substances that donate hydrogen ions (H⁺) in aqueous solutions. Their reactive nature can be felt in everyday life, even before the science is formally introduced. Substances such as lemon juice, vinegar, and gastric acid all produce characteristic sour flavor and corrosive reactivity because the hydrogen ions they release interact readily with surrounding molecules. At the industrial level, acids like sulfuric acid and hydrochloric acid exhibit high reactivity and are used to dissolve metals, catalyze reactions, and refine materials. In vector illustrations of acidic behavior, hydrogen ions radiate from the chemical structure to show the tendency toward H⁺ donation. This graphical emphasis on active hydrogen transfer demystifies why acids drive specific reactions and why they function so widely across chemical processes and biological systems.
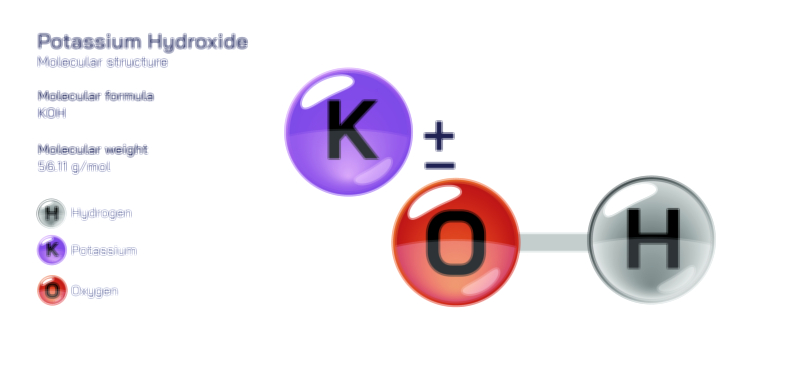
Alkaline or basic substances demonstrate the opposite ionic tendency. They accept hydrogen ions or release hydroxide ions (OH⁻), giving them properties such as bitterness, slippery texture, and the ability to neutralize acids. Baking soda, soap, and ammonia represent familiar everyday bases, while sodium hydroxide and potassium hydroxide are industrial-strength examples that can break down organic matter and catalyze large-scale reactions. In a visual representation, hydroxide ion transfer is often shown emerging from the molecular base, emphasizing how it interacts with and neutralizes excess hydrogen ions from acidic substances. The relationship becomes physically meaningful: acids introduce hydrogen ions, bases remove them, and the reaction between the two leads to balance rather than competition.
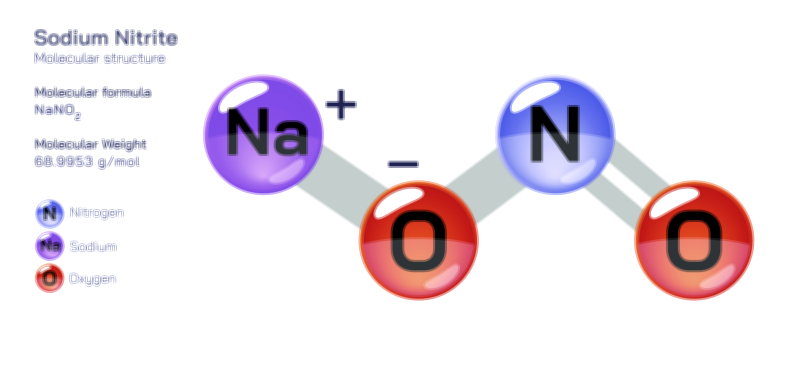
The central concept tying acids and bases together is chemical balance. When an acid and a base mix in the right proportions, their opposite ionic tendencies neutralize one another, producing water and a salt. This process is called neutralization, and its visual representation often includes hydrogen ions meeting hydroxide ions to create a stable water molecule. This transformation creates a powerful metaphor—the pH scale is not a battlefield where acids and bases fight, but a spectrum that shows how their interaction determines chemical stability. Neutralization underpins key everyday processes: the human stomach neutralizes food acidity during digestion, antacids relieve heartburn by buffering excess acid, water treatment facilities adjust pH to ensure safety, and agriculture uses lime to reduce soil acidity and improve crop health.
The illustration becomes even more meaningful when connected to biological systems. The human body controls pH tightly across blood, tissues, and organs because even small deviations can disrupt vital processes. Blood remains slightly alkaline near pH 7.4 to ensure that oxygen transport, enzyme activity, and metabolism perform correctly. The stomach, on the other hand, maintains very low pH values to enable digestion and protect against bacteria. These contrasting microenvironments remind learners that acidity and alkalinity are not universally good or bad—each has a purpose depending on context. The pH scale diagram with physiological markers offers clarity for those trying to connect chemical principles to human health.
In environmental contexts, pH plays a defining role in soil chemistry, aquatic life, and ecosystem balance. Soil that is too acidic limits nutrient absorption in plants, whereas alkaline soil can restrict mineral availability. In rivers and lakes, slight shifts in pH can determine whether aquatic organisms survive or perish. Visual representation of ecosystems across the pH spectrum helps reinforce that acidity and alkalinity exist not only in laboratory settings but across the natural world.
Comparing acids and bases side by side completes the conceptual picture. Acids exhibit sour taste, corrosive properties, red litmus reaction, and the ability to donate hydrogen ions. Bases show bitter taste, slippery feel, blue litmus reaction, and the ability to accept hydrogen ions or release hydroxide ions. When placed on either side of a central neutral zone, their traits appear less like isolated facts and more like complementary halves of a larger chemical system. Vector illustrations that include arrows showing movement toward or away from balance help learners visualize why both substances matter: too much acidity or too much alkalinity creates instability, but controlled variation is essential for function.
By displaying the wave of color along the pH scale, symbols for hydrogen and hydroxide ions, molecular reactions, and examples of common substances, an educational illustration turns a topic that may initially seem abstract into a concrete and intuitive system. It shows that acids and bases are not random classifications but predictable behaviors based on ion concentration and ionic exchange. It explains why pH values describe chemistry without needing equations, why chemical balance prevents corrosion or biological damage, and why understanding both ends of the pH scale is required to make sense of environmental patterns, industrial processes, and physiological regulation.
Ultimately, a vector illustration of acidic and alkaline substances showing the pH scale, chemical balance, and differences between acids and bases does more than contrast two groups of substances. It tells the underlying story of molecular interaction and equilibrium: acids raise hydrogen ions, bases reduce them, and the pH scale records the dynamic tension between the two. By placing chemistry, biology, health, industry, and nature on the same interpretive scale, it empowers learners to understand acidity and alkalinity not as isolated definitions but as a universal chemical language that describes how matter behaves, reacts, and sustains life.