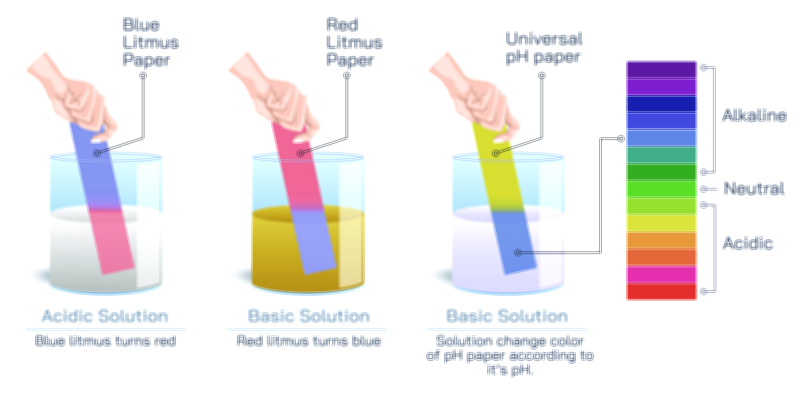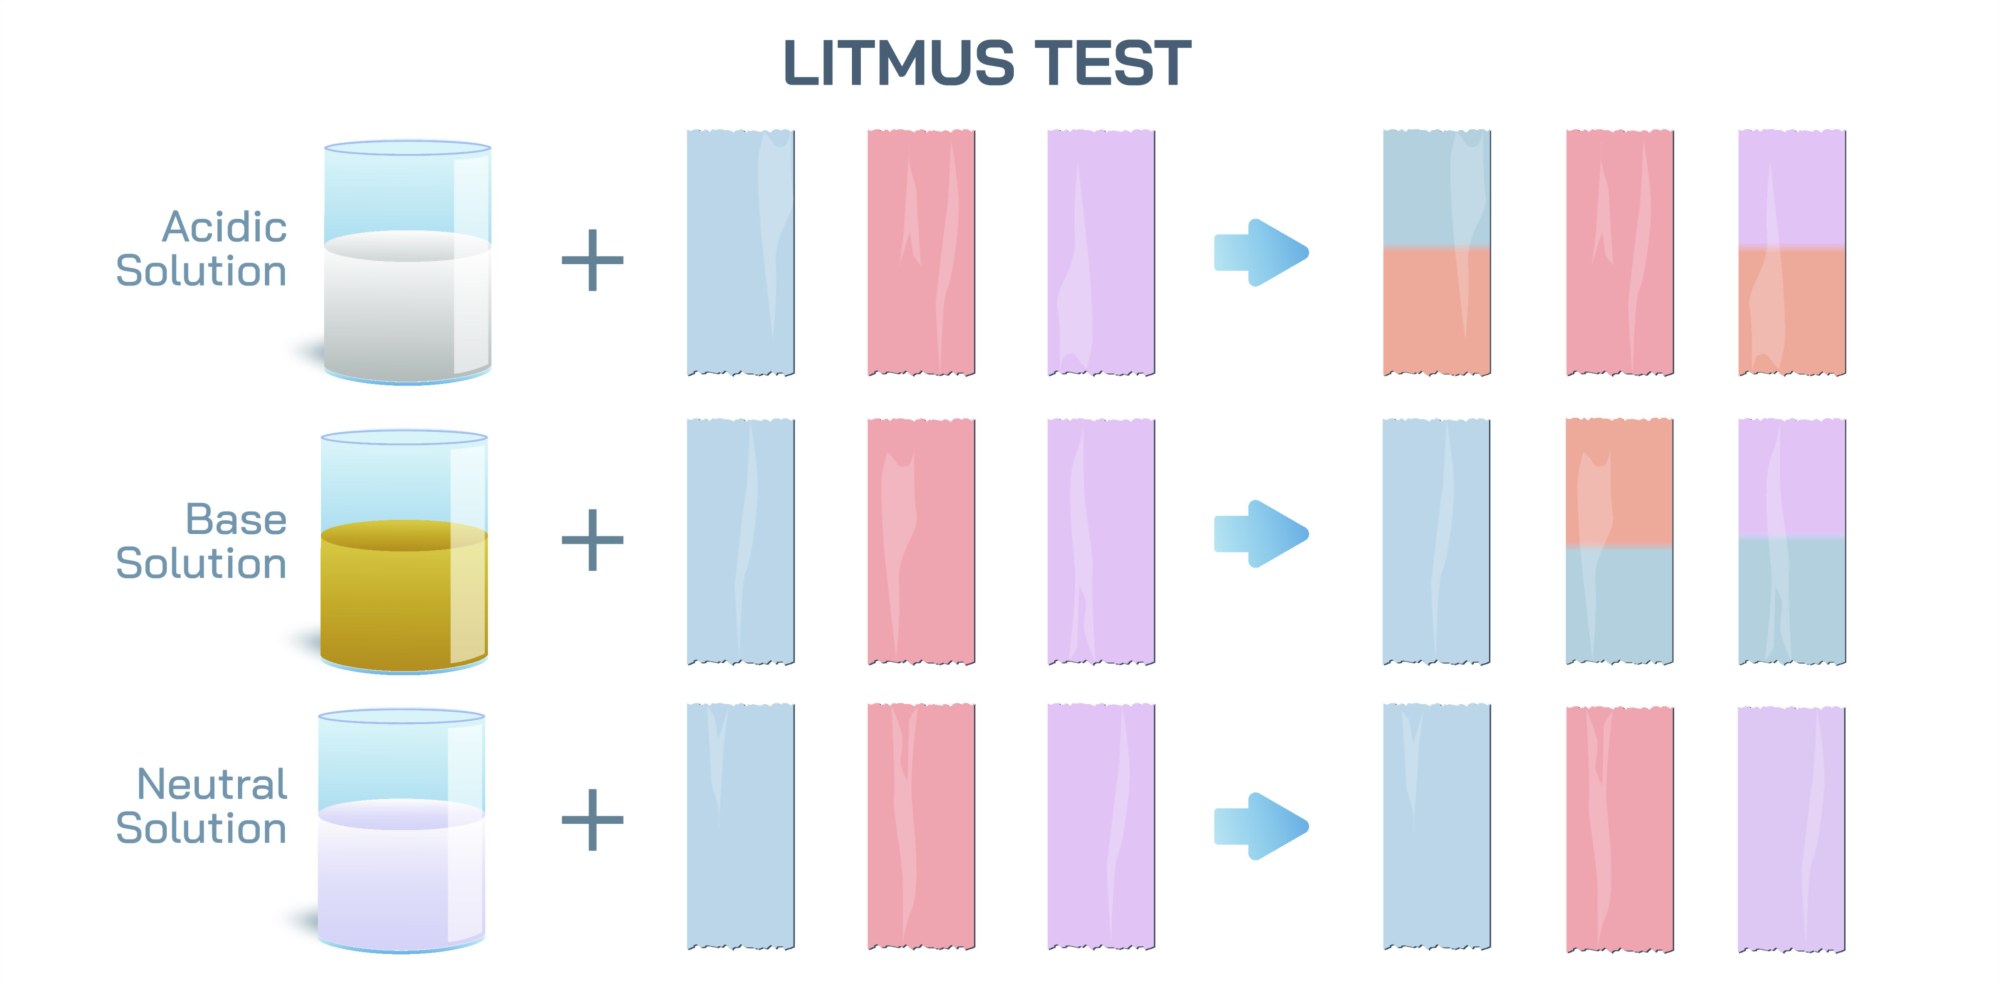
Litmus Paper Test Vector Illustration Showing Acid and Base Color Change Reactions with Red and Blue Indicators
Litmus paper testing is a fundamental experiment in chemistry used to identify acidic or basic (alkaline) solutions through color change reactions. This simple yet powerful diagnostic tool helps learners understand the pH-dependent behavior of chemical indicators. A vector illustration depicting the litmus paper test typically integrates red and blue litmus papers, acid and base solutions, and visible color changes, providing a clear and educational visualization of chemical reactions. By combining labeled test tubes, directional arrows, and comparative color indicators, such illustrations allow learners to intuitively grasp how acids and bases interact with litmus paper in a visually engaging manner.
At the center of the illustration are two test tubes, each containing a representative solution: one acidic (e.g., hydrochloric acid) and one basic (e.g., sodium hydroxide). Labels identify the solution type along with a brief note on pH range (e.g., acid pH < 7, base pH > 7). The test tubes are depicted with transparent surfaces, allowing the viewer to see the immersed litmus paper strips. Subtle shading or gradient effects in the liquids illustrate solution depth and concentration, enhancing realism while maintaining educational clarity.
Red litmus paper is depicted as a strip entering both solutions. In the acidic solution, the red strip remains unchanged, maintaining its bright red hue. In the basic solution, the red litmus paper turns blue, clearly showing the color change that indicates alkalinity. Arrows indicate the movement of the strip into the solution and highlight the transformation, emphasizing the cause-and-effect relationship. Labels annotate “Red litmus turns blue in base” and “Red litmus remains red in acid,” reinforcing key conceptual points.
Blue litmus paper is illustrated similarly, immersed into both solutions. In the acidic solution, the blue strip turns red, while in the basic solution it remains blue. Color gradients or shading along the strip can indicate the extent of reaction or partial color transition, providing an accurate visual representation of indicator behavior. Arrows illustrate the process, and labels annotate “Blue litmus turns red in acid” and “Blue litmus remains blue in base,” ensuring clarity and reinforcing the complementary nature of the indicators.
Vector illustrations often include side-by-side comparison panels showing red and blue litmus papers in both acidic and basic solutions. This layout emphasizes the opposite reactions and allows learners to quickly compare and memorize the color-change behavior. Additional arrows may highlight the universal concept that acids donate protons (H⁺) and bases accept protons (OH⁻), linking the visual experiment to chemical theory.
Magnified insets or callouts may provide detailed views of the litmus paper strip, showing the surface texture and the precise area undergoing color change. Labels may indicate the chemical interaction of the indicator dye with H⁺ or OH⁻ ions, visually connecting macroscopic observations to molecular processes. Color-coded overlays reinforce the contrast between red and blue transformations, making the reaction visually intuitive.
The illustration may also depict common experimental setups, such as holding strips with tweezers, dipping multiple strips simultaneously, or using droppers to add solutions. Arrows and labels can indicate correct handling procedures, depth of immersion, and exposure time for accurate results, providing practical guidance in addition to theoretical understanding.
Additional educational elements include color-coded legends, showing red and blue strips and their corresponding reactions in acid and base environments. Dashed arrows or markers may indicate neutral solutions, where no color change occurs, reinforcing the concept of pH neutrality and helping learners understand the full scope of litmus paper application.
By combining red and blue litmus paper, acid and base solutions, directional arrows, labeled color changes, and magnified strip insets, a vector illustration of the litmus test provides a comprehensive, visually clear explanation of acid-base detection. Color coding, comparative panels, and labels make the complementary reactions of litmus paper immediately understandable, linking experimental observation to chemical theory.
Ultimately, a vector illustration of the litmus paper test demonstrates the principle of pH-dependent indicator reactions, showing how acids and bases can be visually identified through color changes. Through labeled strips, solution types, directional arrows, and magnified reaction zones, the diagram transforms an abstract chemical concept into an educational, visually engaging, and intuitive tool for chemistry learning, laboratory instruction, and experimental demonstration.