Bone Strength Template Showing Healthy Bones, Density Levels, and Calcium Balance
Bone strength is often associated only with how hard or solid a bone appears on the outside, yet the true foundation of skeletal durability lies deep within its internal structure—its mineral density, its microscopic architecture, and its constant exchange of nutrients such as calcium and phosphorus. A template designed to illustrate healthy bones, density levels, and calcium balance plays a vital role in both educational and clinical communication because it visually captures processes that happen silently inside the body over years. Even though bones seem rigid and fixed, they are actually living dynamic tissues that are continuously breaking down and rebuilding through a cycle known as remodeling. This process maintains density, structural resilience, and repair after everyday stress. When calcium intake is adequate, hormones are balanced, and load-bearing physical activity stimulates bone formation, bones remain strong and dense. When these factors falter—whether due to aging, nutritional deficiency, hormonal change, or disease—bone density decreases and bones become fragile. By visually comparing healthy bones and weakened bones, a template immediately translates biological complexity into clear understanding for medical learners and the general public alike.
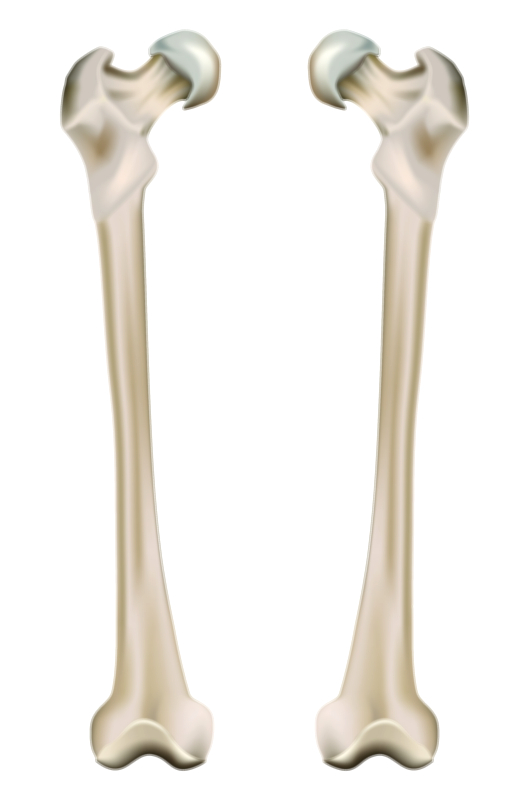
Healthy bones appear strong because of both external and internal structure. The outer region, called compact bone, provides protective strength and accounts for most of the density seen on medical imaging. Beneath this layer lies trabecular or spongy bone, a latticework of mineralized tissue that absorbs impact and distributes mechanical loads. In youth and early adulthood, this trabecular network is thick and interconnected, providing an ideal ratio of strength to lightness. Calcium, vitamin D, phosphorus, collagen fibers, and bone-building cells (osteoblasts) work together to form and maintain this complex framework. A template showing a healthy bone in cross section typically highlights a dense outer shell, tightly organized trabeculae, and smooth articulation surfaces where joints allow movement. Combined, these characteristics explain why strong bones are not just hard—they are adaptable, shock-absorbing, and designed to support physical performance throughout life.
Over time, density changes occur naturally, and their patterns are essential to visual education. During childhood and adolescence, new bone is formed faster than it is broken down, allowing rapid skeletal growth and peak bone mass to accumulate. A bone density visualization may show these early-life bones as thick and fine-textured. Around the third decade of life, peak bone mass is reached, and a steady balance between breakdown (resorption) and buildup (formation) keeps bone density stable—as long as proper nutrition, hormones, and physical activity are maintained. After midlife, especially in women after menopause due to estrogen decline, the balance shifts and bone resorption begins to exceed bone formation. Vector-style diagrams often represent this transition visually through progressively widened trabecular gaps and thinning cortical layers. The template becomes not only a scientific depiction, but also a timeline of skeletal aging and the hidden vulnerability that can emerge when calcium stores are depleted, hormonal signaling weakens, or activity decreases.
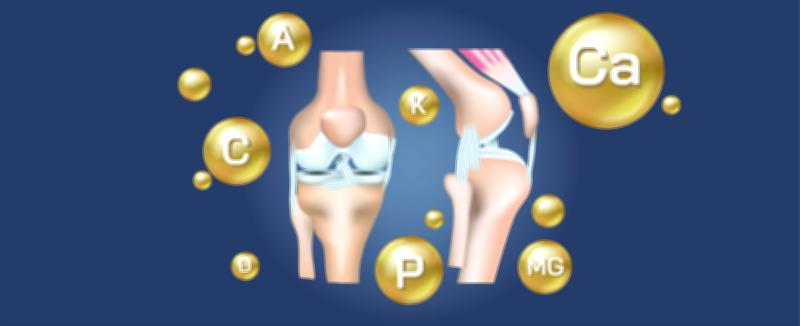
Calcium balance is at the heart of bone strength, and this is one of the most important aspects highlighted in educational illustrations. Approximately 99% of the body’s total calcium is stored in bones and teeth, where it provides mineralization strength; the remaining 1% circulates in blood to support nerve transmission, muscle contraction, heart rhythm regulation, and clotting functions. Because calcium is needed for survival beyond the skeletal system, the body has evolved a safety mechanism: if dietary calcium is insufficient, calcium is removed from bones to maintain blood calcium levels. Over time, this withdrawal weakens the bone matrix. This mechanism, while physiologically necessary in the short term, explains why long-term calcium deficiency leads to bone fragility. A template that shows arrows transferring calcium between bone and bloodstream helps make this invisible exchange easy to understand, reinforcing that the bone is a living reservoir rather than a fixed structure.
Other key players complement calcium in bone metabolism, and an educational template can show their interconnected roles. Vitamin D supports calcium absorption in the intestines; without sufficient vitamin D, even a calcium-rich diet may fail to translate into bone strength. Vitamin K facilitates the binding of calcium to the bone matrix. Magnesium and phosphorus are essential co-minerals that contribute to bone hardness and structural scaffolding. Hormones—including estrogen, testosterone, parathyroid hormone, and calcitonin—regulate the pace of bone remodeling. When these components work harmoniously, bones maintain optimal density; when one factor is disrupted, the entire system is affected. A clear visual flowchart showing calcium absorption from diet, kidney and intestinal regulation, hormonal signaling, and deposit into bone provides an intuitive map of bone health for all ages.
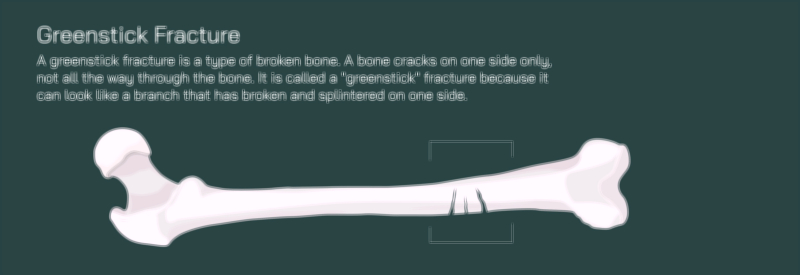
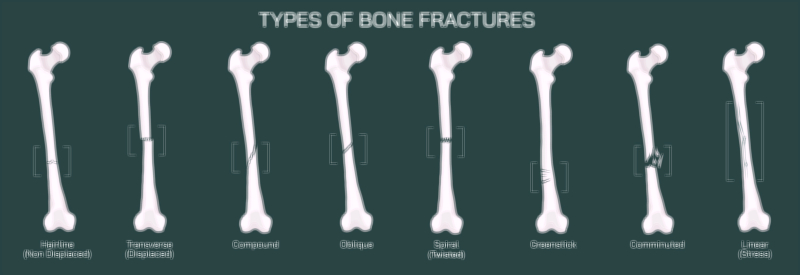
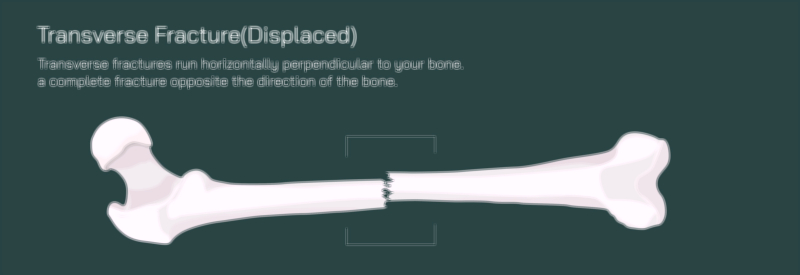
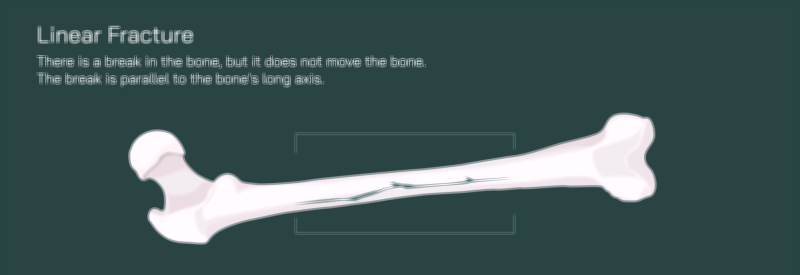
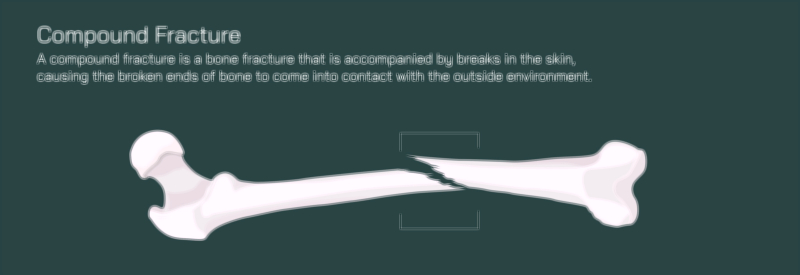
A bone-strength template also provides clarity about weakened bones and the progression toward osteoporosis. In early bone loss (osteopenia), density begins to decline, but the structure is usually intact. At this stage, a diagram may show mild thinning of trabecular tissue and subtle hollowing that does not yet produce symptoms. As bone loss progresses to osteoporosis, the changes become more pronounced—trabecular strands break, cavities enlarge, and the outer cortical shell becomes thinner and brittle. In osteoporosis, even minor falls or ordinary movements may lead to fractures in high-risk areas such as the wrist, hip, and spine. A comparative illustration between a healthy bone, an osteopenic bone, and an osteoporotic bone visually conveys the seriousness of poor calcium balance and unaddressed bone loss. Because osteoporosis develops silently without pain until fracture occurs, showing the internal deterioration is one of the most powerful ways to emphasize prevention and screening.
Physical activity is another critical factor that educational diagrams often incorporate. Bones respond to mechanical stress by strengthening; weight-bearing and resistance exercises stimulate osteoblast activity and signal the body to add minerals to the bone matrix. Conversely, prolonged inactivity—such as bed rest, sedentary lifestyle, or space travel—accelerates bone loss. Illustrations can depict bone formation stimulated by activities like walking, running, lifting, or jumping, contrasted with bone breakdown during inactivity. This visual pairing reinforces that exercise is not just for muscles—it is one of the most powerful interventions for skeletal resilience.
The bone template also supports learning about nutrition and daily habits. Depictions of calcium-rich foods such as milk, almonds, leafy greens, yogurt, and fortified products can highlight dietary sources. Lifestyle factors such as smoking, excessive alcohol use, and high-salt diets can be illustrated as contributors to bone depletion. Illustrations showing sunlight exposure remind viewers of the importance of vitamin D for calcium absorption. Together, these elements help users recognize that maintaining strong bones is a lifelong process that blends nutrition, activity, and weight management.
Bone-strength diagrams benefit greatly from patient-experience elements as well. Weak bones not only increase fracture risk but also affect posture, mobility, height, and comfort. Vertebral fractures may lead to spinal curvature (kyphosis), loss of height, and chronic back pain. Hip fractures remain one of the leading causes of disability in older adults. By showing skeletal alignment changes and the consequences of bone fragility, the illustration supports empathy and encourages prevention rather than reaction.
5. When paired with intuitive visuals, these ranges become more meaningful and less intimidating, easing communication during medical consultations.
Ultimately, a bone strength template showing healthy bones, density levels, and calcium balance serves multiple roles at once—scientific, clinical, preventive, and motivational. It shows how a strong skeletal system is built during youth, why it must be protected through adulthood, and how small choices accumulate over time to either preserve or weaken bone structure. By turning microscopic processes into visible educational narratives, such illustrations contribute to better health literacy, more proactive prevention, earlier diagnosis, and greater lifelong mobility. They remind us that bone health is not predetermined but cultivated—and that by supporting density and maintaining calcium balance, we protect not only the structure of our skeleton but the quality of our lives.