Analytic Geometry Lines and Curves — Equations, Graphs, and Coordinate Geometry Concepts
Understanding the Role of Analytic Geometry in Mathematical Visualization
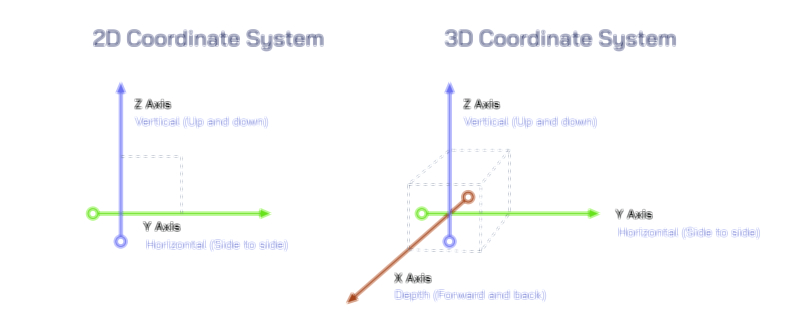
Analytic geometry, often called coordinate geometry, bridges the gap between algebra and geometry by allowing equations to represent geometric figures on a coordinate plane. This field of mathematics brings shapes, lines, curves, and spatial relationships into a system of numbers and coordinates, transforming visual patterns into algebraic language. Its foundation lies in the Cartesian coordinate system, where every point is described by ordered pairs that define horizontal and vertical displacements. Through this combination of algebraic expressions and geometric interpretation, analytic geometry provides a powerful framework for exploring distance, slopes, intersections, and the behavior of curves. A vector illustration depicting lines and curves of analytic geometry typically includes smooth graphs of linear, quadratic, and higher-order functions, plotted neatly within a coordinate grid. Such visuals help learners and practitioners alike understand how equations shape the curves we observe and how geometric relations can be analyzed precisely using formulas and coordinate logic.
Linear Equations and the Geometry of Straight Lines
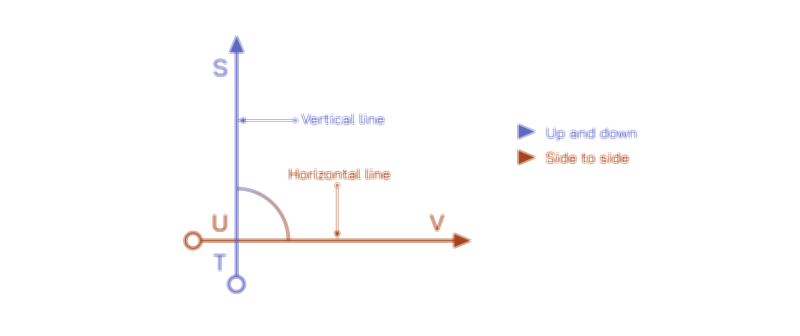
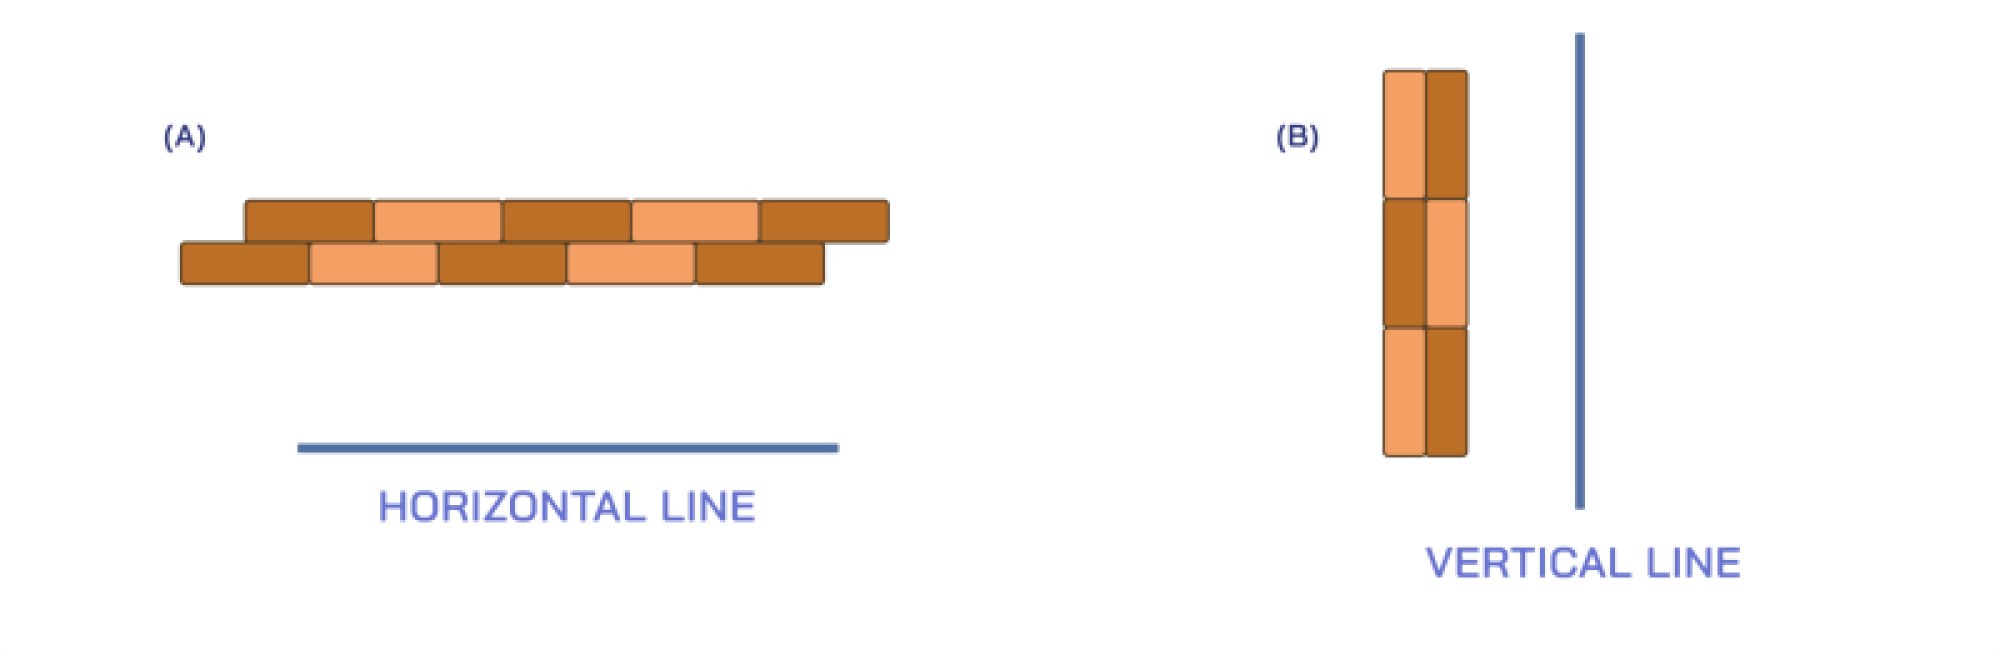
Straight lines represent the simplest and most fundamental geometric objects in analytic geometry. Their algebraic form, often expressed as y = mx + c, encodes crucial geometric insights: the slope m defines the steepness and direction of the line, while the intercept c determines the line’s vertical position. A positive slope tilts the line upward from left to right, whereas a negative slope tilts it downward. Zero slope produces a horizontal line, and an undefined slope corresponds to a vertical line. These relationships allow algebraic expressions to convey geometric orientation directly on the coordinate plane. The concept of slope also forms the basis for understanding parallelism and perpendicularity: lines with equal slopes are parallel, and lines with slopes that multiply to –1 meet at right angles. A vector illustration of analytic geometry often includes multiple lines intersecting at various angles, showing how changes in slope reflect on the graph. This visual clarity helps students grasp the connections between equations and geometric appearances.
Quadratic Curves and the Parabola as a Fundamental Conic
A parabola, described by equations of the form y = ax² + bx + c, introduces curvature into the world of analytic geometry. Unlike lines that maintain consistent direction, parabolas bend smoothly, opening upward or downward depending on the sign of the coefficient a. Their symmetry is expressed through a vertical axis of symmetry, and the turning point—called the vertex—marks the minimum or maximum value of the function. This geometric behavior connects directly to algebraic operations such as completing the square or analyzing discriminants. Parabolas also appear naturally in physics and engineering, forming the paths of projectiles and the surfaces of reflective mirrors. Vector illustrations often plot parabolic curves with distinct turning points, emphasizing their smooth curvature and symmetry. The visual representation reinforces how algebraic coefficients shape the width, direction, and position of the parabola, translating numerical parameters into geometric features on the coordinate plane.
Conic Sections — Circles, Ellipses, and Hyperbolas
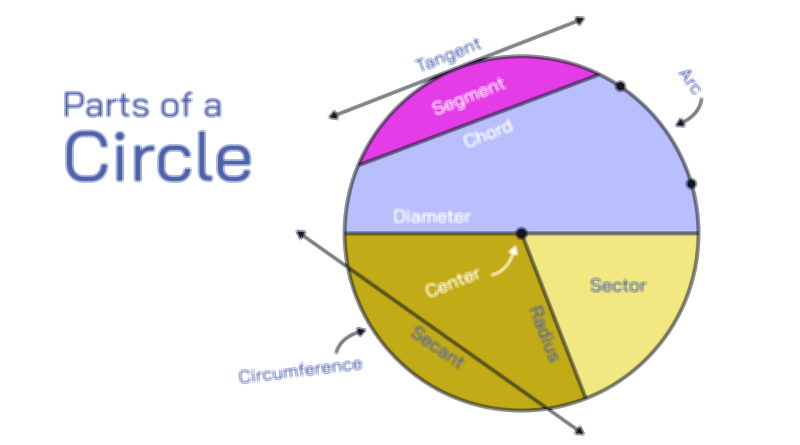
Beyond parabolas, analytic geometry encompasses the full family of conic sections—curves obtained by slicing a cone at different angles. A circle, defined by equations such as (x − h)² + (y − k)² = r², represents all points that remain equidistant from a central point. Its geometric simplicity makes it a foundational element in coordinate geometry. Ellipses generalize the idea of circular symmetry by stretching the radius along two axes, described by equations where the squared terms are divided by different denominators. Hyperbolas, on the other hand, form open curves with two branches and reflect geometric divergence rather than convergence. These curves illustrate a remarkable mathematical unity: similar algebraic structures generate dramatically different geometric outcomes depending on signs and coefficients. A vector illustration portraying multiple conic curves within the same coordinate frame highlights this diversity, showing how circles, ellipses, parabolas, and hyperbolas relate through smooth, continuous transformation of their equations.
Distance, Midpoints, and Geometric Relationships in Coordinates
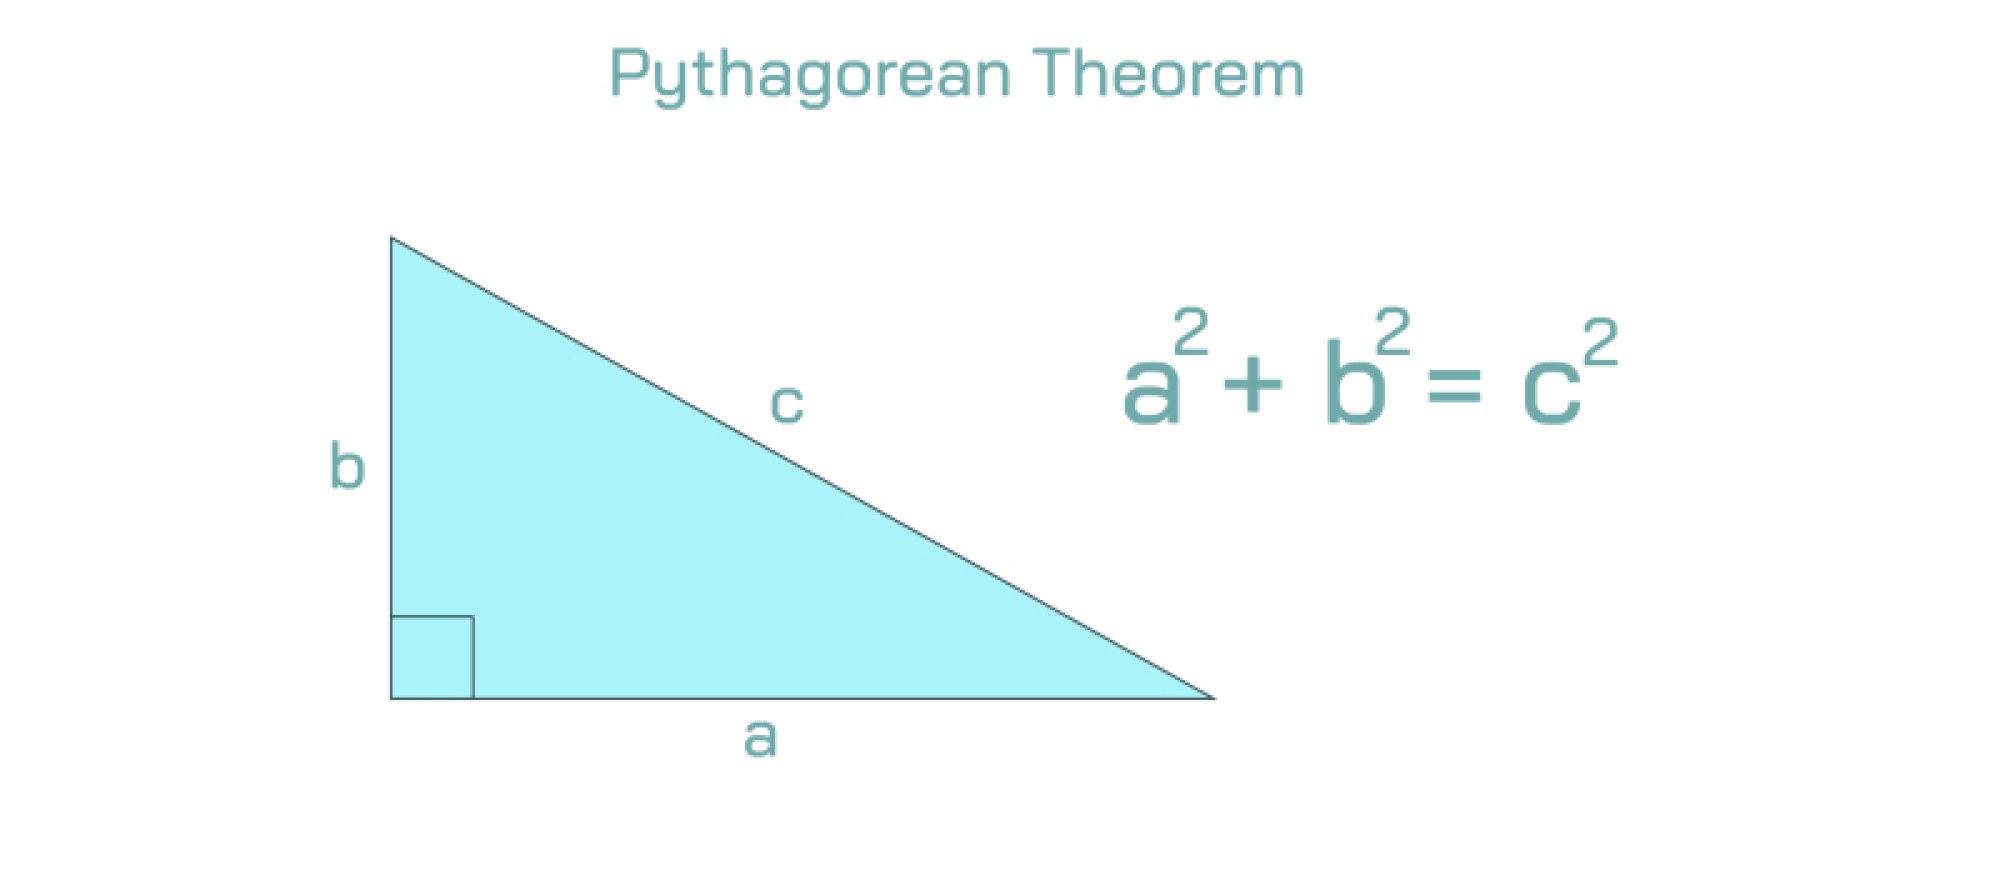
Analytic geometry transforms geometric relationships—such as distances, midpoints, and divisions of line segments—into algebraic formulas. The distance between two points arises naturally from the Pythagorean theorem applied to coordinate differences, while the midpoint formula averages the coordinates to find a point precisely between two others. These coordinate-based methods provide accuracy far beyond simple drawing, making it possible to analyze geometry without producing a sketch at all. Vector illustrations often include highlighted segments on a grid, showing how points, lines, and distances relate through precise measurements. These visuals help learners understand that every geometric relationship can be expressed numerically and every algebraic expression has a graphical interpretation.
Slopes, Intersections, and Systems of Equations
When two lines intersect, their meeting point corresponds to the solution of a system of equations. Analytic geometry interprets algebraic solutions as geometric interactions between graphs. If two lines intersect at a single point, the system has a unique solution; if they are parallel, the system has no solution; and if they coincide, the system has infinitely many solutions. These geometric scenarios provide intuitive interpretations of algebraic concepts. Vector diagrams depicting multiple lines crossing or failing to meet illustrate these ideas beautifully, showing how solving equations equates to finding geometric intersections on the plane.
Higher-Order Curves and Complex Geometries
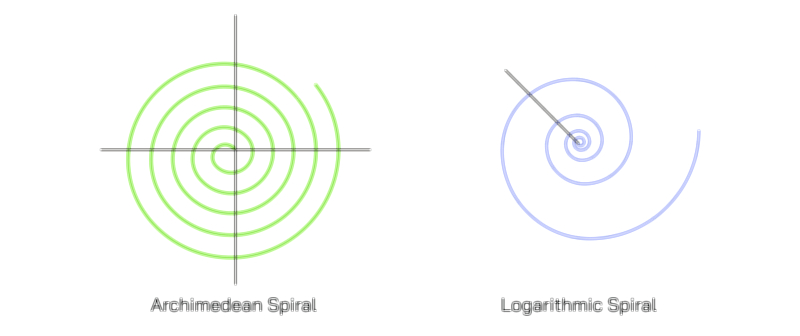
As equations become more complex, analytic geometry introduces curves beyond simple conics—cubic curves, exponential graphs, logarithmic curves, and trigonometric waves. While these shapes may vary widely in form, their graphical behavior always emerges directly from their algebraic structure. A vector illustration showing multiple such curves emphasizes how dramatically different geometric forms can arise from changing mathematical expressions. These curves reveal the power of using coordinates and equations to map complex relationships visually, enabling deeper understanding of mathematical functions and their behaviors.
Illustrating Analytic Geometry Concepts Through Vector Graphics
Vector illustrations of analytic geometry typically include axes, grid lines, labeled points, and multiple plotted curves and lines, all rendered with crisp precision. These graphics represent algebraic equations as geometric objects that interact across the coordinate plane—intersecting, bending, diverging, or running parallel. By combining smooth mathematical curves with clear diagrams, vector graphics bring to life the core idea of analytic geometry: that algebraic expressions and geometric figures are two perspectives of the same underlying structure.