Pressure Profile Around an Airfoil — Lift, Flow, and Bernoulli’s Principle
Understanding the Pressure Distribution That Creates Lift
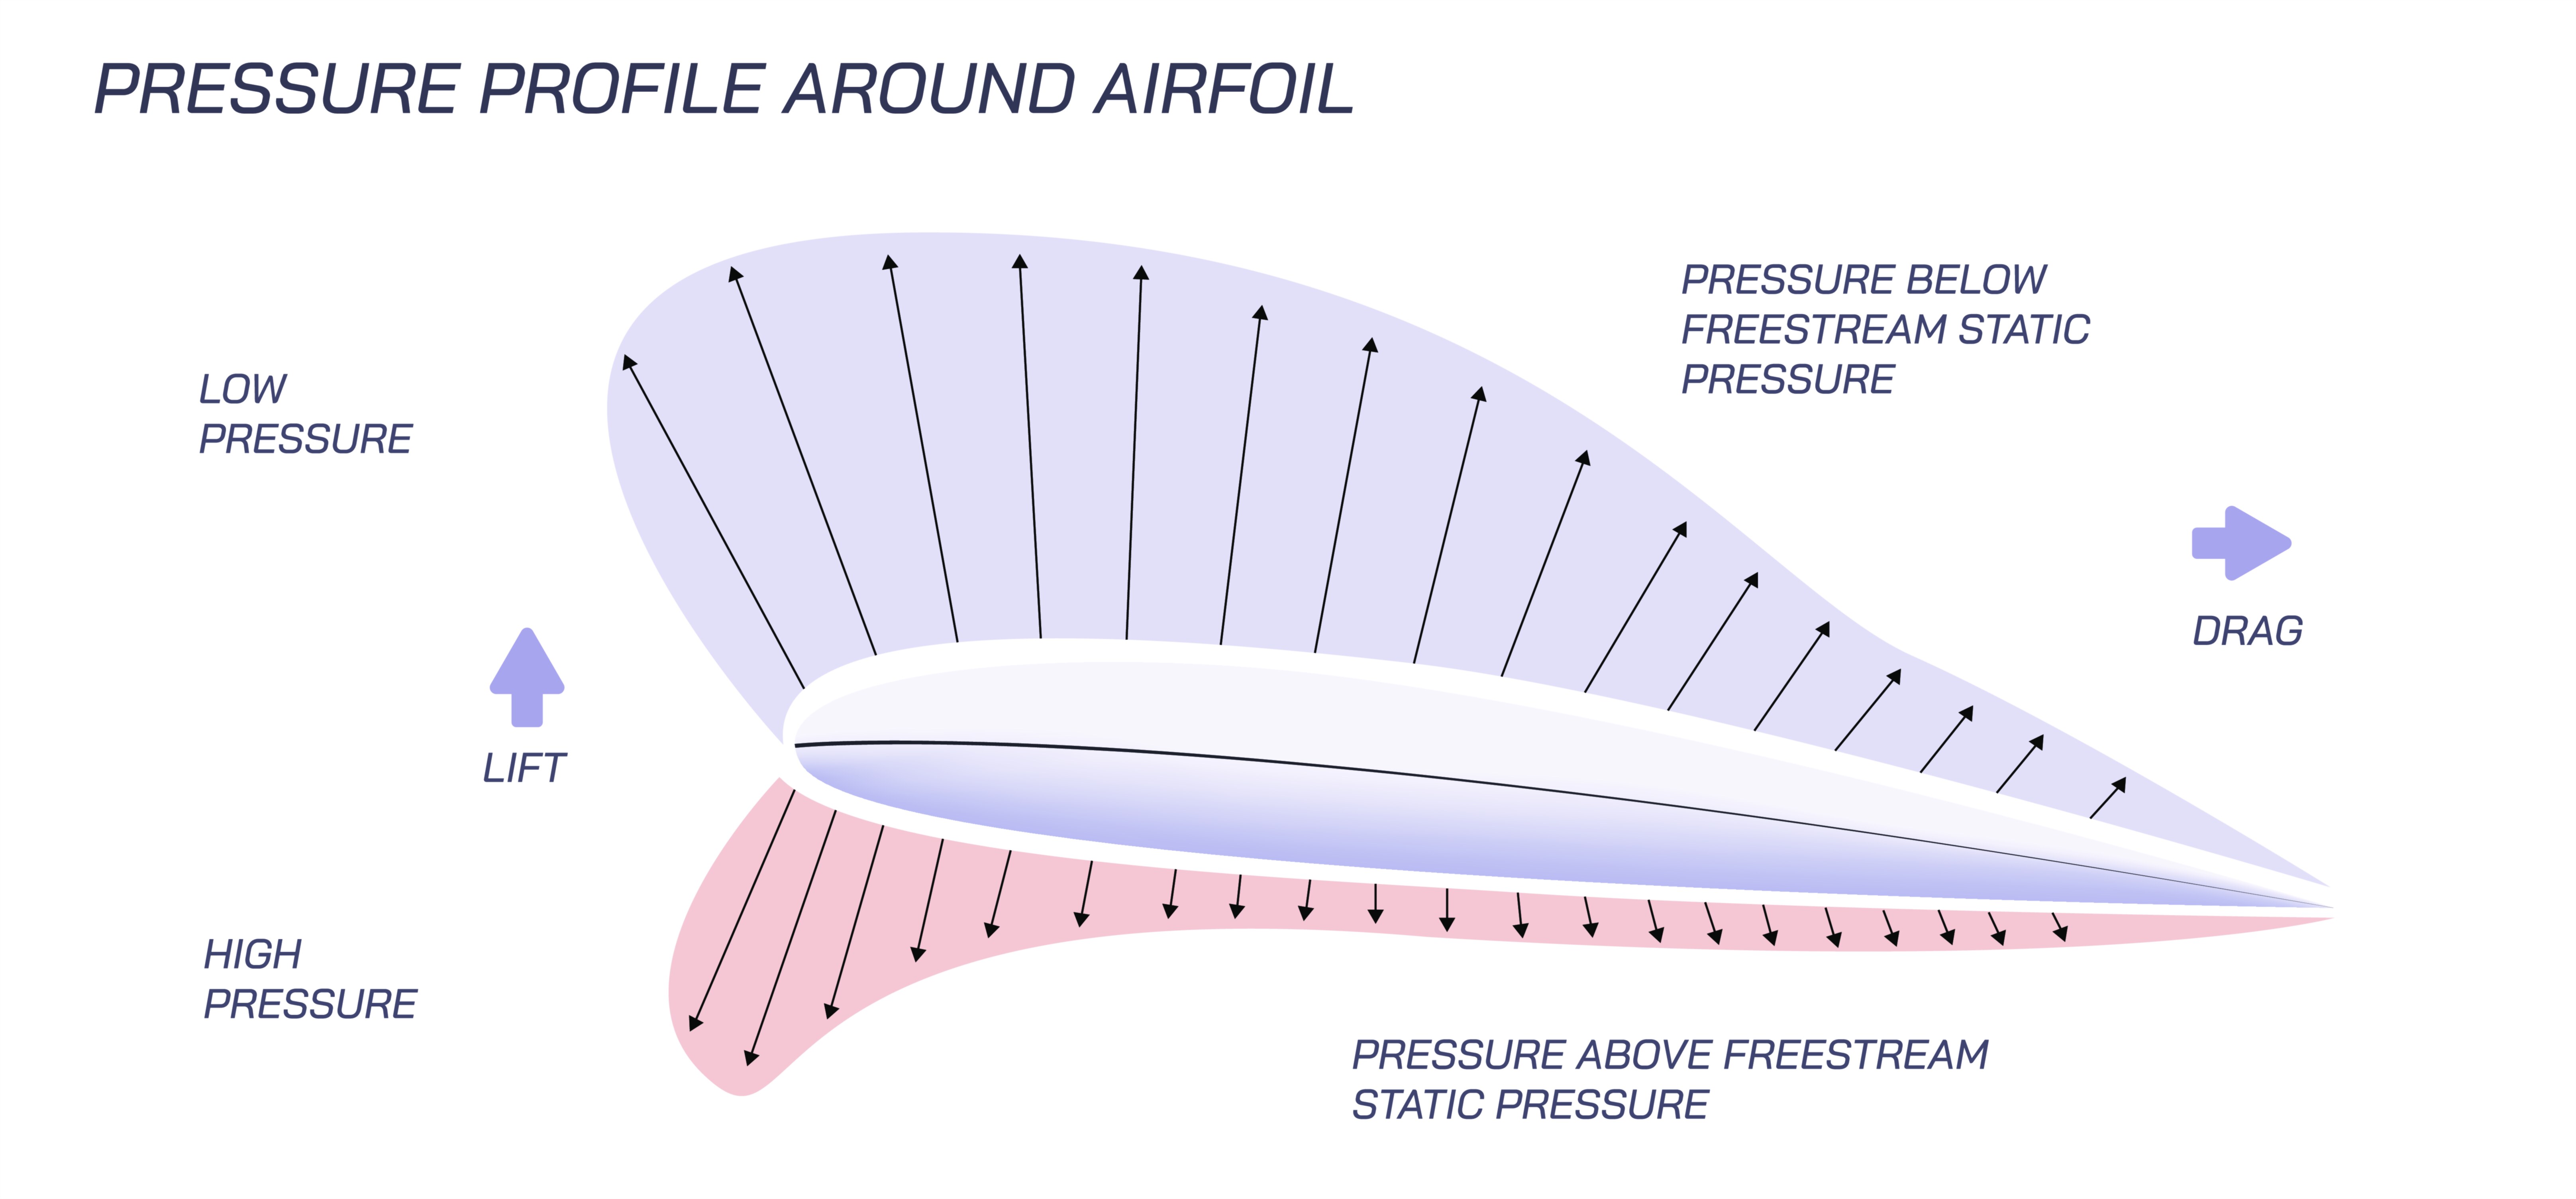
The pressure profile around an airfoil is one of the most revealing and essential concepts in aerodynamics because it visually explains why a wing generates lift and how airflow behaves as it passes around a curved surface. When an airfoil moves through the air, the flow divides at the leading edge, sending part of the air over the upper surface and part underneath. Due to the shape of the airfoil and its angle of attack, the air on the upper surface accelerates and spreads into a region of lower pressure, while the air beneath moves more slowly and maintains higher pressure. This pressure difference creates the aerodynamic force known as lift, pushing the wing upward against gravity. A vector illustration of the pressure profile highlights these regions vividly, usually depicting cool colors such as blues in low-pressure zones above the airfoil and warmer colors like reds beneath it to indicate higher pressure. This visual contrast helps demonstrate the core aerodynamic principle that variations in airflow speed directly influence pressure distribution, and therefore influence lift generation.
Bernoulli’s Principle and Its Relationship to Airflow Speed
Bernoulli’s principle plays a central role in understanding why pressure differences arise around an airfoil. According to this principle, in a steady, incompressible flow, areas where the air moves faster exhibit lower static pressure, while areas of slower flow show higher pressure. The curvature of an airfoil forces the air traveling over the top to accelerate, stretching the flow and reducing pressure. Meanwhile, the bottom surface provides a smoother, shorter path where air tends to move more slowly and therefore maintains higher pressure. This simple relationship between speed and pressure forms the foundation of lift generation. However, Bernoulli’s principle alone does not explain all aspects of aerodynamic forces—it is complemented by Newton’s third law and the downward deflection of airflow. Still, the pressure profile remains one of the clearest ways to visualize Bernoulli’s effect in action, showing how carefully designed curvature and thickness shape airflow speeds and create the conditions that enable lift.
The Role of Angle of Attack in Shaping Pressure Distribution
Although airfoil curvature influences airflow, the angle of attack—the angle at which the wing meets oncoming air—has an even greater impact on pressure distribution. At low angles of attack, the pressure difference between the upper and lower surfaces remains moderate, producing gentle, stable lift. As the angle increases, the low-pressure region on the upper surface deepens and expands because the wing deflects more air downward and forces faster flow over the top. This results in a steeper lift curve and more powerful upward force. In a vector illustration, this expanded low-pressure area usually appears as a widened region of lighter color above the airfoil, indicating greater pressure drop. However, if the angle of attack becomes too high, airflow can no longer remain attached to the upper surface. The pressure pattern collapses, the low-pressure zone breaks apart, and the wing experiences aerodynamic stall—a condition marked by a dramatic loss of lift. Understanding the relationship between angle of attack and pressure profile is essential for aircraft control, safe maneuvering, and efficient performance in varying atmospheric conditions.
Stagnation Point, Pressure Peaks, and Flow Attachment
A crucial but often overlooked feature of the pressure profile is the stagnation point—where airflow divides at the leading edge. This point experiences the highest pressure on the airfoil because the air velocity momentarily drops to zero before splitting into upper and lower streams. Just behind this stagnation point on the upper surface lies the suction peak, the region of lowest pressure on the entire wing. This peak occurs because air accelerates rapidly as it climbs over the airfoil’s curvature, producing the strongest downward pressure force and contributing significantly to lift. As the air continues along the surface, the pressure gradually rises toward the trailing edge due to deceleration and energy loss within the boundary layer. A vector diagram often shows these peaks and gradients clearly, mapping how airflow attaches, decelerates, and transitions as it moves across the surface. Maintaining proper attachment of the flow is critical because pressure recovery near the trailing edge affects drag, stall tendencies, and total aerodynamic efficiency.
Boundary Layer Behavior and Its Influence on Pressure Patterns
The behavior of the boundary layer—the thin sheet of air directly touching the airfoil—also shapes the pressure distribution. In a laminar boundary layer, airflow remains smooth and orderly, allowing pressure to adjust gradually along the surface. This produces a clean, predictable pressure profile that minimizes drag. As flow transitions into turbulence, mixing intensifies, allowing air to better adhere to the airfoil at higher angles of attack but increasing skin-friction drag. When flow separates entirely, the pressure profile becomes distorted; the upper surface loses its low-pressure region and turbulent wake forms behind the wing. An illustration of pressure profile often shows these differences through shading and contour lines, marking where transition or separation occurs. Engineers rely on these visualizations to refine wing shapes, maintain efficient pressure recovery, and prevent premature stall in real-world flight conditions.
Newtonian Momentum Effects and Downwash Contribution to Lift
While Bernoulli’s principle explains how pressure differences arise, Newtonian mechanics provide the complementary view: lift is generated because the wing deflects air downward. As the wing pushes air toward the ground, an equal and opposite reaction force pushes the wing upward. The pressure profile captures this interaction indirectly, revealing how the upper-surface suction and lower-surface compression work together to direct airflow downward. In a vector illustration, downwash is often represented by streamlines that curve downward behind the wing, demonstrating momentum transfer and the trailing-edge pressure recovery responsible for an aircraft’s overall lift. This dual view—pressure differential and downward airflow—provides a comprehensive understanding of lift generation, tying together Bernoulli’s insight and Newton’s physical laws.
Illustrating Pressure Profiles and Airflow Patterns Around an Airfoil
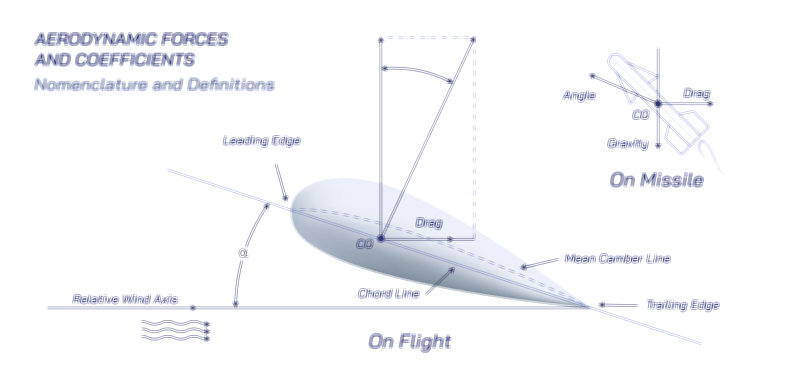
A vector illustration portraying the pressure profile around an airfoil typically includes colored gradients showing high-pressure regions beneath the wing and low-pressure zones above it. Streamlines flow smoothly around the contour, accelerating over the top surface and maintaining slower motion underneath. Labels may highlight the suction peak, stagnation point, angle of attack, and flow separation regions. Additional elements might include arrows showing lift direction, velocity contours, or pressure coefficient distributions. These visual tools help clarify how lift is generated, why certain airflow patterns emerge, and how Bernoulli’s principle integrates with momentum deflection to support flight. By examining such diagrams, one can see the aerodynamic story unfold: shape, speed, pressure, and flow working together to lift an aircraft into the sky.