3D Demand and Supply Illustration — Market Curves, Interaction, and Visual Interpretation
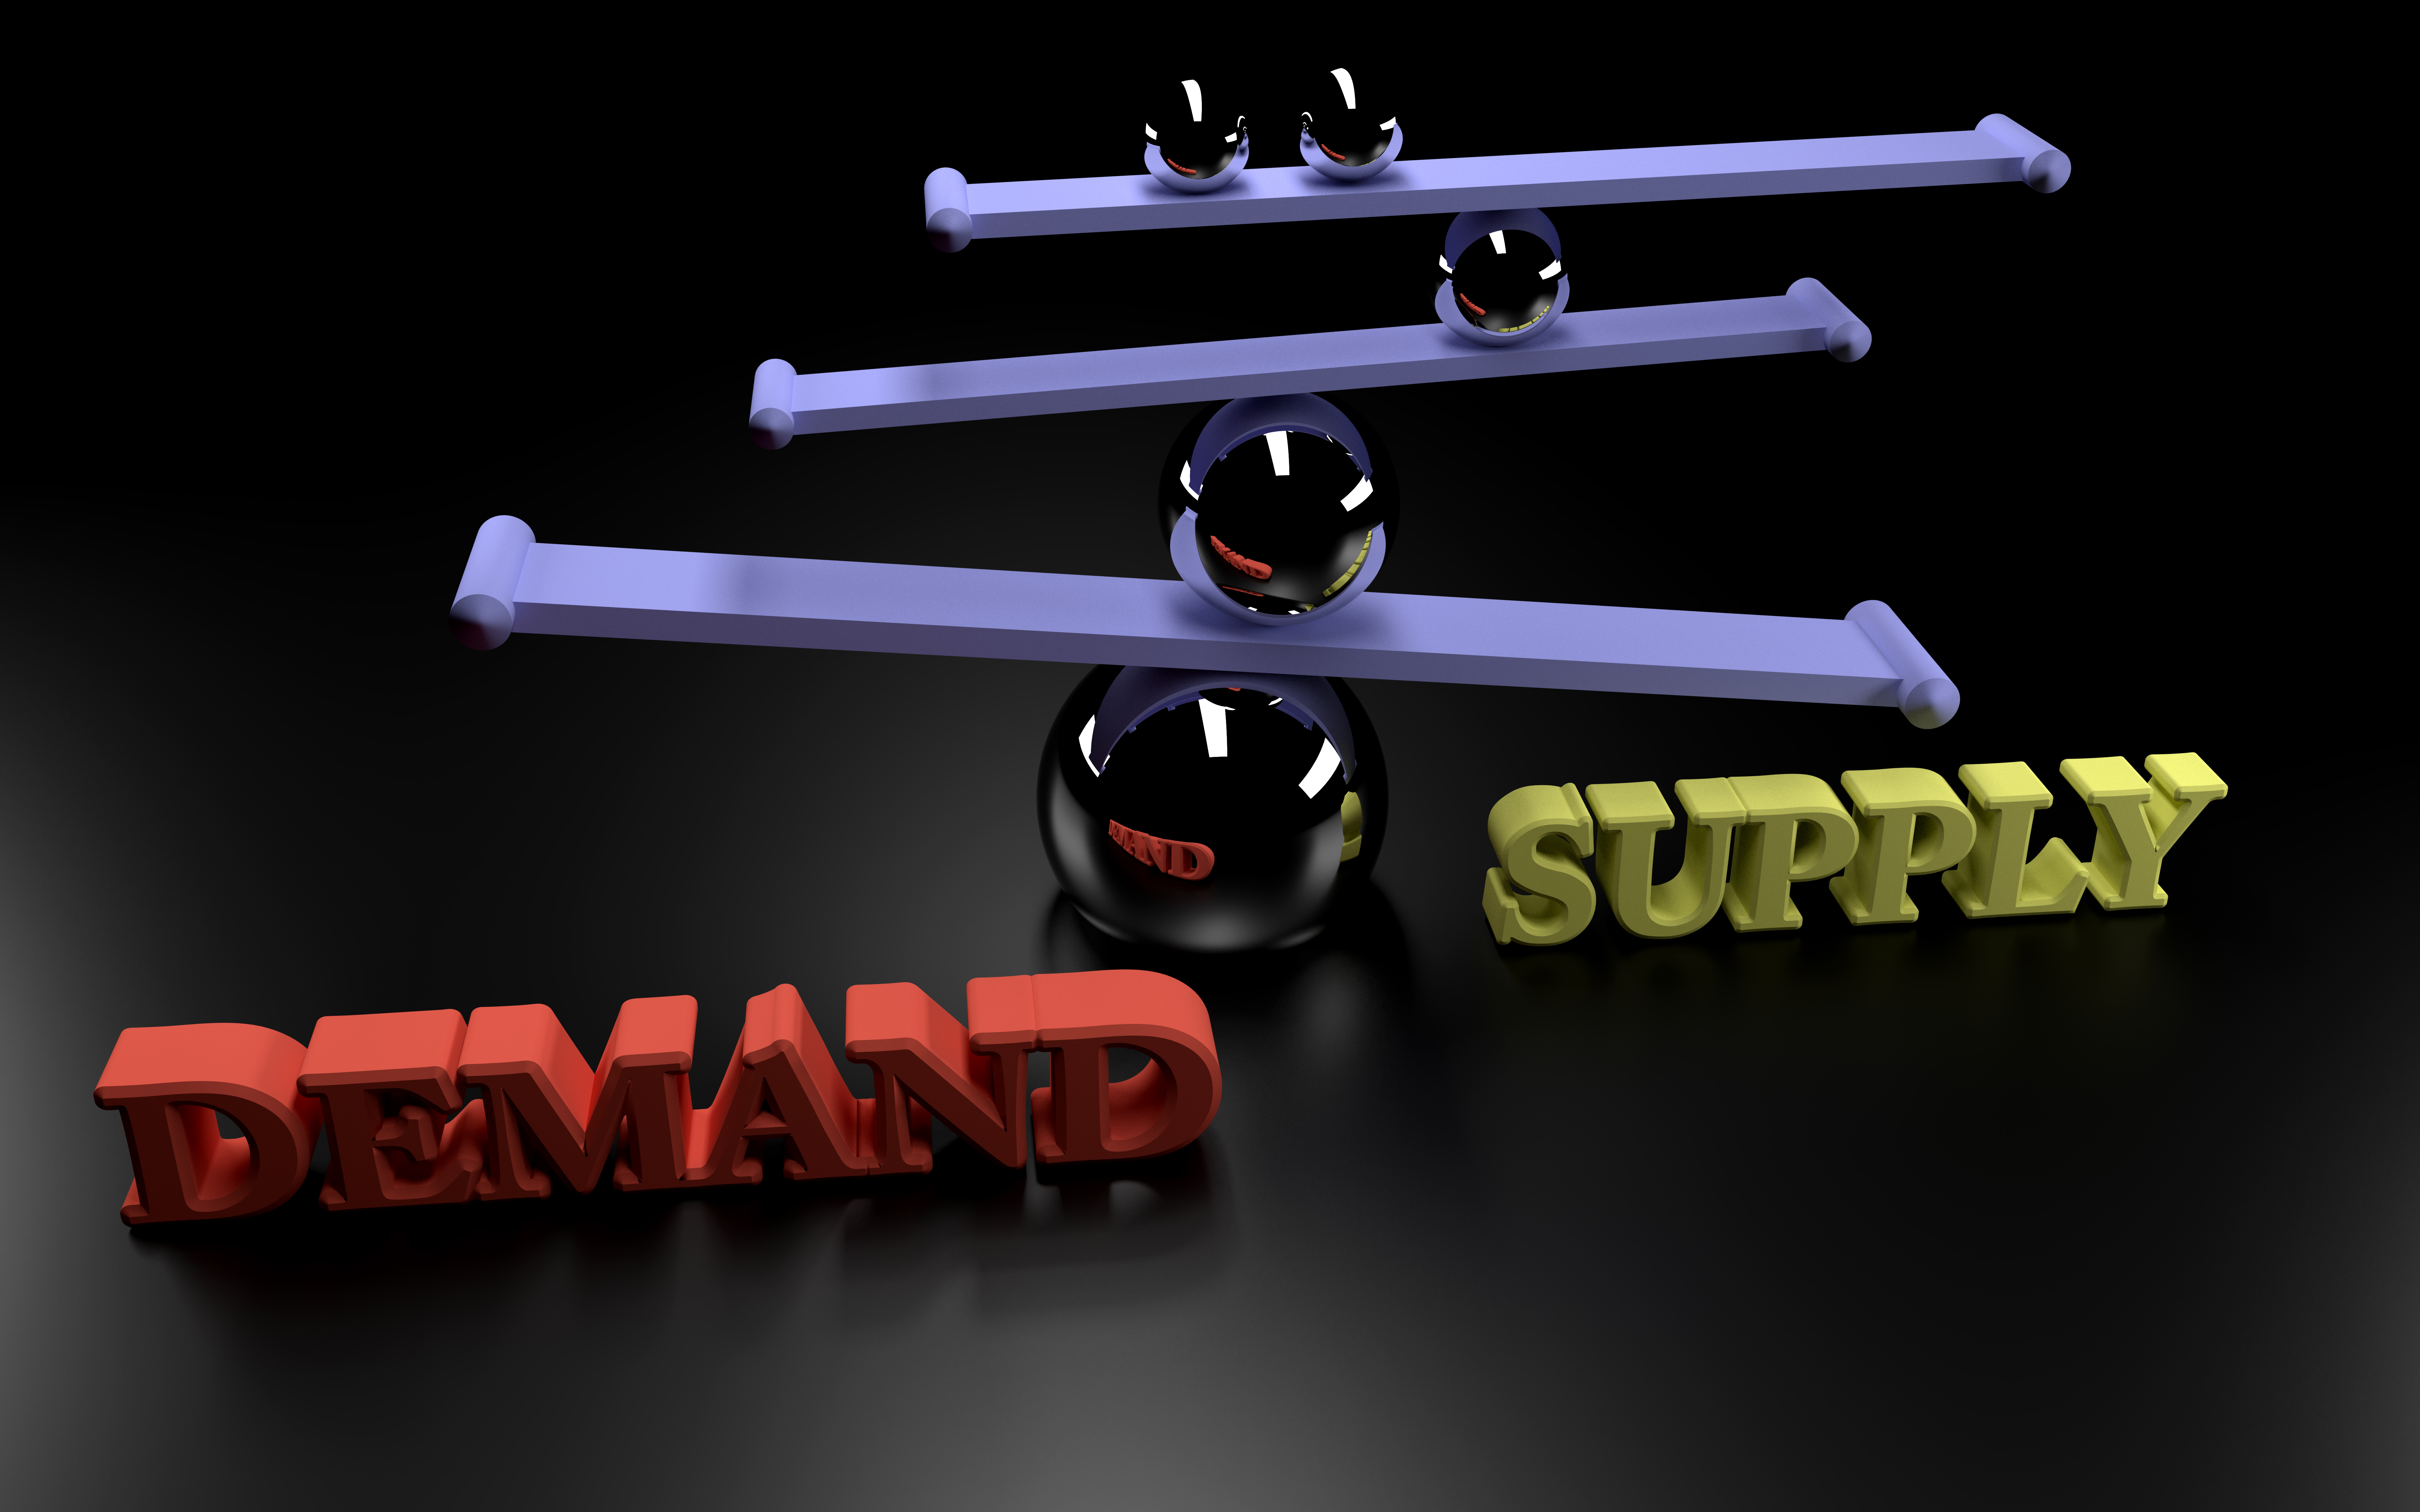
A 3D demand and supply illustration presents market behavior in a way that brings depth and clarity to the familiar economic model. Instead of a flat two dimensional chart, a three dimensional view adds visual strength to the idea of shifting curves, intersecting points, and the relationship between price and quantity in a market. This type of visual is widely used in design projects, study material, economic presentations, and vector based educational graphics. The three dimensional approach helps viewers understand how changes in one part of the system affect the entire structure, giving a more intuitive grasp of market movement.
In a typical 3D representation, the horizontal base serves as the ground for quantity while the vertical rise displays the price level. A third visual dimension is added through space depth, curve shading, surface height, and shape volume. Instead of simple lines, the curves may appear like elevated ribbons or softly curved surfaces. This creates a vivid and easy to understand interpretation of market forces. The demand curve often slopes downward across this structure, showing how the market tends to reduce desired quantity as price increases. The supply curve rises, indicating that higher price encourages production or availability. These two curves, when drawn in a 3D environment, produce a clear meeting point that reflects balance in the market.
The depth added by three dimensional rendering emphasizes the idea that market interactions are not fixed. Designers often tilt the structure to reveal the underside of the curves or rotate them to highlight how distance between the curves widens or narrows depending on price and quantity levels. This visual movement mirrors the dynamic nature of real markets which shift due to changes in buyer preference, production conditions, resource availability, or broader economic influence. The intersection point remains the central feature, representing the level at which demand and supply agree, forming a natural balance.
In many educational graphics, the 3D approach adds texture, shadow, and gradient, giving the curves a more realistic presence. This effect makes the chart easier for students to interpret because the interaction between each part becomes visually defined. A curve that sits higher or lower becomes instantly noticeable, and the direction of market pressure becomes far clearer. Even the background grid often takes on a faint structure that supports the idea of economic measurement in a controlled space. By combining these visual cues, the 3D model transforms abstract ideas into meaningful shapes that hold attention.
A 3D demand and supply illustration is also useful when demonstrating how external factors shift market lines. When demand rises, the entire demand curve may move toward a new position. In three dimensional form, this movement appears like a full surface sliding across the field, helping viewers understand that the change affects every price level, not just a single point. Similarly, when supply falls, the curve moves upward or to the left, and the three dimensional representation makes this motion easier to observe. The changing location of the intersection point reveals how new price and quantity levels emerge from these shifts.
For design projects, the 3D version gives more room for creative styling. Many designers show curves made of glossy surfaces, soft gradients, or transparent layers. Others add glowing markers at the meeting point to highlight the balance between supply and demand. Some include subtle arrows or motion lines to indicate direction without overwhelming the viewer. These artistic elements allow the graphic to remain both educational and visually appealing. Adobe tools and other illustration software handle these effects well, allowing the curves to look smooth and precise.
The 3D form also strengthens understanding of scarcity, surplus, and shortage. When supply sits above demand at a certain price, the visual gap appears like a clear three dimensional distance. When demand exceeds supply, the opposing gap forms. These visual gaps make it easier to communicate how market pressure pushes price toward balance. Instead of calculating through charts alone, viewers can simply see where pressure builds within the structure.
Students benefiting from such visuals often report that three dimensional charts feel more intuitive than traditional flat diagrams. The additional depth helps them picture how real markets do not operate in simple straight lines but respond to multiple influences at once. Instructors also use these visuals to highlight long term trends, policy effects, and seasonal changes. The curves can be layered or combined with additional elements to reflect various conditions and outcomes.
When fully interpreted, the 3D demand and supply illustration becomes more than a simple economic tool; it becomes a conceptual model of how market forces interact in real life. It shows how balance forms, how shifts occur, and how price and quantity respond to changing conditions. Its clarity, depth, and visual appeal make it valuable for designers, educators, and students seeking strong conceptual understanding.