Understanding Chart Pattern Breakout Behavior
A chart pattern breakout represents a moment when price escapes a contained region and begins a fresh directional move supported by momentum. To understand this process clearly, it is important to see how structure evolves before expansion. Price often spends time within a tight region, forming repeated waves that create a recognizable pattern. These waves shape areas where pressure builds gradually. As movement unfolds, activity reveals subtle hints about which side may gain control. The entire sequence becomes easier to read once one knows how waves form, compress, and finally release.
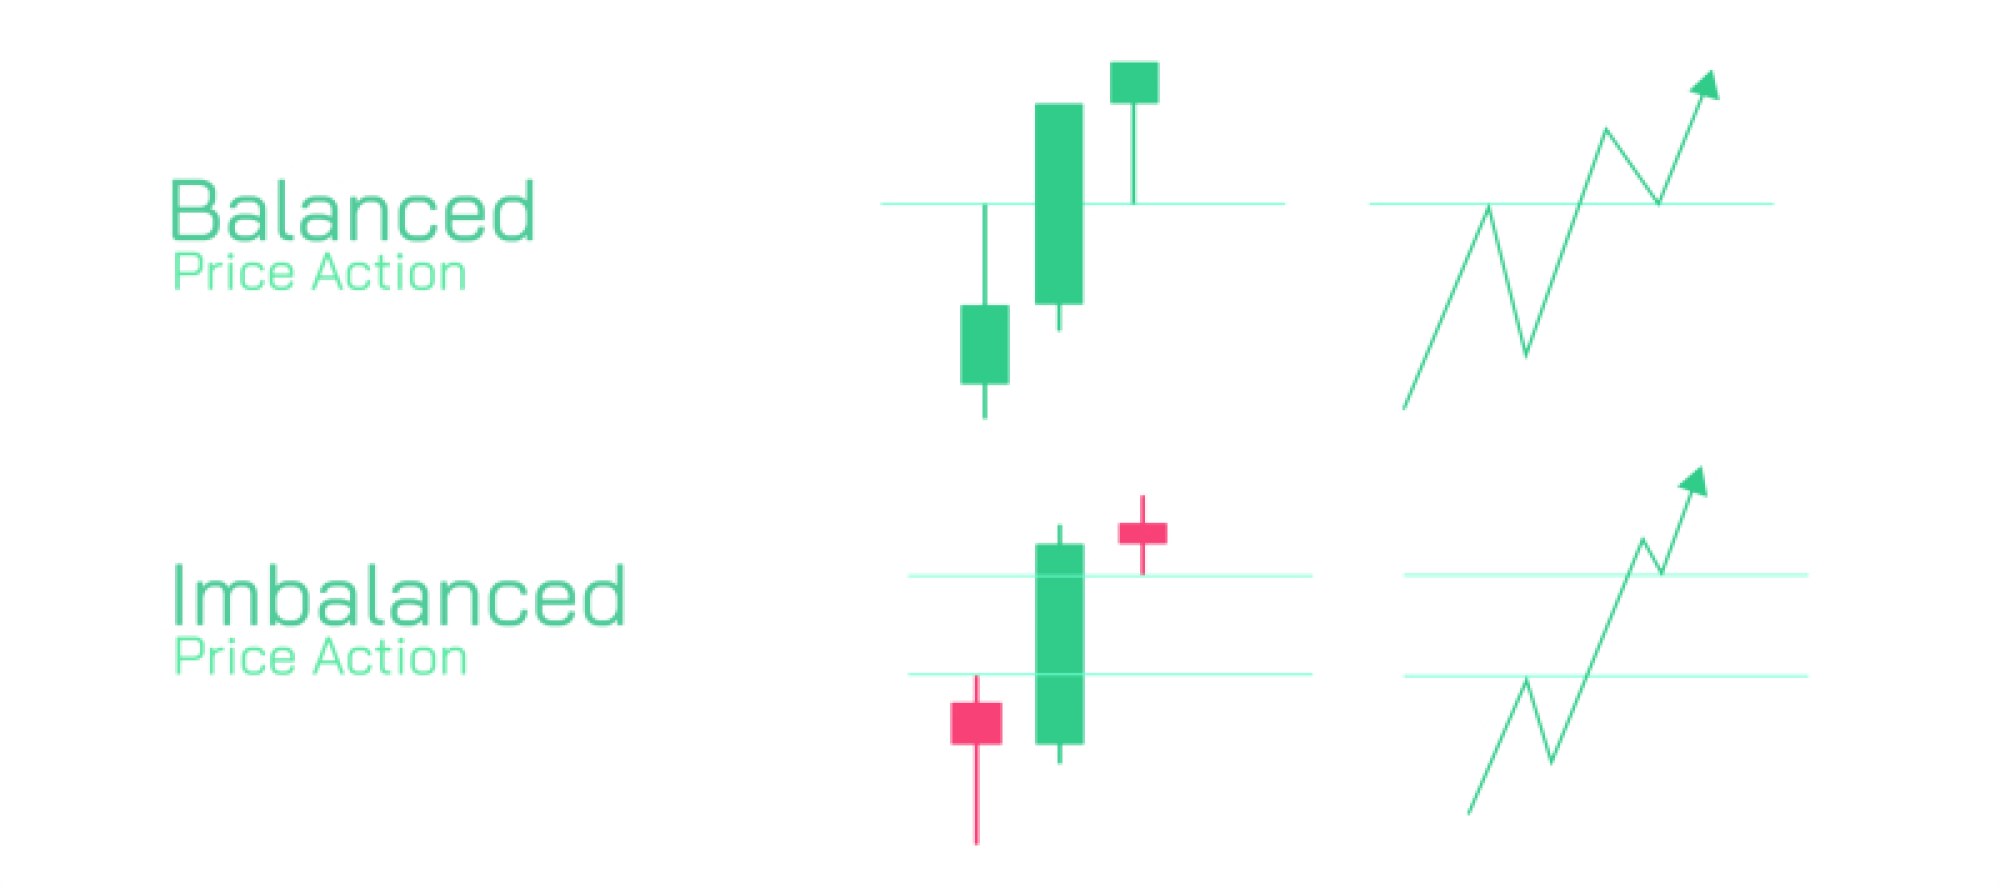
Inside a holding region, price moves between boundaries that define the limits of the pattern. These boundaries guide participants as they interpret each wave. Early waves typically behave smoothly, creating the initial shape. As more waves fill the region, their character changes. Some waves shorten, others lengthen, and a few arrive with stronger activity. These subtle differences reflect underlying pressure. When momentum begins leaning toward one side, efforts to push against the boundary become more frequent. These repeated approaches reveal growing interest in exploring a new direction.
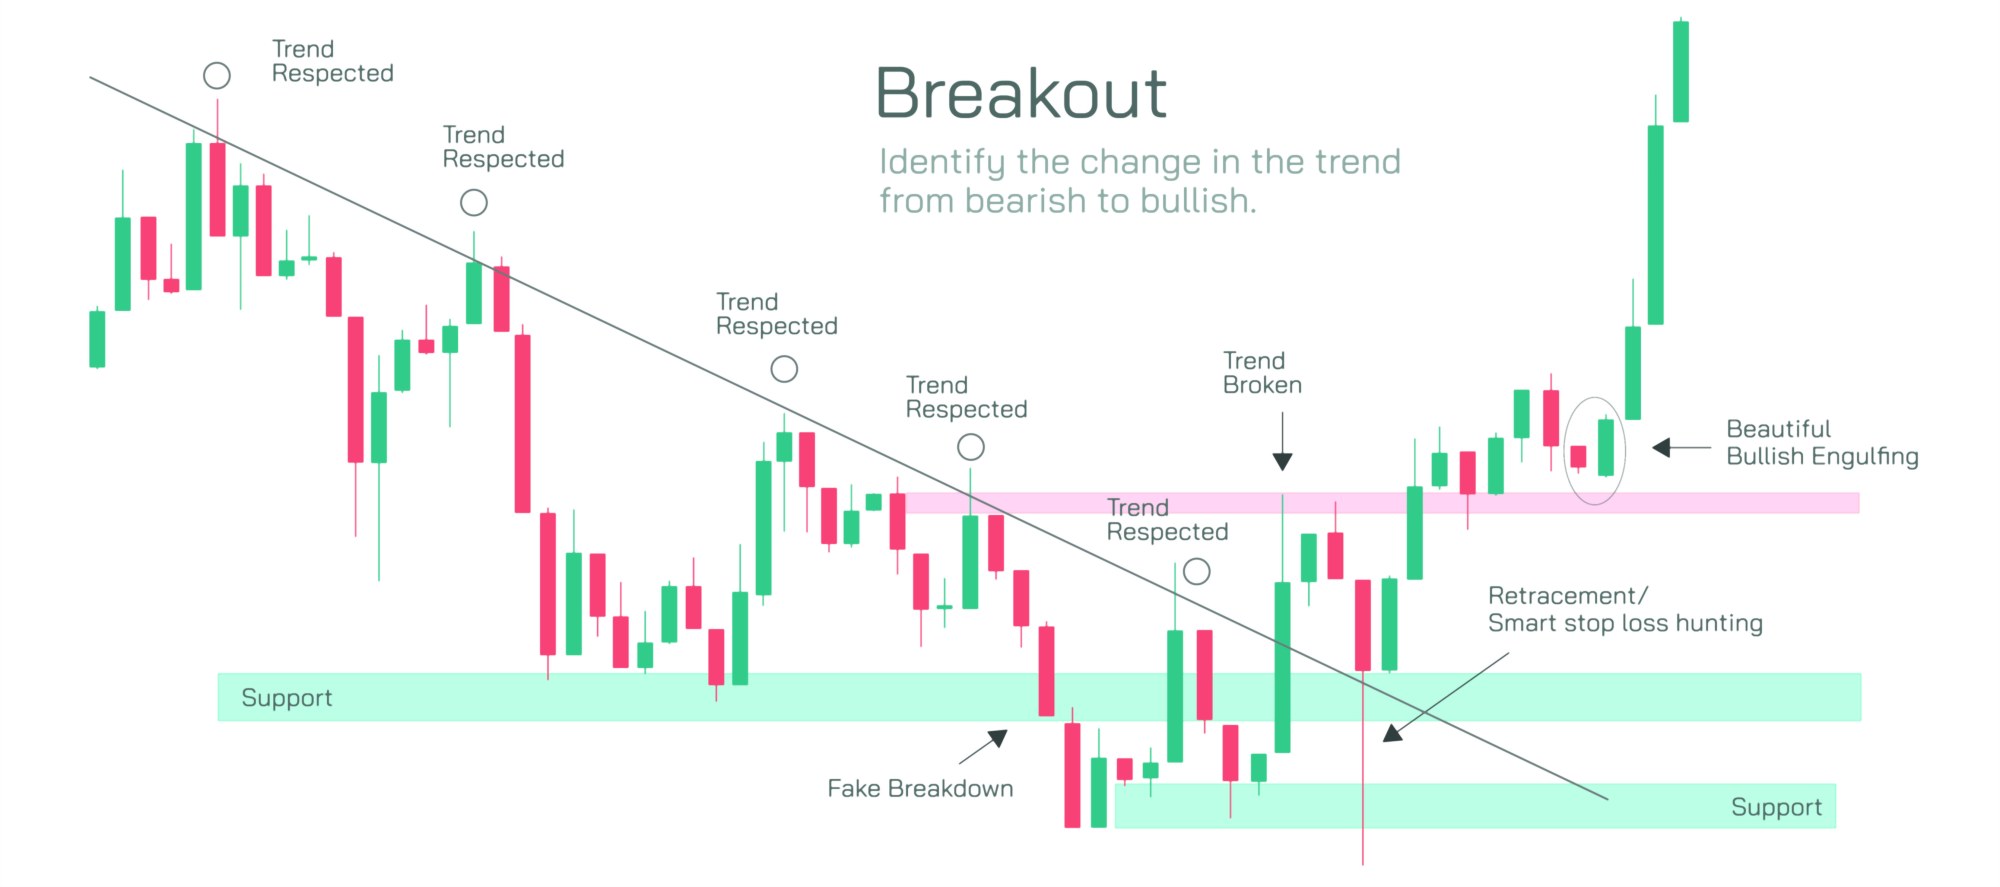
A breakout requires more than crossing a boundary. It needs convincing movement supported by activity. When price pushes through a limit with increased energy, the shift becomes meaningful. Activity helps confirm that the new move has participation from strong hands. Without this participation, the break may lack strength and return quickly. This return is known as a failed break, which often forms traps. A successful break, however, continues with follow-through as the next waves show aligned behavior. This alignment strengthens confidence in the new direction.
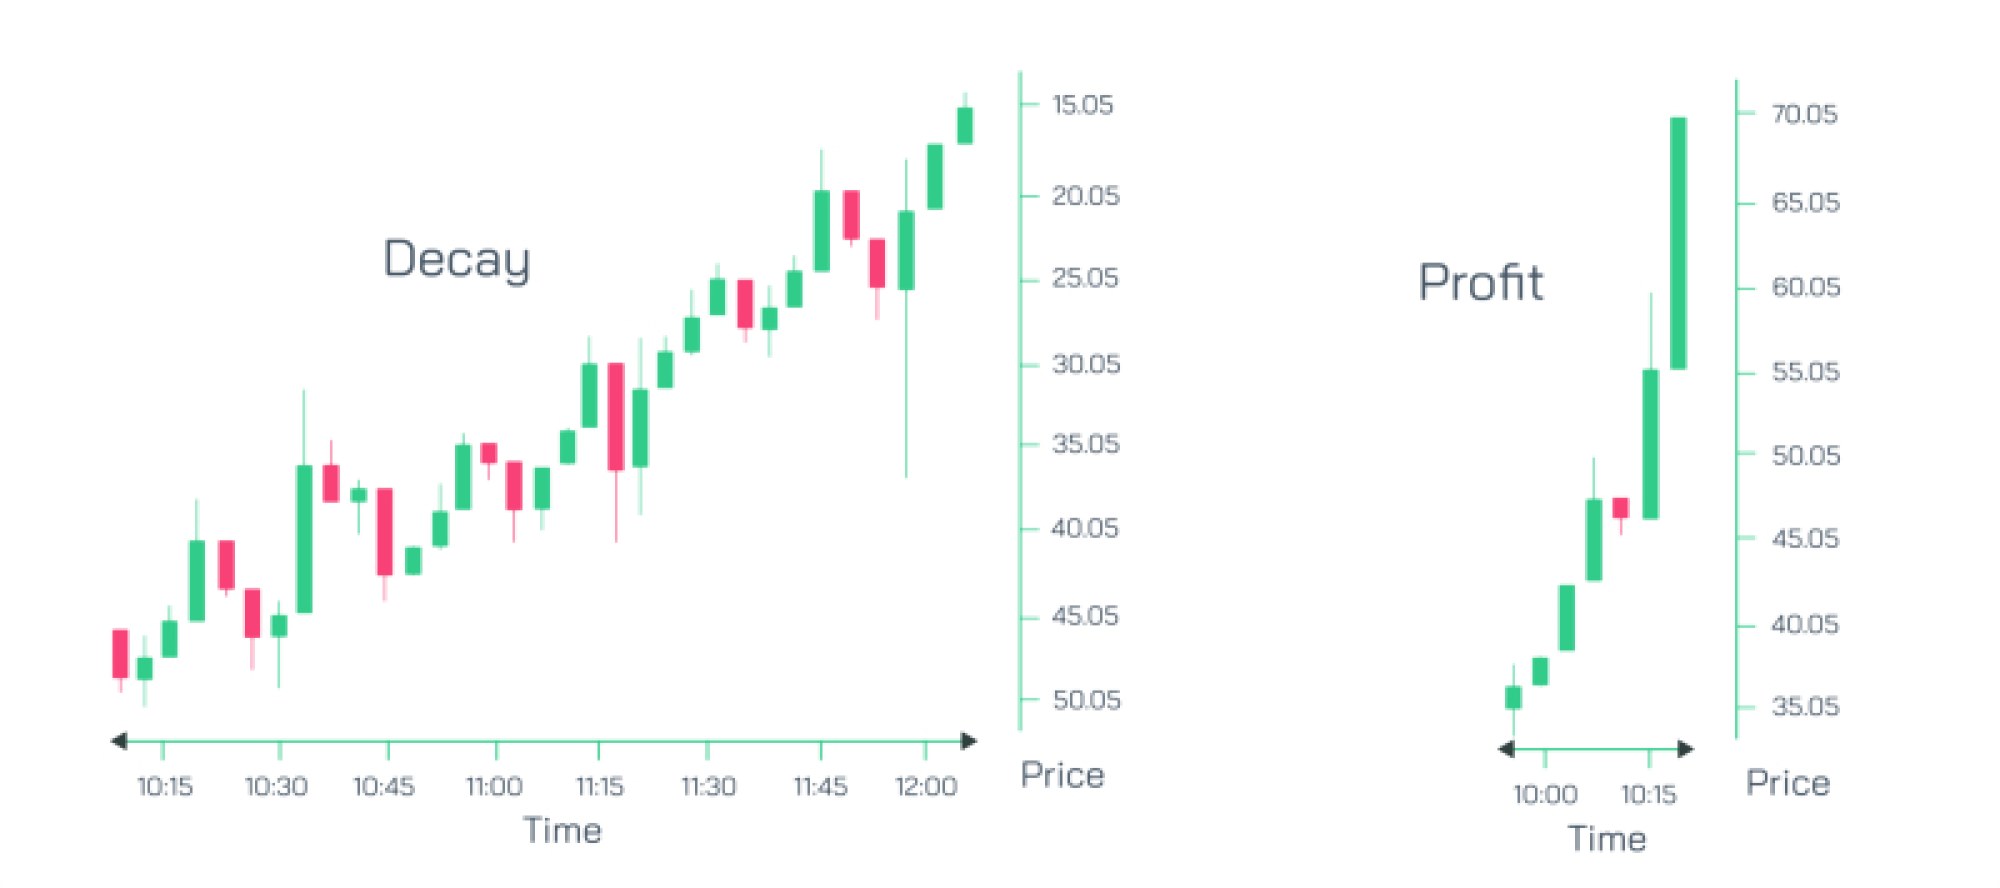
Another important aspect is the buildup before the break. As waves compress, they create tension within the region. This tension is visible through narrowing swings and changes in activity during each wave. The structure becomes tight, and the space between waves reduces. This compression phase is essential because it indicates preparation. When compression aligns with strengthening activity near the boundary, the probability of a powerful move increases considerably. Observers can watch for repeated tests, stronger bars near the edge, and reduced space between waves. These clues often precede expansion.
After the break, price usually enters a new environment. The region that once held movement now becomes a reference area. In many cases, price returns briefly to that zone. This return helps confirm the shift by testing whether the region can support the new direction. If the region holds, it becomes a foundation for continued movement. Such tests demonstrate control by the side that initiated the break. This behavior reinforces confidence and reduces uncertainty about the next segment of movement.
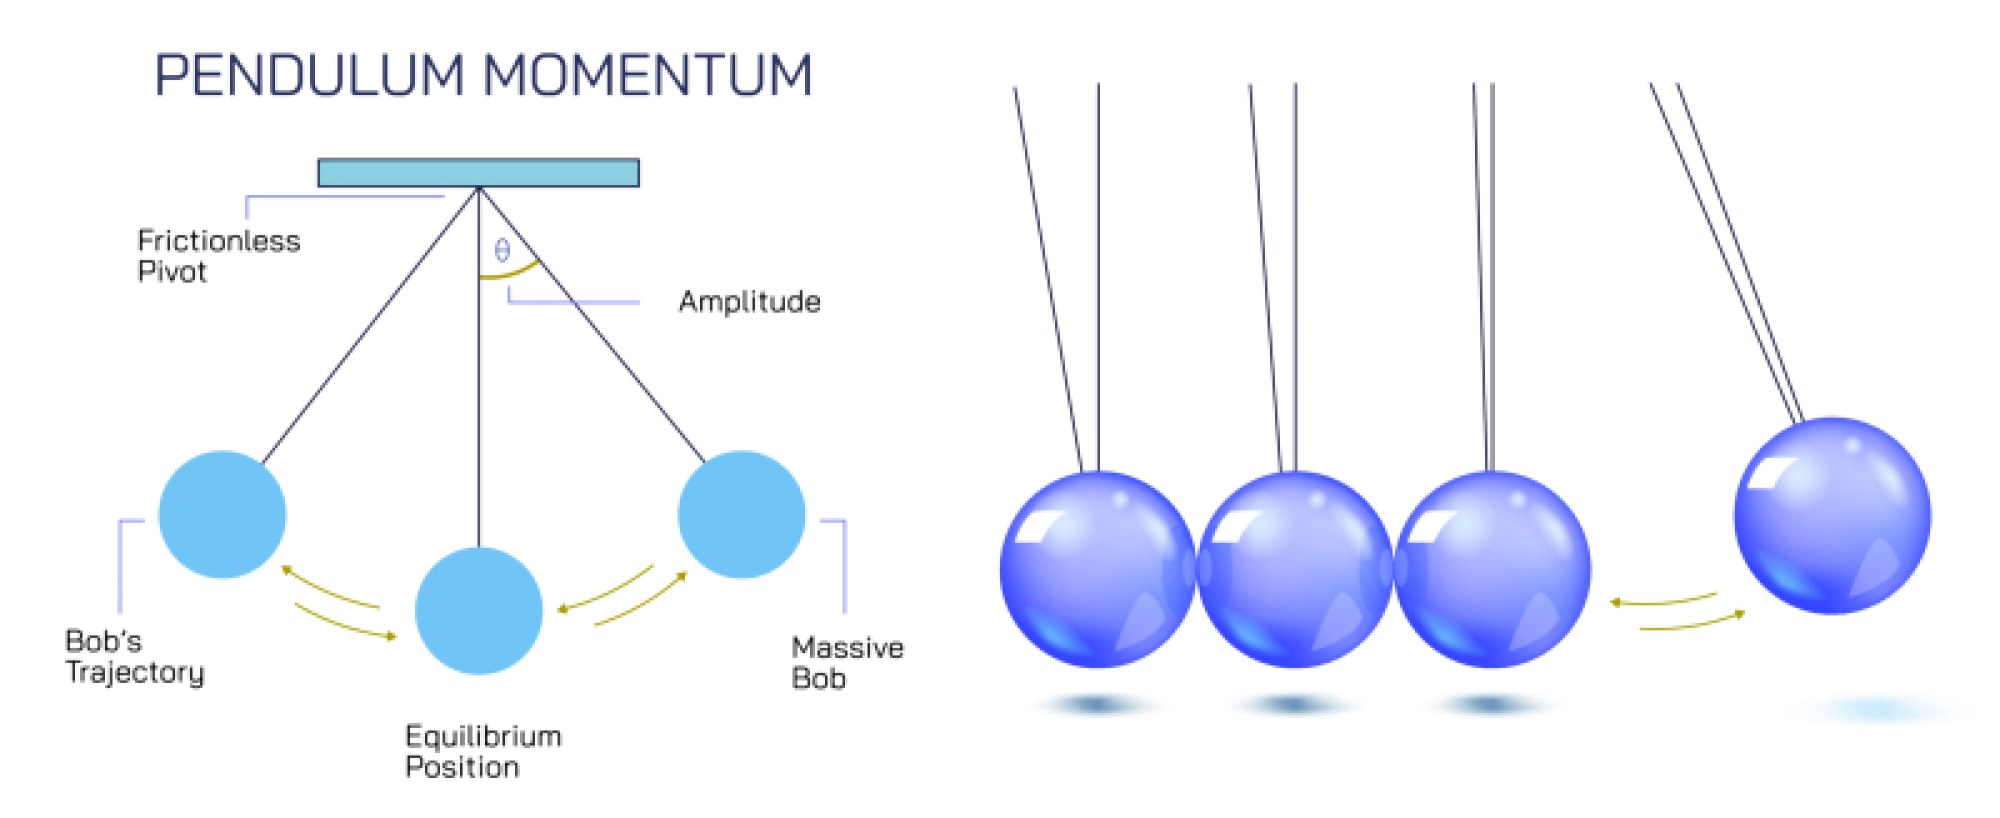
Momentum plays a major role in assessing strength. When the break occurs with clear acceleration, the environment favors continuation. When the break happens with muted movement, the environment may lack commitment. Reading this difference helps avoid acting on weak shifts. Volume also contributes to understanding strength. Increased activity during the break signals broader involvement. When activity is absent, the move may rely on limited participation. Both momentum and activity help differentiate genuine shifts from temporary pushes.
The broader context surrounding the pattern adds depth. When the pattern forms after a long advance, a break upward may require extra confirmation. When the pattern forms after a decline, the break upward may show beginning recovery. Observing where the structure sits within the larger landscape allows the observer to understand how the breakout fits into the overall journey of price. Context reduces noise and helps frame expectations.
Chart pattern breakouts continue to be widely studied because they capture the shift from balance to expansion. They illustrate how waves gather energy, how boundaries guide movement, and how fresh direction emerges. By learning to read structure, activity, and momentum together, traders gain a more complete understanding of how expansion unfolds and why certain breaks lead to strong moves while others reverse quickly. The clarity gained from studying these elements helps refine timing, improve recognition, and strengthen decision-making across different environments.