Wyckoff Logic Behind Accumulation and Distribution
Richard Wyckoff’s framework offers one of the most structured ways to understand how large operators influence price movement. Instead of treating charts as random waves, the method examines how shifts in demand, supply, and participation create recognizable patterns. These patterns help explain why certain areas become turning points while others lead to expansion phases. Wyckoff placed strong emphasis on how volume interacts with price, and how these clues reveal the intentions of stronger hands guiding the broader direction.
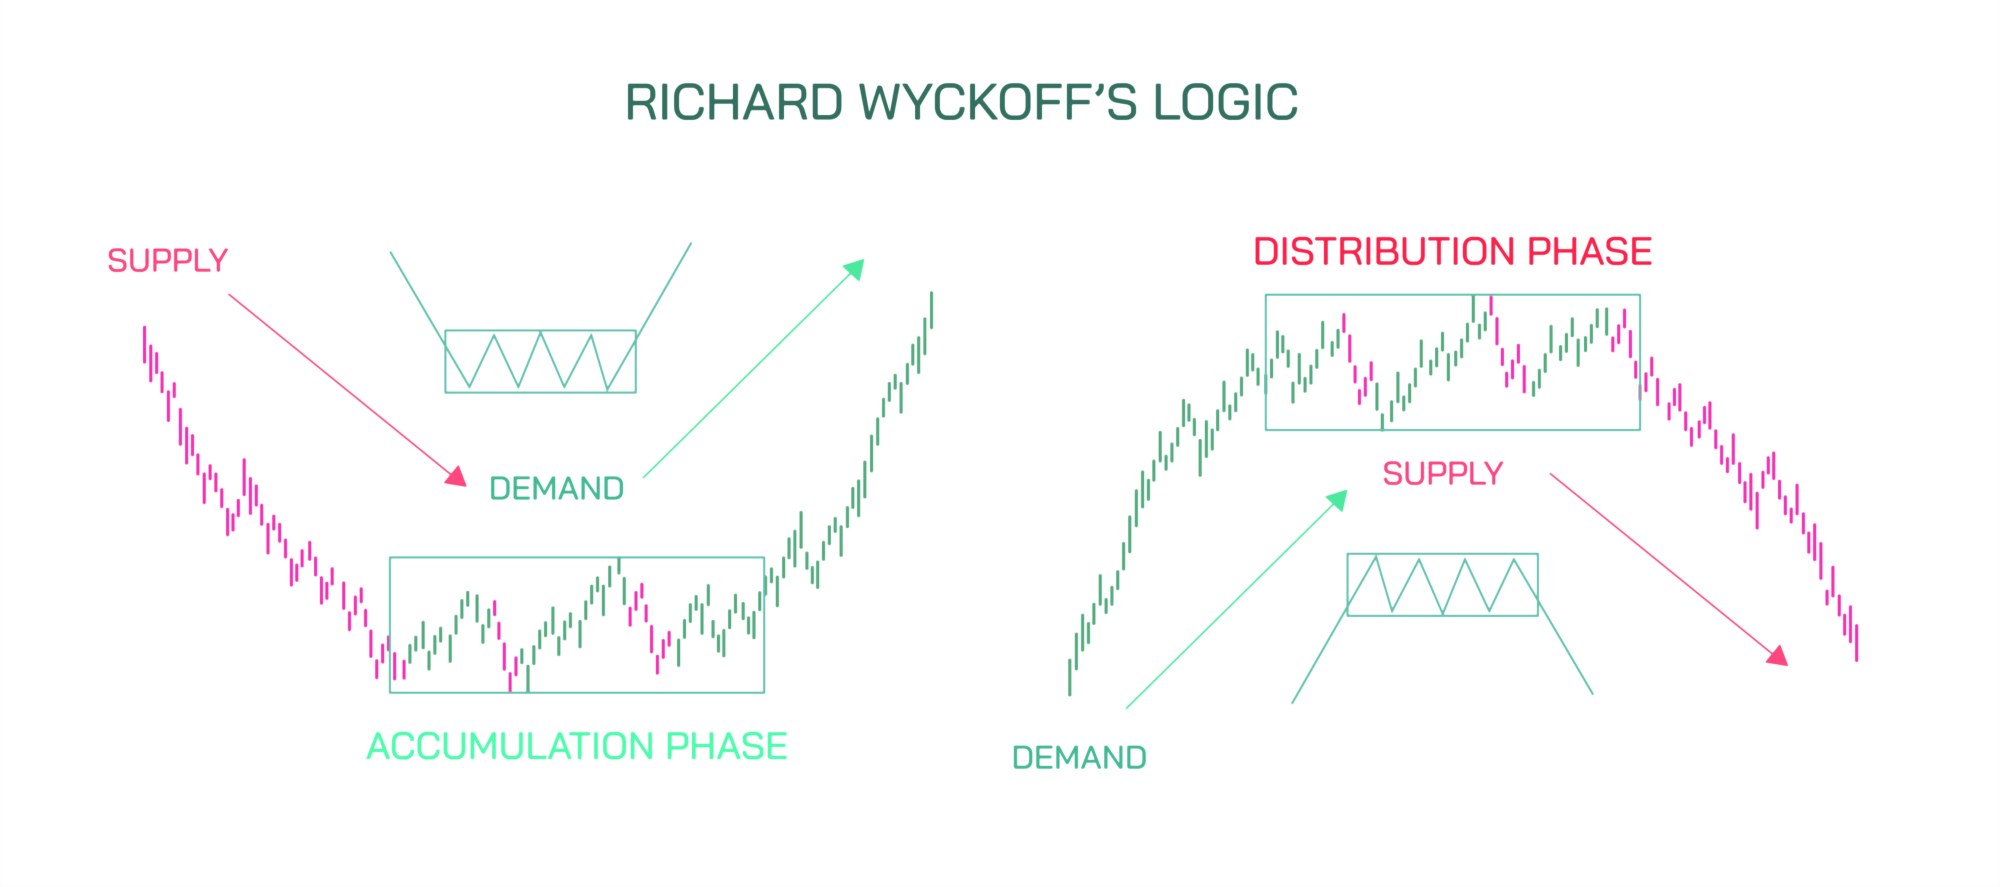
Accumulation begins at levels where stronger participants quietly build positions. This usually takes place after an extended decline, when weaker holders exit due to fear or exhaustion. During this stage, the chart often moves within a tight region, forming a relatively stable floor. Activity within the range shows varied bursts of movement, but most waves remain controlled. Volume behaviors reveal whether strong participants are absorbing supply. As the structure matures, price attempts to leave the region but often returns for additional tests. Each test helps confirm readiness for a move toward higher zones.
Distribution, on the other hand, represents a controlled release of holdings by stronger participants after a long advance. It mirrors accumulation in structure but reverses the internal logic. Instead of absorbing supply, stronger hands gradually unload positions into eager late entrants. During this process, the waves become increasingly choppy. Small surges often meet heavy activity leading to failure, which is a typical sign of weakening control by buyers. Volume patterns begin to reveal pressure from the opposite side, indicating that the region is evolving into a transition.
Wyckoff’s central idea revolved around identifying phases. Each structure typically contains sequences that offer a clearer narrative of intent. In accumulation, early reactions show exhaustion from sellers, while mid-range activity focuses on absorption. Near the end, breakout attempts reveal a shift in control. In distribution, early stages show strength fading, while later stages highlight how efforts to advance begin failing repeatedly. These repeating characteristics allow analysts to map out a story instead of focusing solely on isolated patterns.
Understanding these structures helps a trader differentiate between normal pullbacks and deeper shifts. A wave inside a range may simply be part of routine activity, while another wave could reveal an important test or confirmation. Observing the interaction between movement and activity is essential, since subtle differences often distinguish a genuine shift from noise.
Another significant aspect of Wyckoff’s logic is the role of the composite operator, a conceptual entity representing the organized force acting behind many waves. The chart is viewed not as a random outcome of countless participants, but as a reflection of deliberate actions by those with the ability to guide behavior. By interpreting each segment of movement, one can understand how this force gradually increases or decreases involvement.
The value of Wyckoff’s method is found in its structure. Instead of predicting based on isolated shapes or indicators, the method relies on a coherent storyline: initial weakening, preparation, testing, confirmation, and expansion. Both accumulation and distribution share this logic but lead to opposite outcomes. Recognizing these stages can guide expectations, improve timing, and help avoid acting against stronger forces.
Wyckoff’s principles remain widely used because they reveal how preparation precedes movement. Trends do not begin without groundwork, nor do they collapse without warning signs. By learning to read the narrative encoded in movement and activity, observers gain a deeper understanding of market behavior across different environments.