Comprehensive Overview of a 3D Demand and Supply Illustrator Graphic
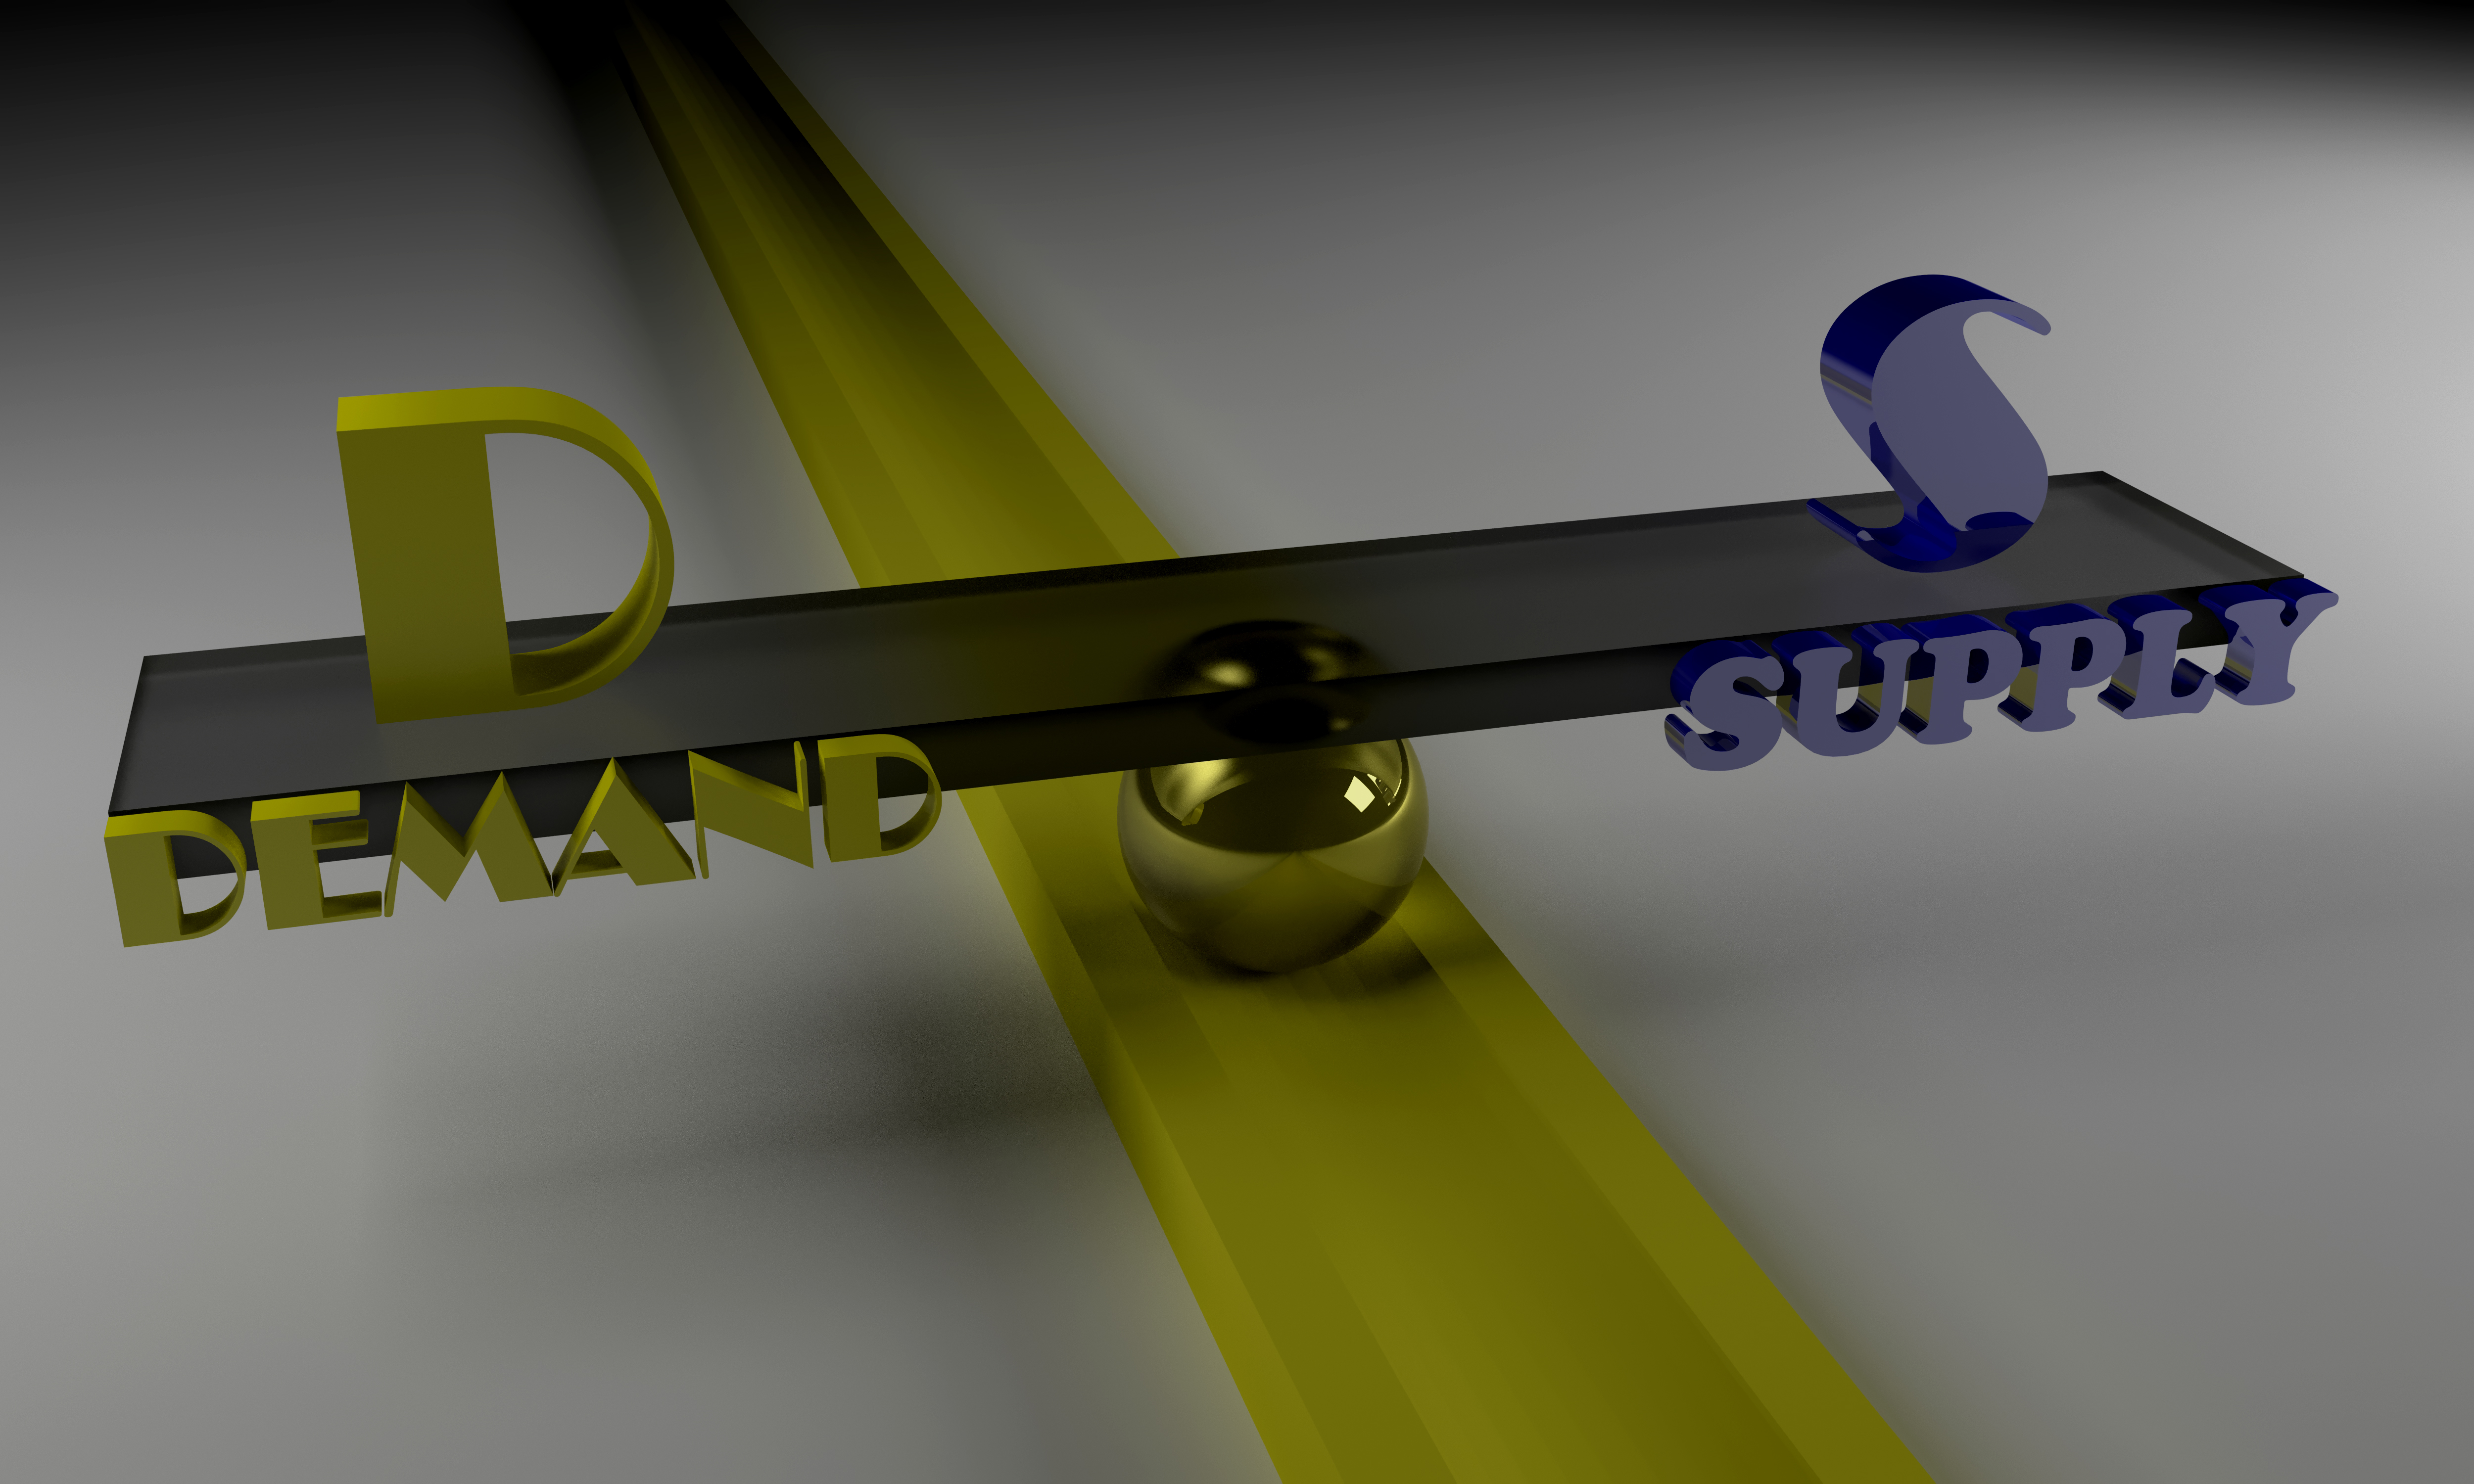
A 3D demand and supply illustrator graphic brings economic interaction to life by presenting key market elements through a visually engaging scene. Instead of relying only on standard flat artwork, this type of visual enriches understanding by projecting lines, surfaces, and axes in depth. The enhanced appearance supports students, educators, and creators who want to clarify basic principles through clear spatial contrast. A structured design allows viewers to examine how changing conditions influence the relationship shown by the intersecting curves. The bright perspective and refined layout create a scene suitable for presentations, videos, print material, or classroom demonstrations.
The foundation of the diagram contains two primary curves represented with enhanced dimensional form. The first line typically slopes downward, illustrating how buyers respond to different price points. Lower levels encourage greater interest, while higher levels reduce interest. The second line generally slopes upward, expressing how producers respond to changing conditions. When levels rise, providers become more active. The 3D version heightens the overall clarity by giving each line thickness, shadow, and separation from the axes. The viewer can easily interpret the direction and intention because each component exists in a space rather than a plane.
Another central part of the illustration is the point where the two lines intersect. This location signals balanced activity between participants, where neither side dominates. Presenting this meeting in depth gives creators the opportunity to emphasize its importance. Highlighting the location by enlarging, glowing, or lifting the area assists learners who may not immediately grasp the concept in traditional drawings. The surrounding grid and axis system also gain strength from three-dimensional style. Raised tick marks, extended base lines, and layered backgrounds generate clarity for readings and labels.
Such a graphic also supports demonstration of shifts. By moving the lines left, right, up, or down, the designer can show how conditions change. A 3D environment makes these shifts more intuitive because the viewer perceives genuine motion in space. This helps explain events such as increased interest, reduced interest, expanded production, or limited production. Teachers often use these scenes in animated form, where the lines glide smoothly to new positions. The extra depth aids comprehension when learners compare the original placement with the new one.
Creators using design tools can adjust tone, lighting, arrangement, and texture to match the style needed for their project. Smooth gradients or metallic surfaces enhance documentary films, while flat shading supports textbook pages. Business presentations often prefer bright color sets to separate each element clearly. Because the graphic is typically crafted as vector art, scaling does not reduce quality. This flexibility allows the diagram to appear in small website widgets or large poster layouts without distortion.
The 3D demand and supply illustrator is also valuable for digital educators who want interactive content. In many platforms, users can rotate the scene, zoom in, or highlight singular components. This interaction nurtures deeper involvement and transforms static theory into a tactile experience. Animators appreciate the ease with which they can transition between views or emphasize sections by adjusting camera angle, lighting, or focus.
Overall, this style of diagram transforms a foundational economic idea into a vivid model that is easier to interpret, more appealing visually, and more effective for teaching. The layered environment supports stronger memory retention by giving each part spatial identity. Whether used in schools, professional presentations, or online learning spaces, the 3D version improves clarity, engagement, and accuracy while maintaining the underlying principles of the topic.