Topographic Map Reading — Contour Lines, Elevation, and Terrain Interpretation Explained
A topographic map is a specialized representation of the Earth’s surface that reveals the three-dimensional shape of the land on a flat sheet, allowing a viewer to visualize elevation, slopes, valleys, plateaus, hills, and mountains even without physically being there. Unlike ordinary road or political maps that show only boundaries, transport links, and human settlements, a topographic map emphasizes the physical layout and height of the land using a symbolic language rooted in contour lines. These fine lines, drawn across the surface of the map, connect points of equal elevation and form the core of terrain interpretation. When understood correctly, contour patterns allow a user to imagine the rise and fall of the land, determine travel difficulty, locate water flow and drainage, identify ridges and depressions, and plan safe and efficient routes for hiking, engineering, construction, and military navigation. Topography transforms a flat map into a mental 3D model, and the ability to read it—through contour spacing, elevation numbers, slope gradient, and landmark patterns—turns the map into a powerful tool for spatial awareness and environmental planning.
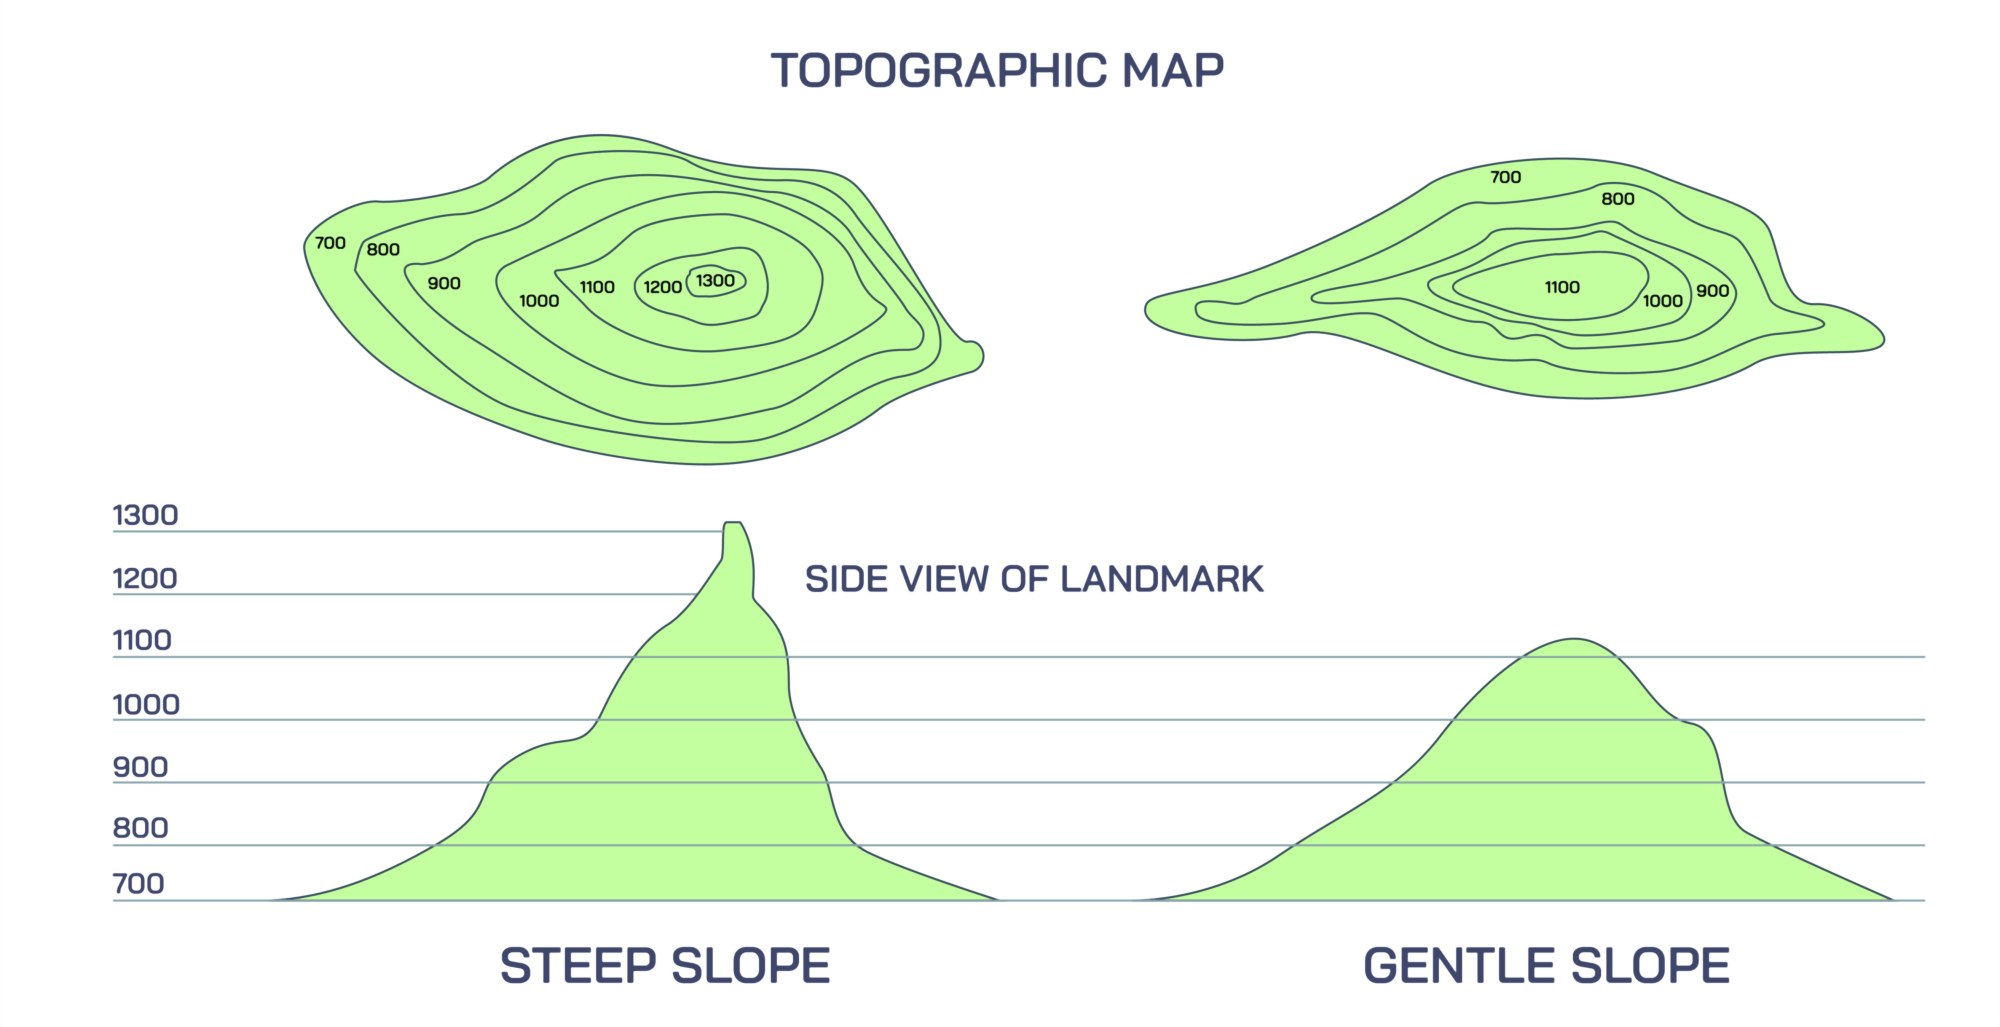
At the heart of topographic map reading lies the concept of contour lines, each of which connects all points of identical elevation above sea level. When all these lines are drawn across the terrain, they form an abstract depiction of its shape. Contour lines never intersect or branch because a single location cannot possess two elevations simultaneously; the only exception is vertical overhangs and cliffs, which are rare and shown with special marks. The contour interval—the vertical distance separating successive contour lines—remains consistent throughout the map and is printed in the map legend. A small contour interval results in very detailed elevation representation for low-relief regions, while a large interval is more useful for mountainous areas. By studying the distance between contour lines, one can determine slope steepness: closely spaced lines represent steep slopes, while widely spaced lines represent gentle slopes. Flat plains form large spaces without many lines, whereas cliffs form extremely compressed contours. By observing contour irregularities, it becomes possible to detect saddle points, plateaus, ridges, and depressions in an intuitive way, turning symbolic curves into a visual terrain model in the mind of the map reader.
Elevation interpretation expands upon contour structure by adding numerical value to the terrain. Most contour lines carry printed elevation labels that serve as reference anchors, and every fifth line may be drawn bolder and labeled as an index contour for quick orientation. By tracing the direction of increasing numbers, a viewer can determine whether the land rises or falls. If numbers grow higher toward the interior of a closed contour loop, it represents a hill or mountain peak; if the numbers decrease, it forms a basin or depression. Depressions are often highlighted by hachured contour lines—short inward-pointing tick marks that differentiate them from hills. Elevation readings also reveal watershed characteristics: water flows downhill, perpendicular to contour lines, and V-shaped patterns that point uphill usually indicate valleys or stream channels, whereas V-shapes that point downhill reveal ridges. The elevation structure of the map therefore communicates not only height but also movement and drainage direction, essential information when predicting river courses, designing infrastructure, or planning search-and-rescue or hiking routes.
Terrain interpretation brings together slope steepness, contour direction, and elevation to form a full picture of landform behavior. A series of concentric loops with rapidly increasing elevations indicates a sharply rising mountain, while gentle concentric spacing suggests a rolling hill. Long contours running parallel and close together along one side but spreading out on the opposite side signal an asymmetrical slope. Saddle regions, which are the passes between two high points, appear when two high-elevation loops lie close with shallower contours between them, forming an hourglass pattern. Ridges appear as elongated regions of higher ground where contours point downhill on both sides, while valleys display contours pointing uphill, identifying the channel carved by water flow. Terraces are visible when successive contours form step-like shapes, representing flat platforms separated by steep sections. When an individual gains skill in reading these contour shapes, the map ceases to be abstract; it becomes an interpretive landscape where subtle geometry reveals landform history and future behavior.
In addition to contour interpretation, topographic maps integrate man-made and natural features to enhance orientation and field usability. Symbols indicate rivers, lakes, forests, wetlands, cliffs, glaciers, roads, trails, towns, transmission lines, mines, campgrounds, and other landmarks. Roads may follow contour trends to show gradual elevation changes, while hiking trails commonly trace valleys and ridges depending on terrain difficulty. When combined with contour patterns, these features allow the user to anticipate visibility, choose safe paths, and detect potential hazards such as landslide-prone slopes, flood plains, or unstable cliffs. Understanding where steep climbs, switchbacks, and safe water sources exist becomes possible even without GPS, making topography indispensable for wilderness travelers, field scientists, engineers, and surveyors.
Reading direction and orientation also plays a crucial role in topographic map interpretation. Most maps are centered on true north at the top, with grid lines and compass declination information helping users align the map with actual terrain. Once aligned, contour lines visually match the surrounding hills, valleys, and slopes. Skilled readers compare their observed surroundings to map features—ridge outlines, high points, drainages, and road curvature—to pinpoint their geographic location. This feedback loop between map and environment makes it possible to correct navigation errors long before they become dangerous. Even in modern times, when digital devices dominate navigation, topographic map reading remains indispensable because it builds an internal model of terrain, preventing blind reliance on technology and ensuring safety when electronic systems fail.
Topographic mapping has deep real-world implications beyond recreation. Engineers rely on contour and elevation interpretation when designing roads, reservoirs, power projects, and foundations to ensure safe and efficient shaping of land to human needs. Geologists use topographic patterns to identify structural formations, slopes vulnerable to erosion, and potential landslide zones. Hydrologists study contour-driven watershed pathways to determine where water accumulates and where floods or aquifer recharge will occur. Urban planners evaluate topography before zoning to avoid building on unstable terrain. Military operations depend on topographic interpretation to determine tactical advantage, movement speed, line-of-sight visibility, and defensible terrain. Through all these fields, the same symbolic language of contour spacing, slope orientation, and elevation enables professionals to read the land as if standing above it with a bird’s-eye perspective.
Ultimately, topographic map reading is the art of transforming symbolic lines into a physical world model. Contours record the terrain’s memory—the rise of mountains, the carving of valleys, and the gentle shaping of plains. Elevation values quantify these changes and translate them into measurable data. Terrain interpretation synthesizes these insights so that users can visualize slopes, identify landforms, predict water flow, and safely navigate or plan development. Once mastered, topography becomes intuitive; the reader no longer sees ink on paper but a three-dimensional landscape with peaks, depressions, passes, ridges, and flowing rivers. It is this ability to mentally reconstruct physical space from two-dimensional markings that gives the topographic map its enduring value—a tool not only for guidance but for understanding the complex shape and behavior of the Earth’s surface.