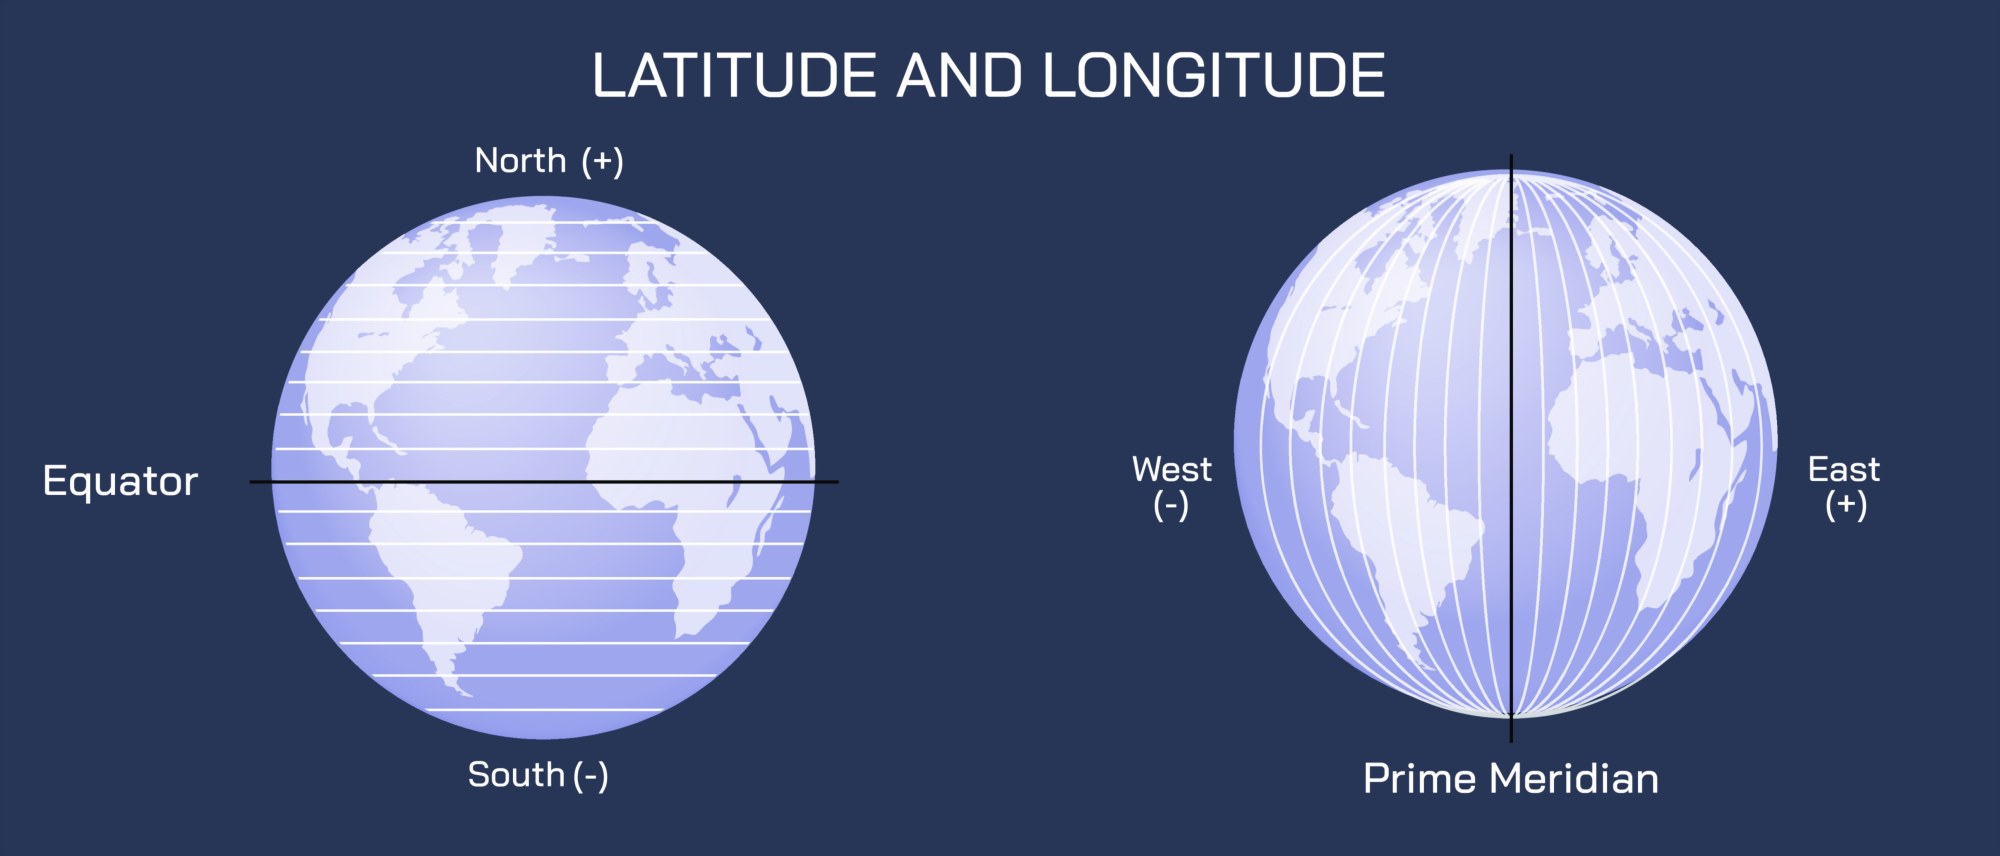
Longitude and Latitude Vector Illustration Showing Earth’s Coordinate System, Parallels, Meridians, and Global Mapping Concept
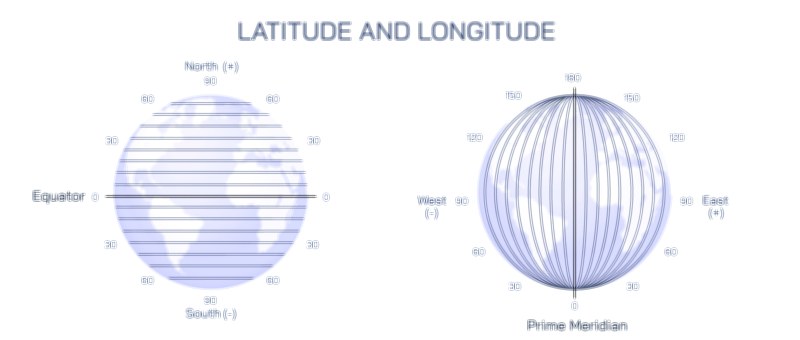
Longitude and latitude are the foundational components of Earth’s geographic coordinate system, enabling accurate positioning, navigation, and mapping across the globe. Latitude lines, or parallels, run horizontally and indicate north-south position relative to the Equator, while longitude lines, or meridians, run vertically, denoting east-west position relative to the Prime Meridian. A vector illustration depicting longitude and latitude typically integrates a 3D globe, horizontal and vertical lines, labeled coordinates, and spatial orientation arrows, providing a clear, visually engaging representation of global positioning concepts. By combining labeled parallels, meridians, and key geographic references, such illustrations allow learners to intuitively understand Earth’s coordinate framework and its applications in navigation, cartography, and geospatial science.
At the center of the illustration is a 3D globe, often rendered in a perspective view to emphasize curvature and spatial depth. The globe displays continents and oceans in muted colors, serving as a recognizable reference without overpowering coordinate lines. Latitude and longitude lines are overlaid, with distinct color coding: horizontal parallels in blue and vertical meridians in red, providing immediate visual differentiation between the two types of coordinates. Labels identify key reference lines, such as the Equator (0° latitude), Tropic of Cancer, Tropic of Capricorn, Arctic Circle, Antarctic Circle, and Prime Meridian (0° longitude), allowing learners to correlate lines with major global markers.
Latitude lines are illustrated as evenly spaced horizontal circles wrapping around the globe. Arrows indicate northward and southward movement from the Equator, with corresponding degree labels (e.g., 30°N, 45°S). Insets may highlight hemispheres and polar regions, showing how latitude determines climate zones, day length variation, and solar incidence. The illustration may include color-coded bands to indicate the tropical, temperate, and polar regions, linking latitude to environmental and climatic phenomena.
Longitude lines are depicted as converging vertical arcs meeting at the poles. Arrows illustrate eastward and westward direction from the Prime Meridian, with degree labels (e.g., 60°E, 120°W). Insets may show global positioning and the relationship between longitude and time zones, connecting geographic coordinates to practical applications in navigation and international timekeeping. Color-coding distinguishes meridians from parallels, visually emphasizing the orthogonal nature of the coordinate grid.
Vector illustrations often include intersection points of latitude and longitude, labeled as specific coordinates (e.g., 40°N, 74°W) to demonstrate how any location on Earth can be uniquely identified. Arrows or magnified markers may indicate the method of plotting a point using both a parallel and a meridian, visually linking abstract numerical coordinates to concrete positions on the globe. These intersections may be highlighted with circles, dots, or glowing markers for clarity.
Additional features may include rotation and orientation indicators, such as arrows showing Earth’s rotation from west to east and the tilt of the axis. Labels may indicate the North and South Poles, the Equatorial plane, and lines of longitude used as reference meridians for global navigation. Magnified insets may demonstrate the curvature of meridians converging at the poles, helping learners understand the geometric principles behind spherical coordinates.
The illustration may also include maps or flat projections adjacent to the globe, such as Mercator or Robinson projections, showing how latitude and longitude lines translate from a 3D sphere to 2D maps. Arrows indicate the correspondence between meridians and parallels on the globe and their representation on flat maps, emphasizing the practical application of coordinates in cartography. Labels clarify distortions in scale and area inherent in map projections while reinforcing the accuracy of global positioning systems.
Vector diagrams often include directional guides and legends. Color-coded lines, labeled degrees, and directional arrows provide reference for north, south, east, and west, ensuring learners can quickly interpret coordinate values. Insets may provide examples of plotting cities or landmarks, demonstrating practical use in navigation, GPS, and geospatial analysis.
By combining 3D globe, latitude and longitude lines, labeled parallels and meridians, intersection points, hemispheres, and map projections, a vector illustration of Earth’s coordinate system provides a thorough, visually intuitive understanding of global positioning. Color coding, directional arrows, and labeled reference lines allow learners to visualize the orthogonal grid and understand how numerical coordinates correspond to real-world locations.
Ultimately, a longitude and latitude vector illustration demonstrates the precision and utility of Earth’s coordinate system, linking mathematical concepts of spherical geometry to practical applications in navigation, mapping, and geospatial science. Through labeled parallels, meridians, intersection points, and directional guides, the diagram transforms abstract geographic coordinates into an educational, visually engaging, and intuitive tool for learners of geography, cartography, and Earth sciences.