Longitude and Latitude Vector Illustration Showing Global Coordinate System, Earth Grid, and Geographic Location Mapping
Longitude and latitude form the fundamental global coordinate system used to precisely locate any point on the Earth’s surface. These geographic coordinates are essential in navigation, cartography, geolocation, and geographic information systems (GIS). A vector illustration depicting longitude and latitude typically integrates a 3D or spherical representation of the Earth, meridians, parallels, and location markers, providing a clear visual framework for understanding how the coordinate system works. By combining labeled lines, directional cues, and mapping examples, such illustrations make abstract geographic concepts intuitive and educational.
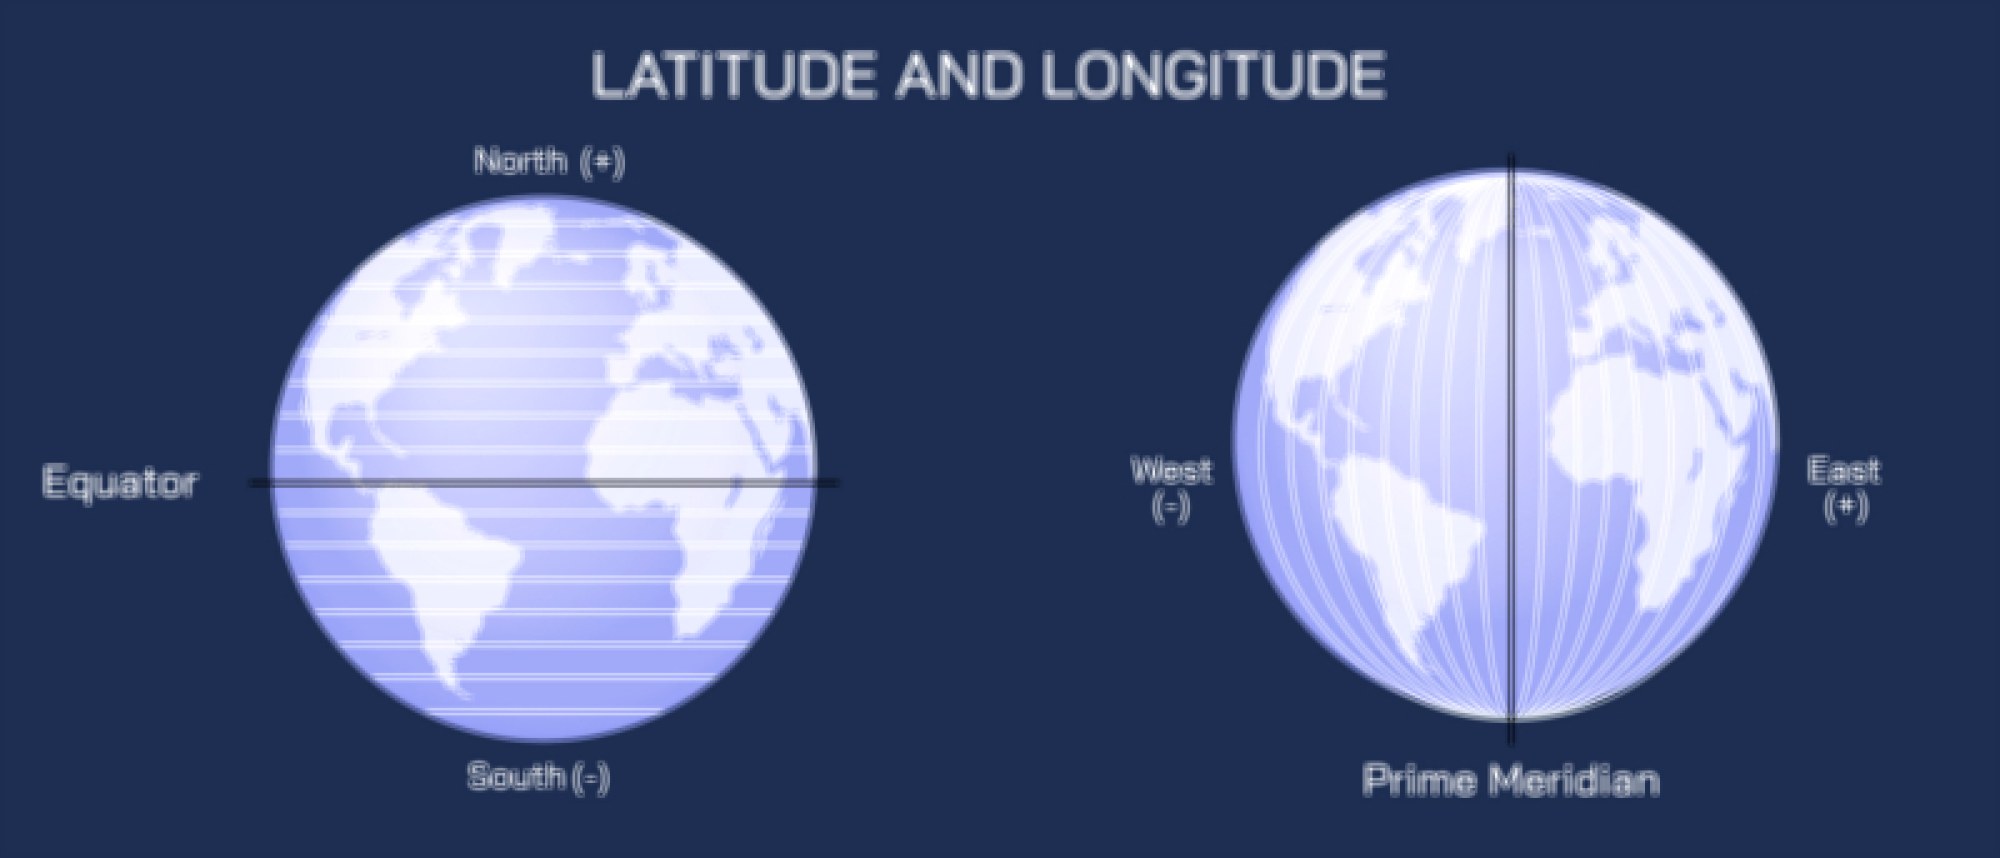
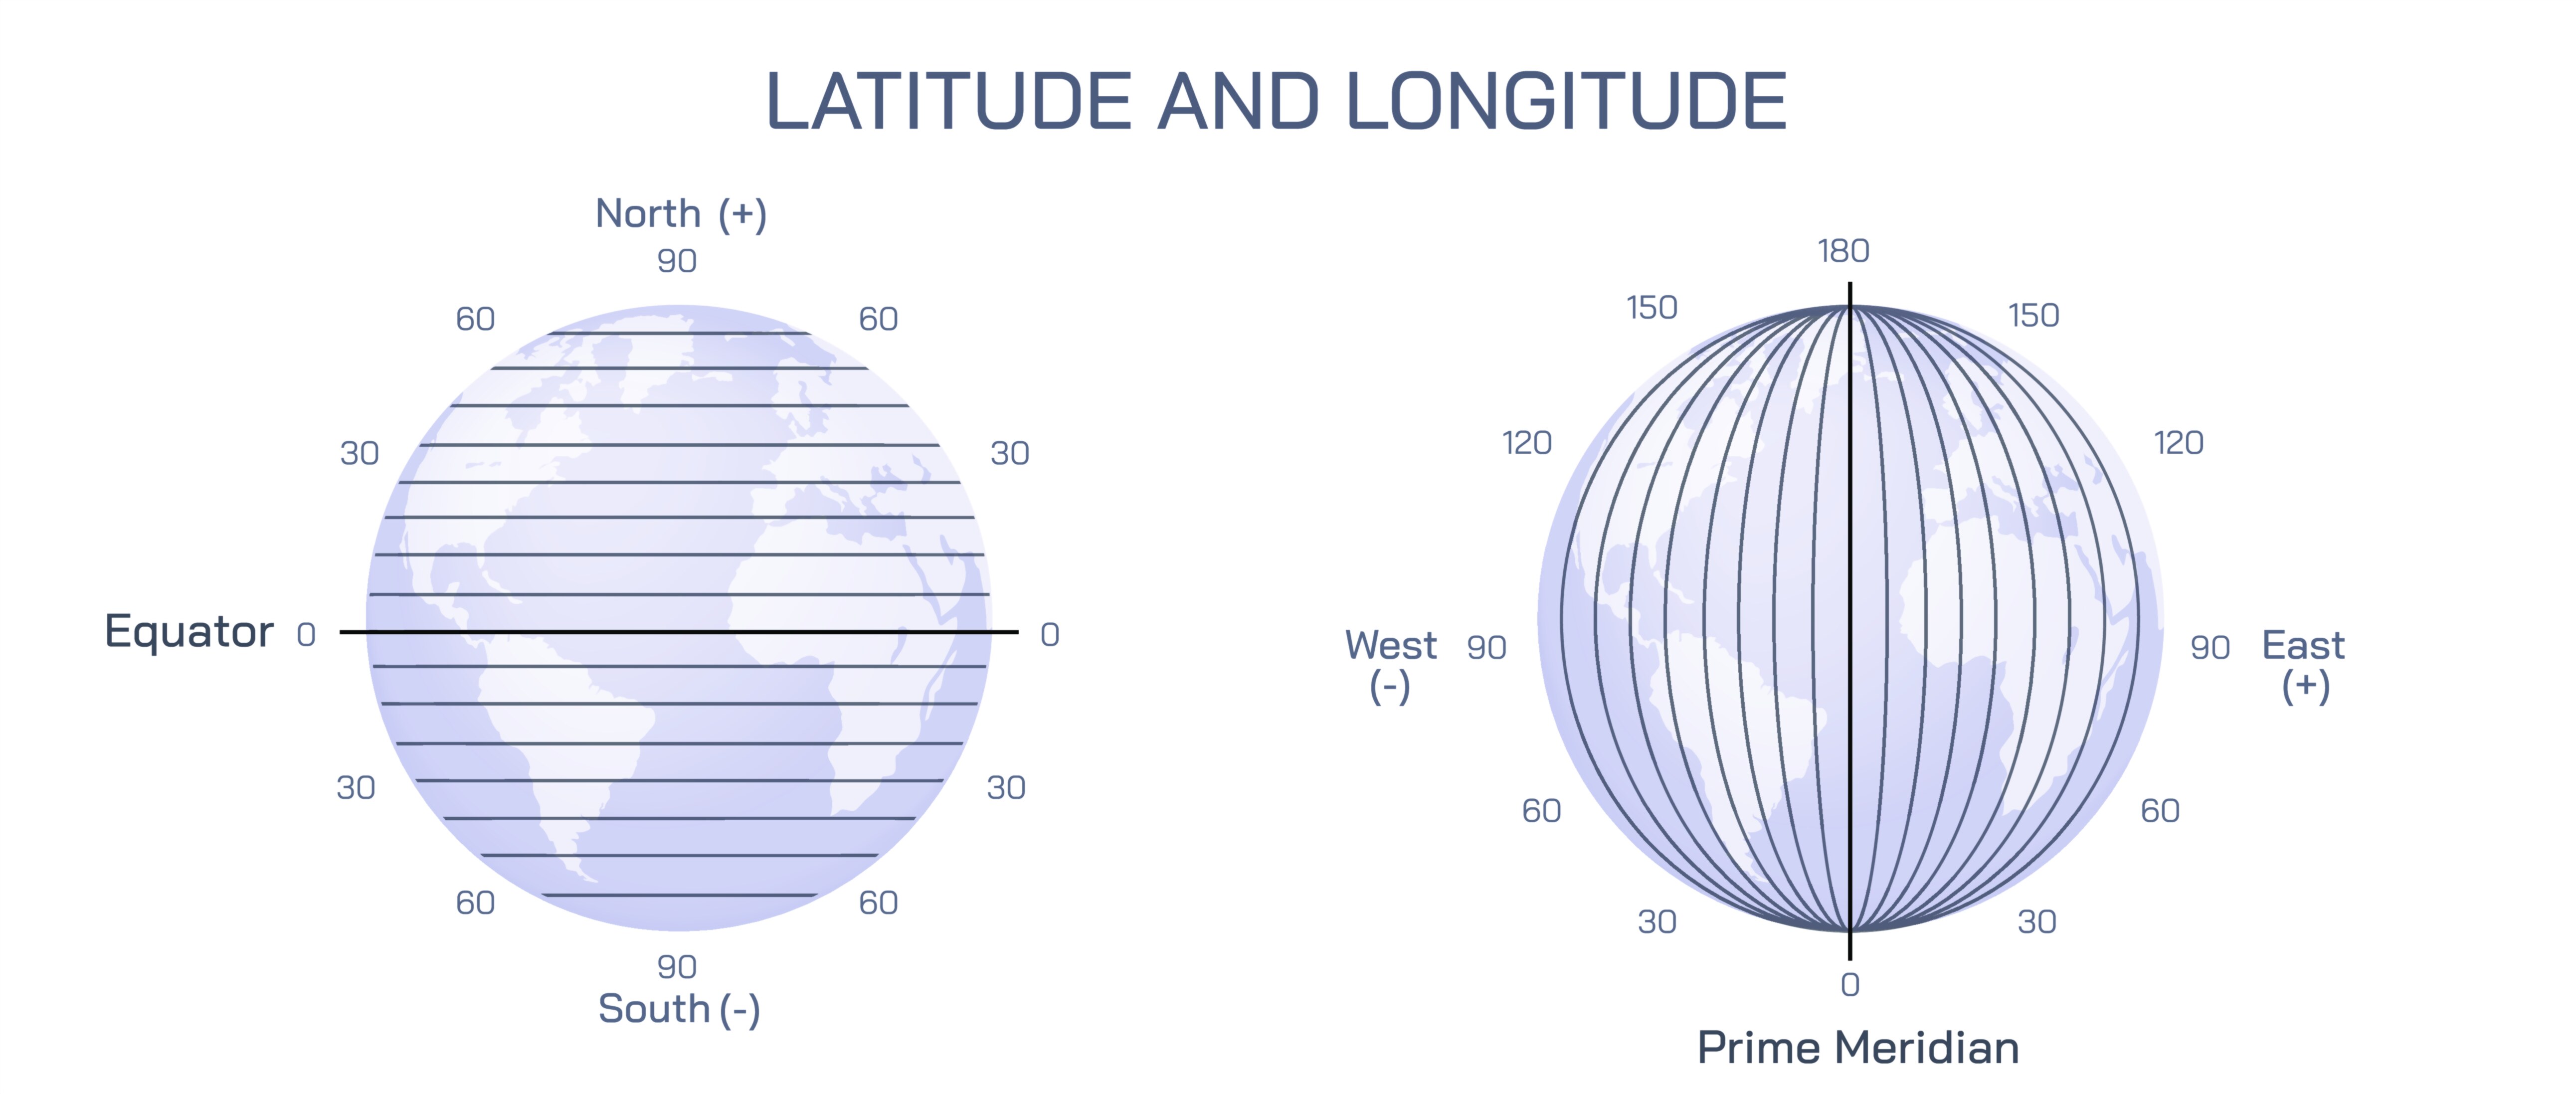
At the core of the illustration is the Earth as a sphere, often represented in either 3D perspective or a simplified globe view. The equator, which divides the Earth into Northern and Southern Hemispheres, is prominently labeled and often highlighted in color or thickness to differentiate it from other latitude lines. Parallels, representing lines of constant latitude, are depicted as horizontal circles encircling the globe parallel to the equator. Each parallel is labeled with its corresponding degree, such as 0° at the equator, 23.5°N at the Tropic of Cancer, 23.5°S at the Tropic of Capricorn, 66.5°N at the Arctic Circle, and 66.5°S at the Antarctic Circle, providing reference points for understanding latitude distribution and Earth’s climatic zones.
Meridians, representing lines of constant longitude, are illustrated as vertical arcs connecting the North and South Poles. The prime meridian (0° longitude), passing through Greenwich, England, is highlighted and labeled to establish the reference for eastern and western hemispheres. Additional meridians are marked at regular intervals (e.g., every 15°) to demonstrate how the Earth is divided longitudinally, and arrows may indicate increasing degrees eastward and westward from the prime meridian. The poles themselves are labeled as convergence points of all meridians, emphasizing that longitude lines meet at the North and South Poles.
A key component of the vector illustration is the depiction of specific geographic locations using latitude and longitude coordinates. Points on the globe can be marked with dots or pins, with arrows or labels showing the corresponding coordinates. For example, a city such as New York may be labeled with 40.7°N latitude, 74.0°W longitude, visually demonstrating how these two angular measurements uniquely identify a location. Arrows extending from the parallels and meridians toward the location marker illustrate how the intersection of latitude and longitude determines the exact point on Earth’s surface.
Vector illustrations often include a grid overlay to emphasize the intersection of meridians and parallels. This grid shows the Earth divided into angular increments, making it easier to visualize distances between coordinates and the concept of geographic positioning. Shading or gradient fills may enhance the sense of 3D curvature, helping viewers perceive the spherical nature of the Earth while maintaining clarity of the coordinate system. Labeled axes for latitude (horizontal) and longitude (vertical) can provide additional guidance for learners interpreting the globe.
For educational clarity, vector diagrams may also include hemispheric and quadrant labeling, showing how the globe is divided into the Northern, Southern, Eastern, and Western Hemispheres. Color coding or transparency effects can differentiate these hemispheres and help learners understand directional orientation. For instance, the Northern Hemisphere may be shaded in one color, the Southern Hemisphere in another, while the prime meridian separates the Eastern and Western Hemispheres. Arrows may indicate cardinal directions—north, south, east, and west—further reinforcing spatial orientation.
Vector illustrations frequently incorporate examples of global mapping applications, such as plotting multiple cities or geographic landmarks, demonstrating how the coordinate system enables navigation, aviation, shipping, and GPS-based location tracking. Lines connecting points of latitude and longitude to the globe’s surface may include subtle arcs or radial indicators to convey angular measurement, enhancing comprehension of how abstract degrees correspond to real-world positioning.
The illustration may also depict latitude-dependent phenomena, such as climate zones or day-length variation, showing how geographic coordinates relate to practical aspects of Earth science. Tropics, polar circles, and equatorial regions may be highlighted, linking abstract coordinate lines to environmental and cultural context. This provides learners with an integrated understanding of latitude and longitude not just as abstract angles, but as meaningful markers affecting climate, time zones, and human activity.
By combining spherical Earth depiction, latitude parallels, longitude meridians, location markers, and grid overlays, a vector illustration of longitude and latitude provides a thorough and intuitive understanding of the global coordinate system. Color-coded lines, directional arrows, labeled degrees, and example points ensure clarity, demonstrating how angular measurements on a sphere translate into precise geographic positioning. Comparative panels or magnified sections can further emphasize how small changes in degrees affect real-world location.
Ultimately, a vector illustration of longitude and latitude conveys the interconnectedness of angular measurement, spherical geometry, and global positioning. Through labeled meridians and parallels, location markers, hemispheric shading, and grid overlays, the diagram transforms abstract geographic coordinates into a visually intuitive educational tool. It helps learners, navigators, and designers understand how the Earth is divided into a structured system, enabling precise mapping, navigation, and spatial analysis in geography, cartography, and geospatial sciences.