Classic Crossover and Crossunder Moving Average Trading Strategy in Stock Market Chart Patterns
The classic crossover and crossunder moving average strategy is one of the most widely used techniques in stock market trading, valued for its simplicity, effectiveness, and adaptability across different market conditions. At its core, this strategy relies on the interaction of two moving averages — typically a short-term and a long-term average — to determine potential market entry and exit points. Traders employ this method to identify changes in trend direction, capture momentum, and enhance decision-making in both trending and volatile markets.
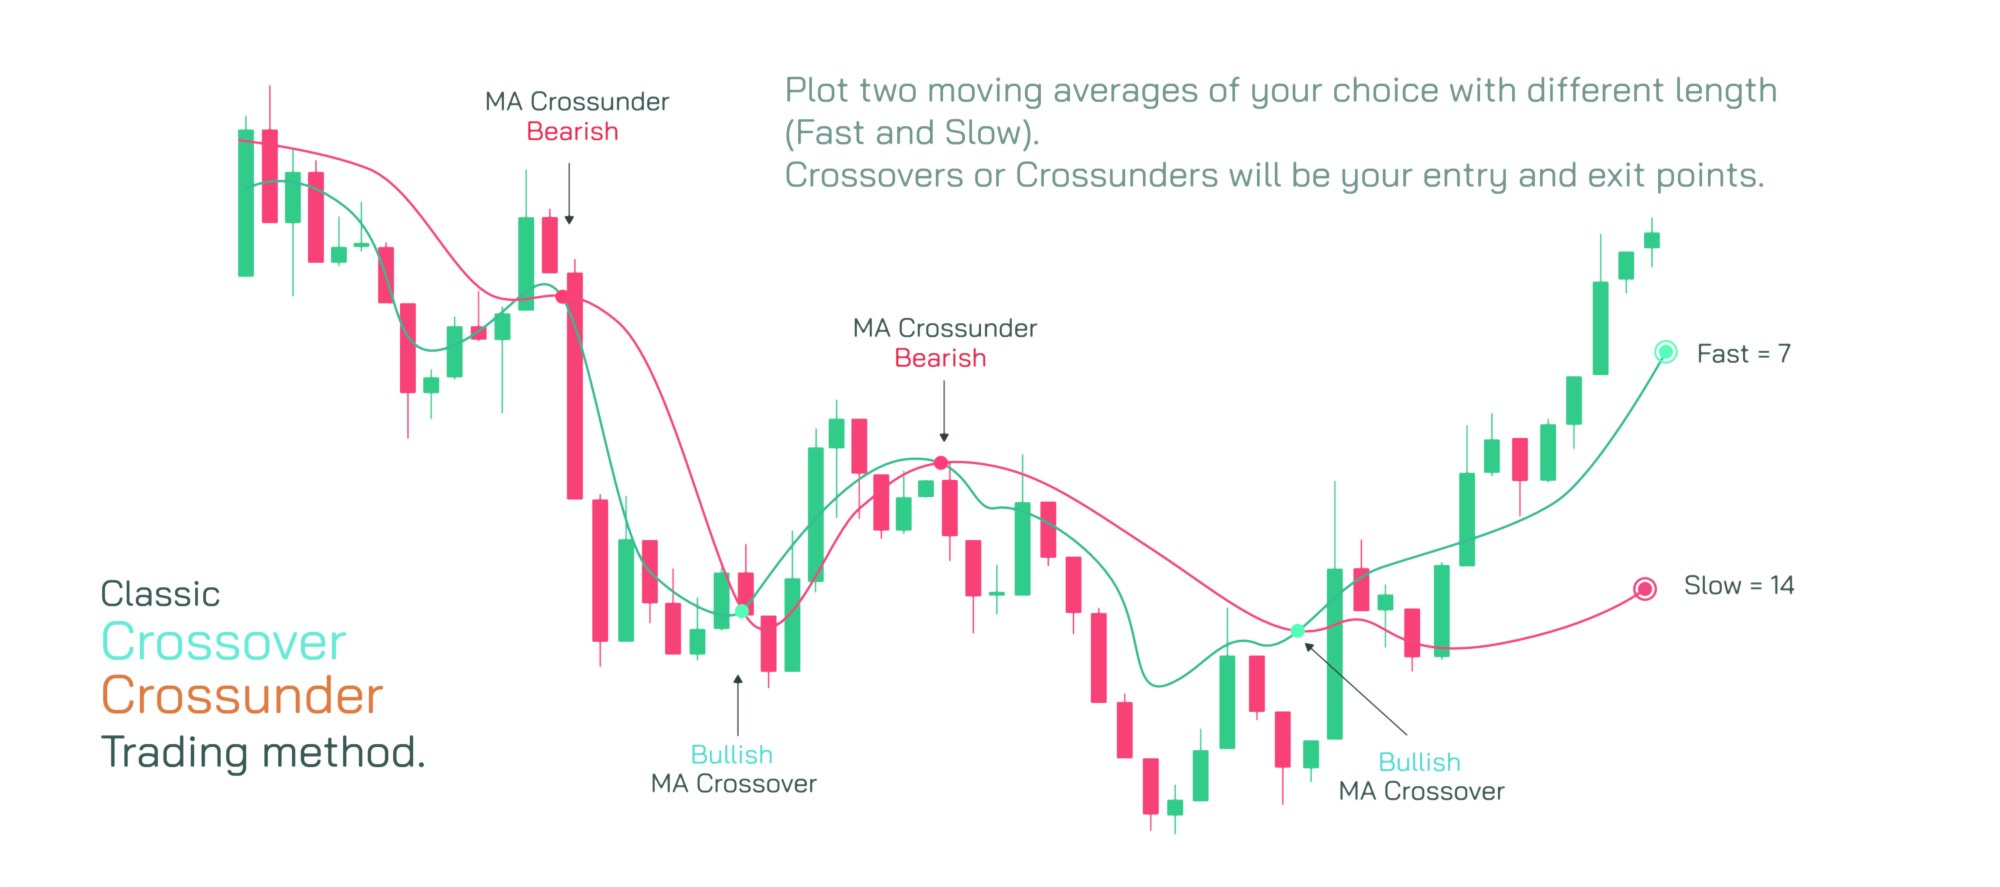
In practice, a crossover occurs when a shorter-term moving average rises above a longer-term moving average, signaling that recent price momentum is shifting upward and that bullish conditions may be emerging. Conversely, a crossunder happens when a short-term moving average falls below a longer-term moving average, indicating weakening momentum and a potential bearish trend. These signals provide a clear visual cue for traders to initiate buy or sell positions, depending on market conditions. The simplicity of observing moving averages on a stock chart allows traders of all experience levels to implement the strategy effectively while maintaining consistent risk management.
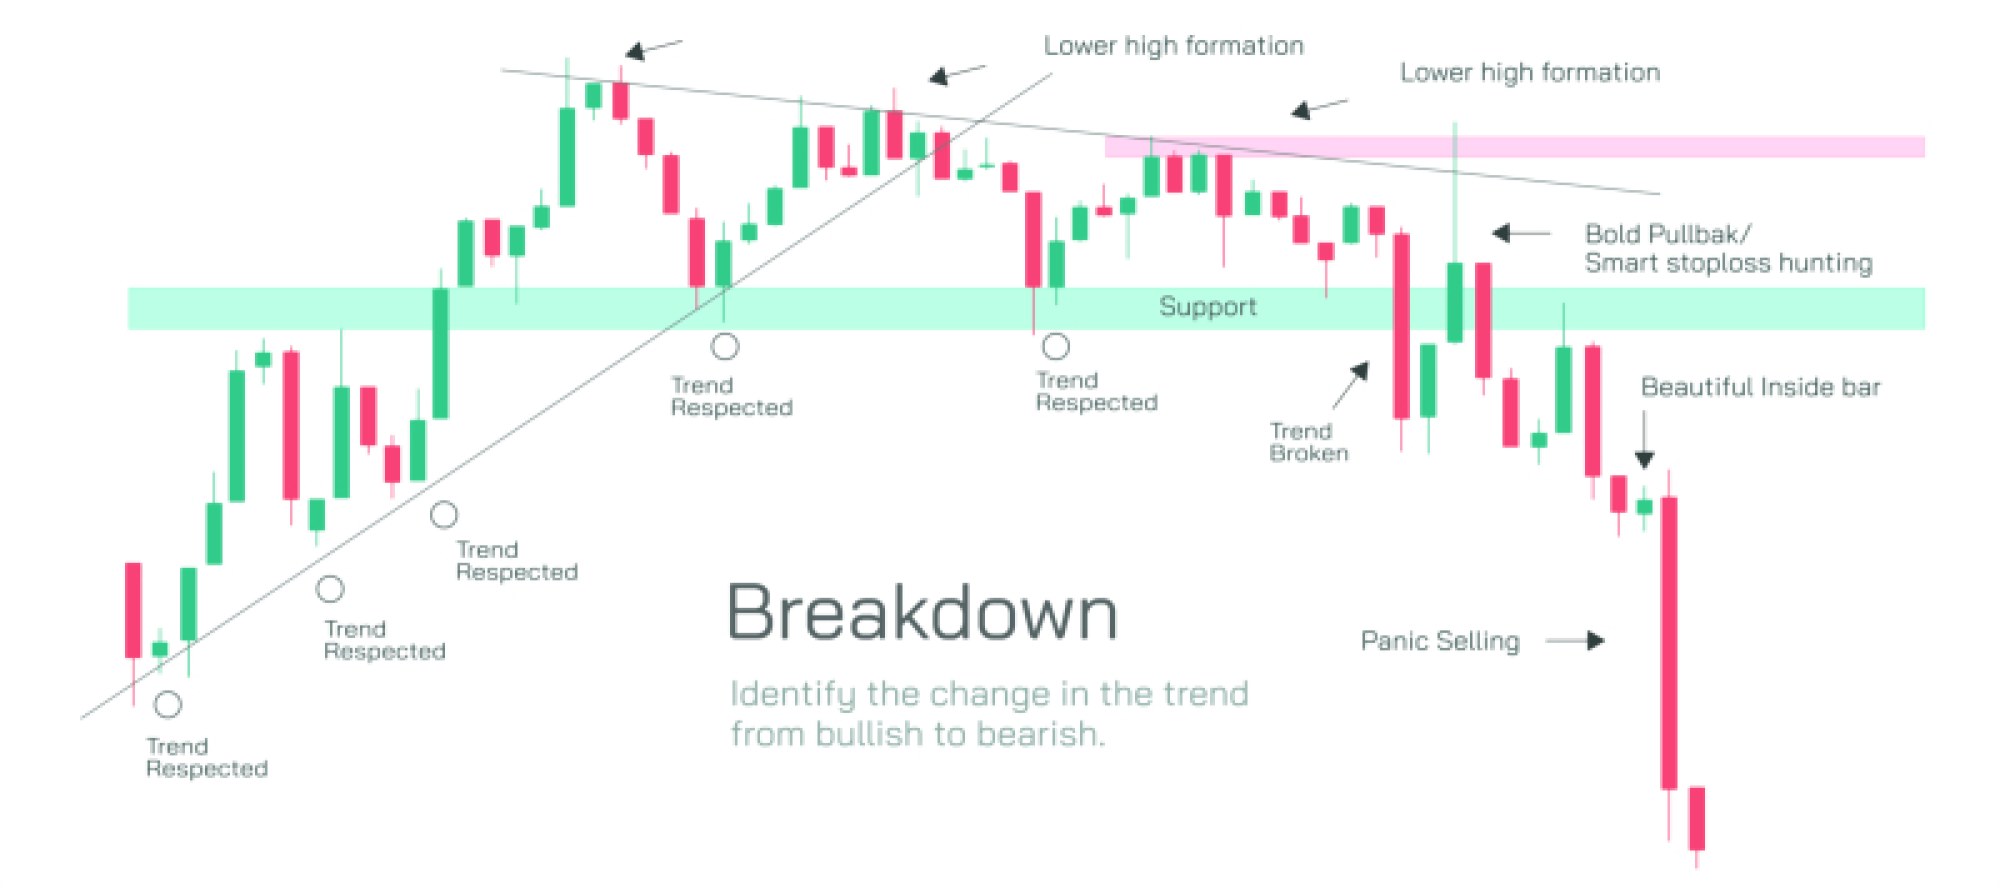
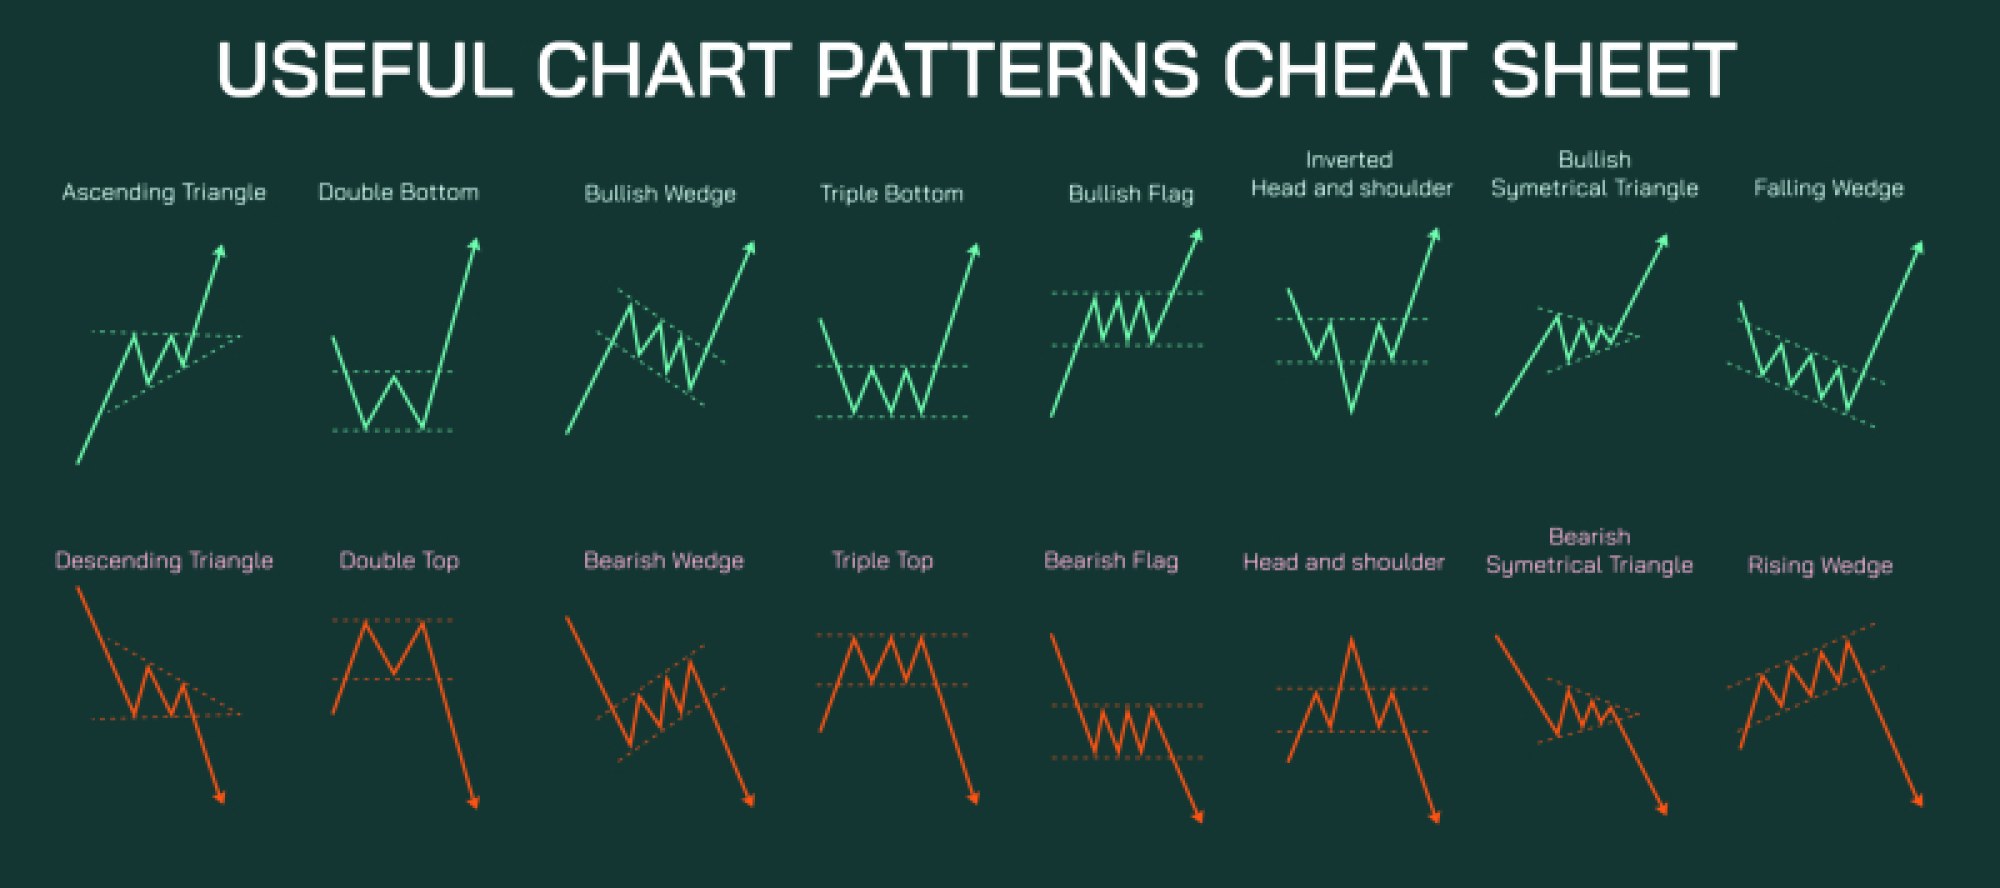
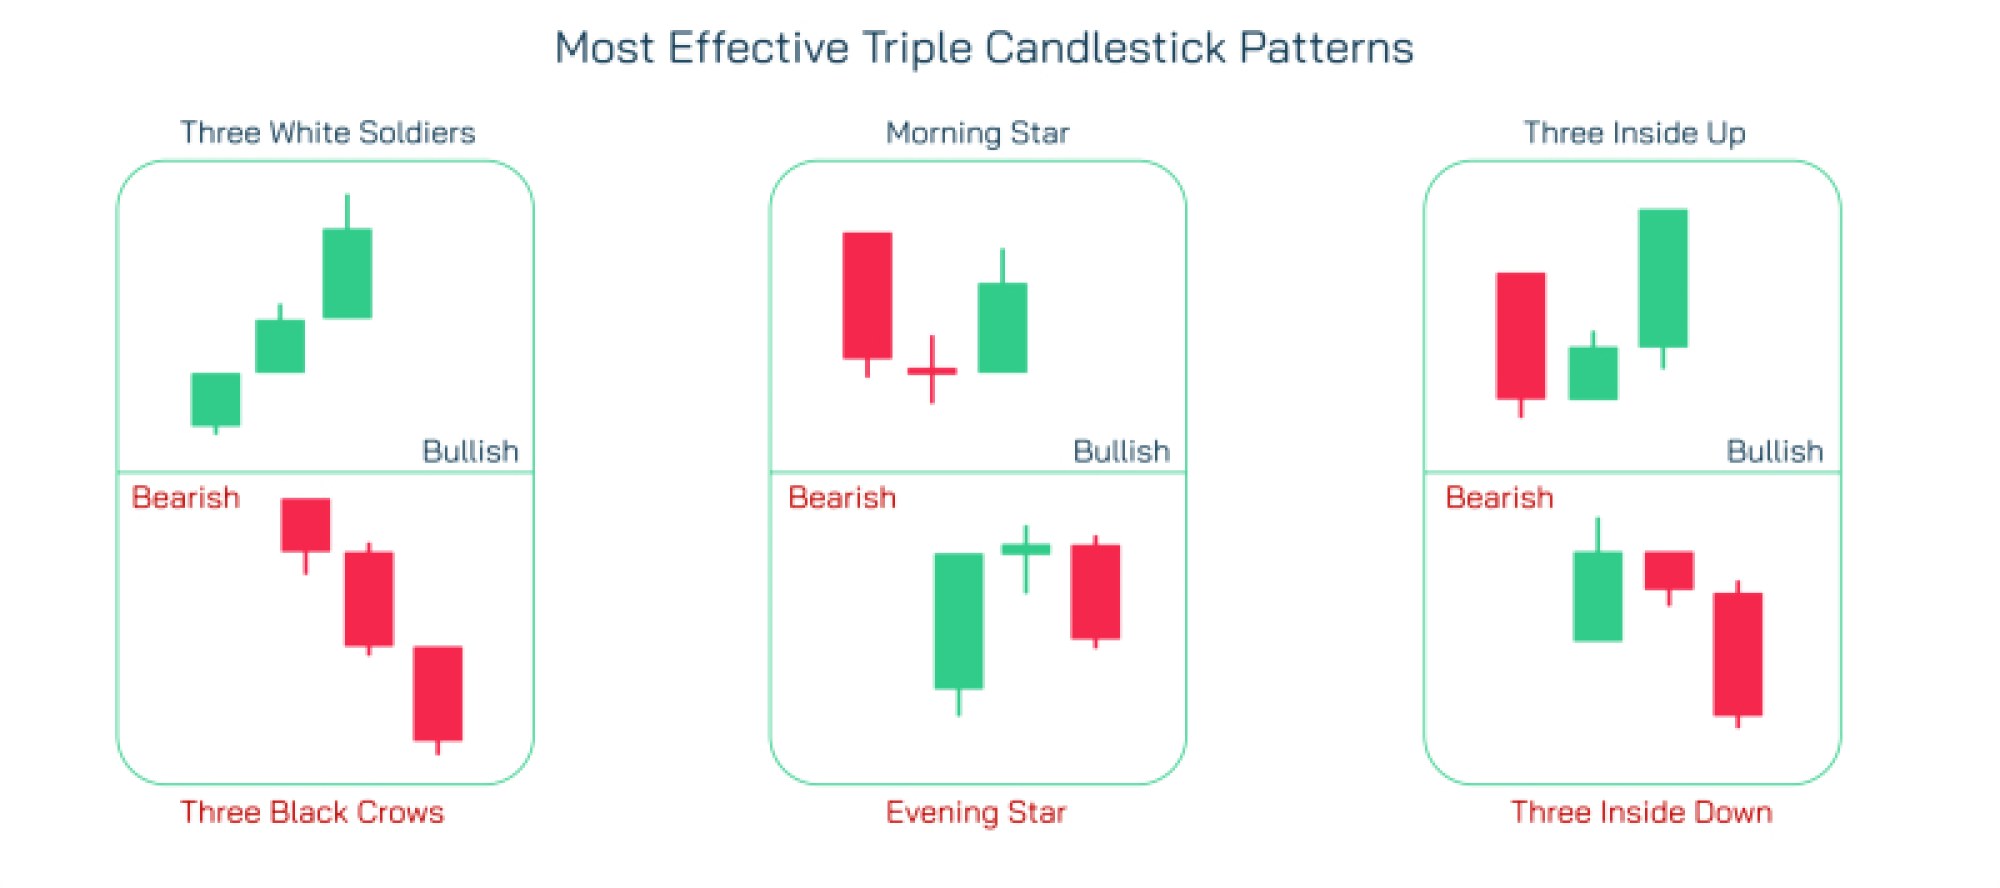
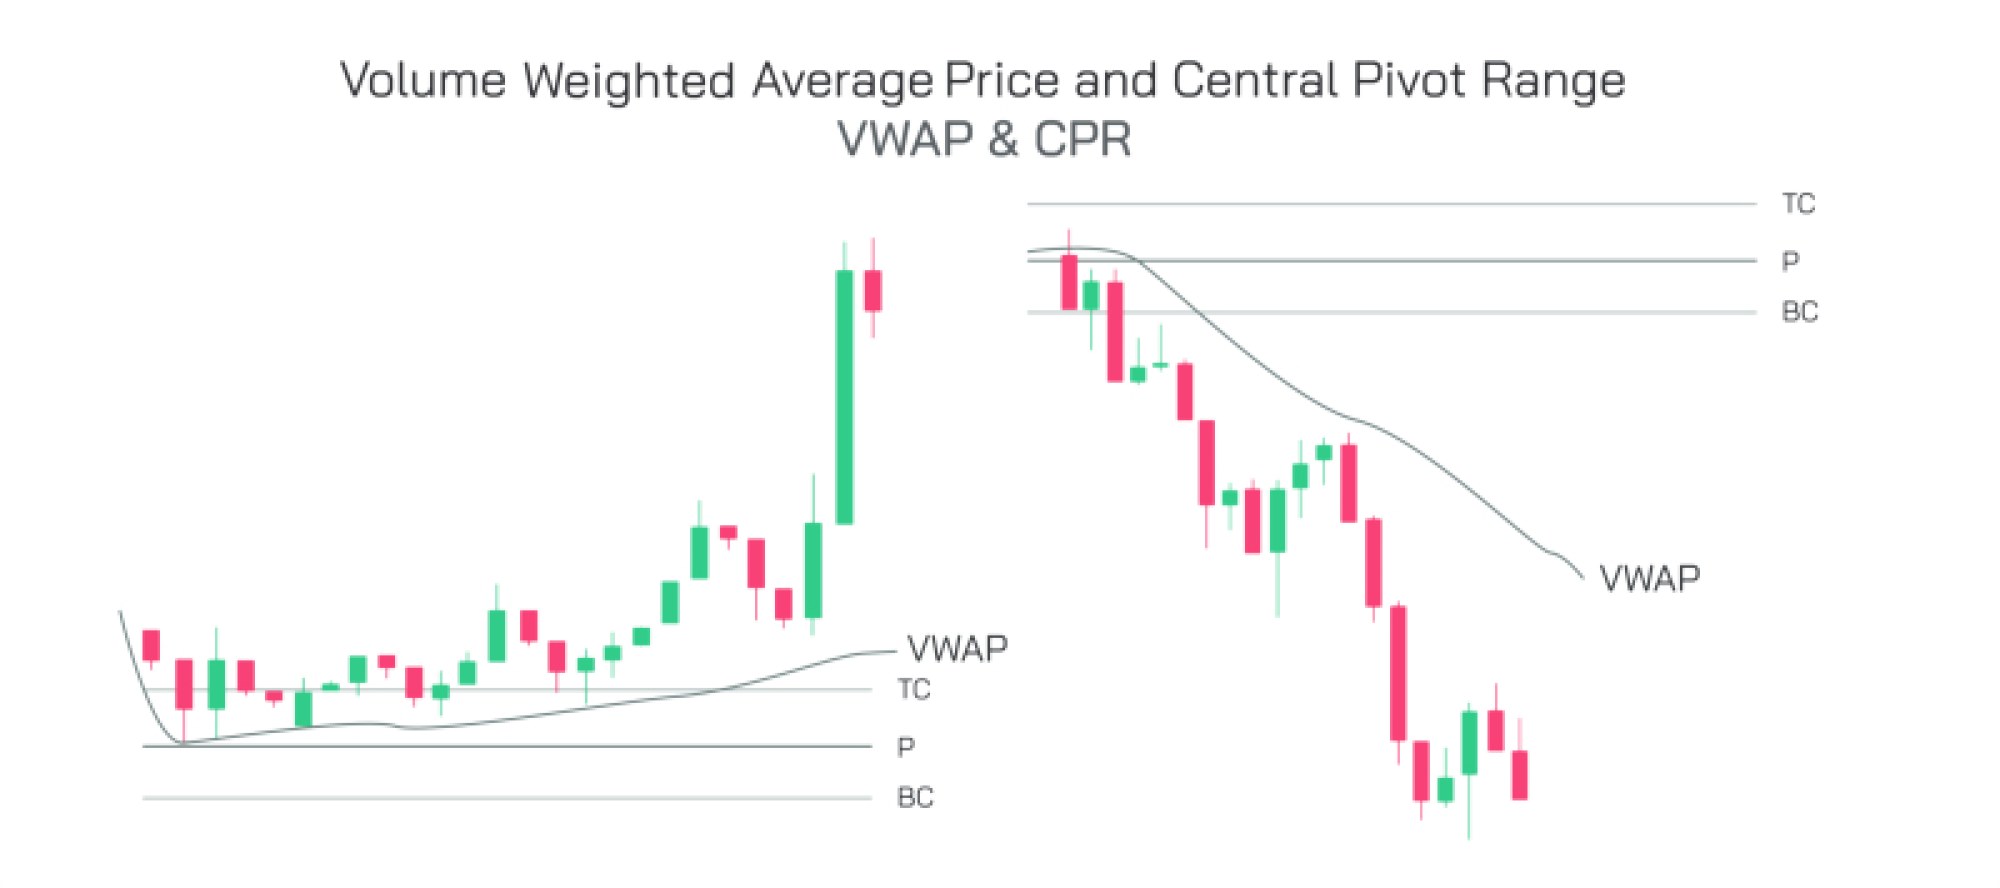
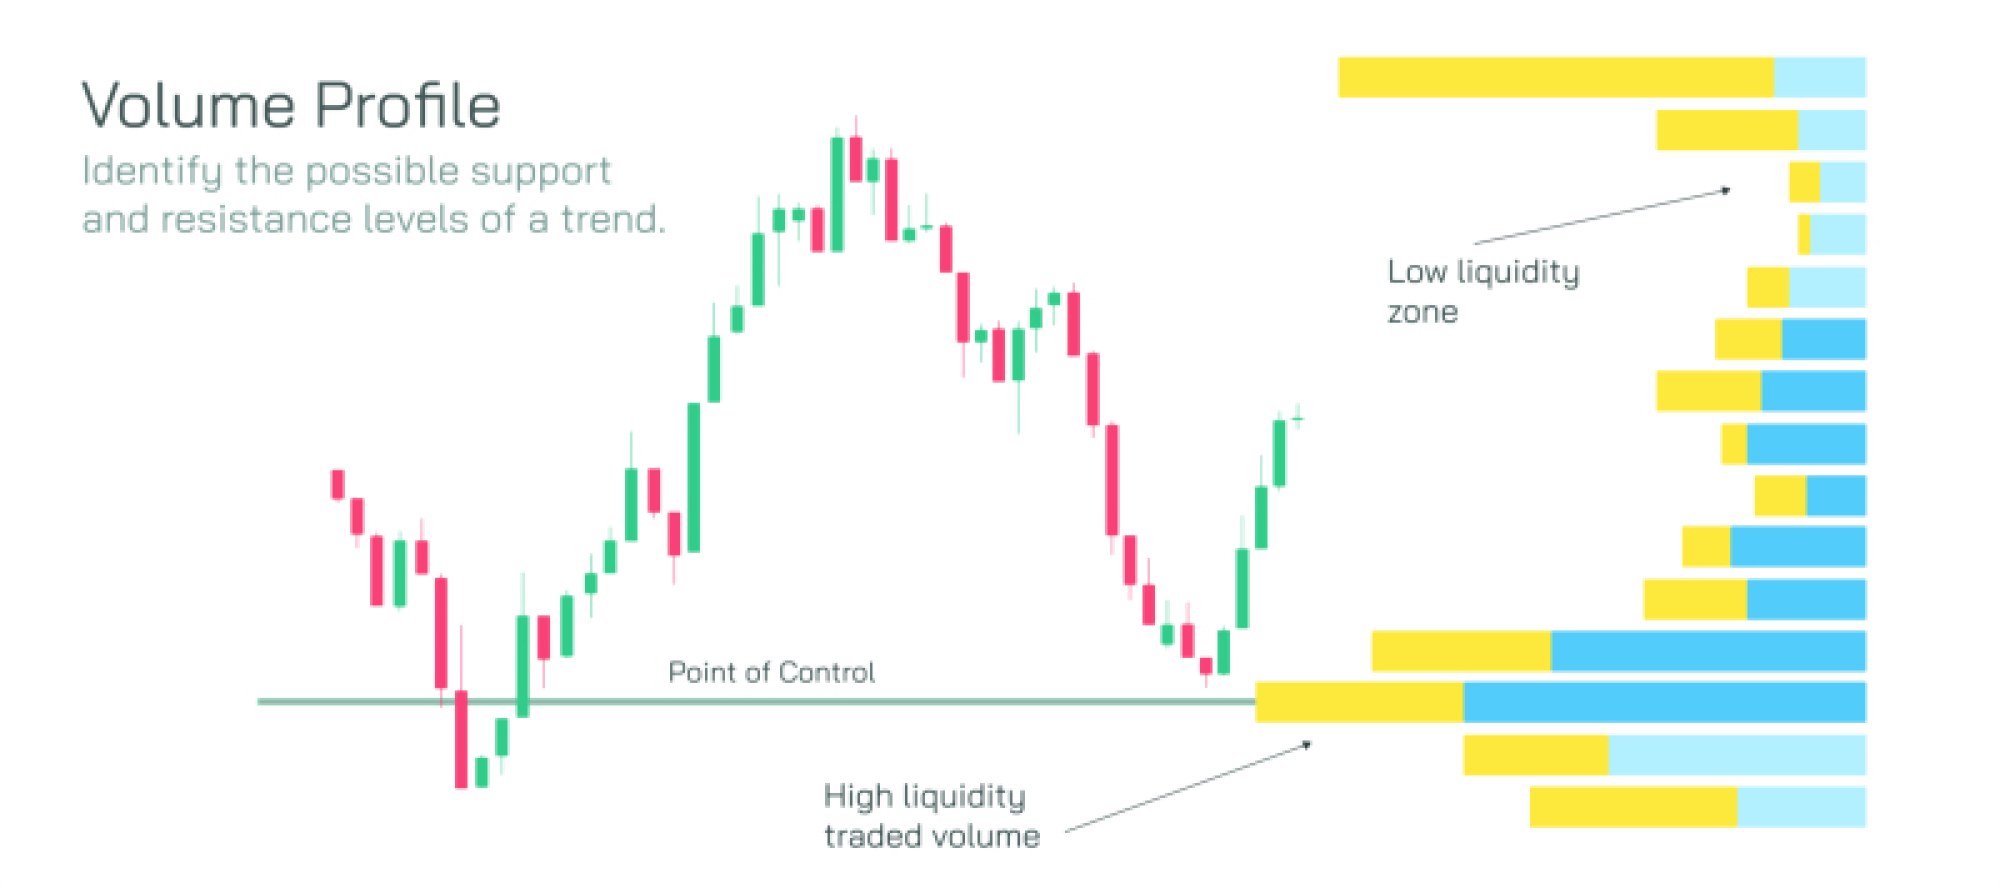
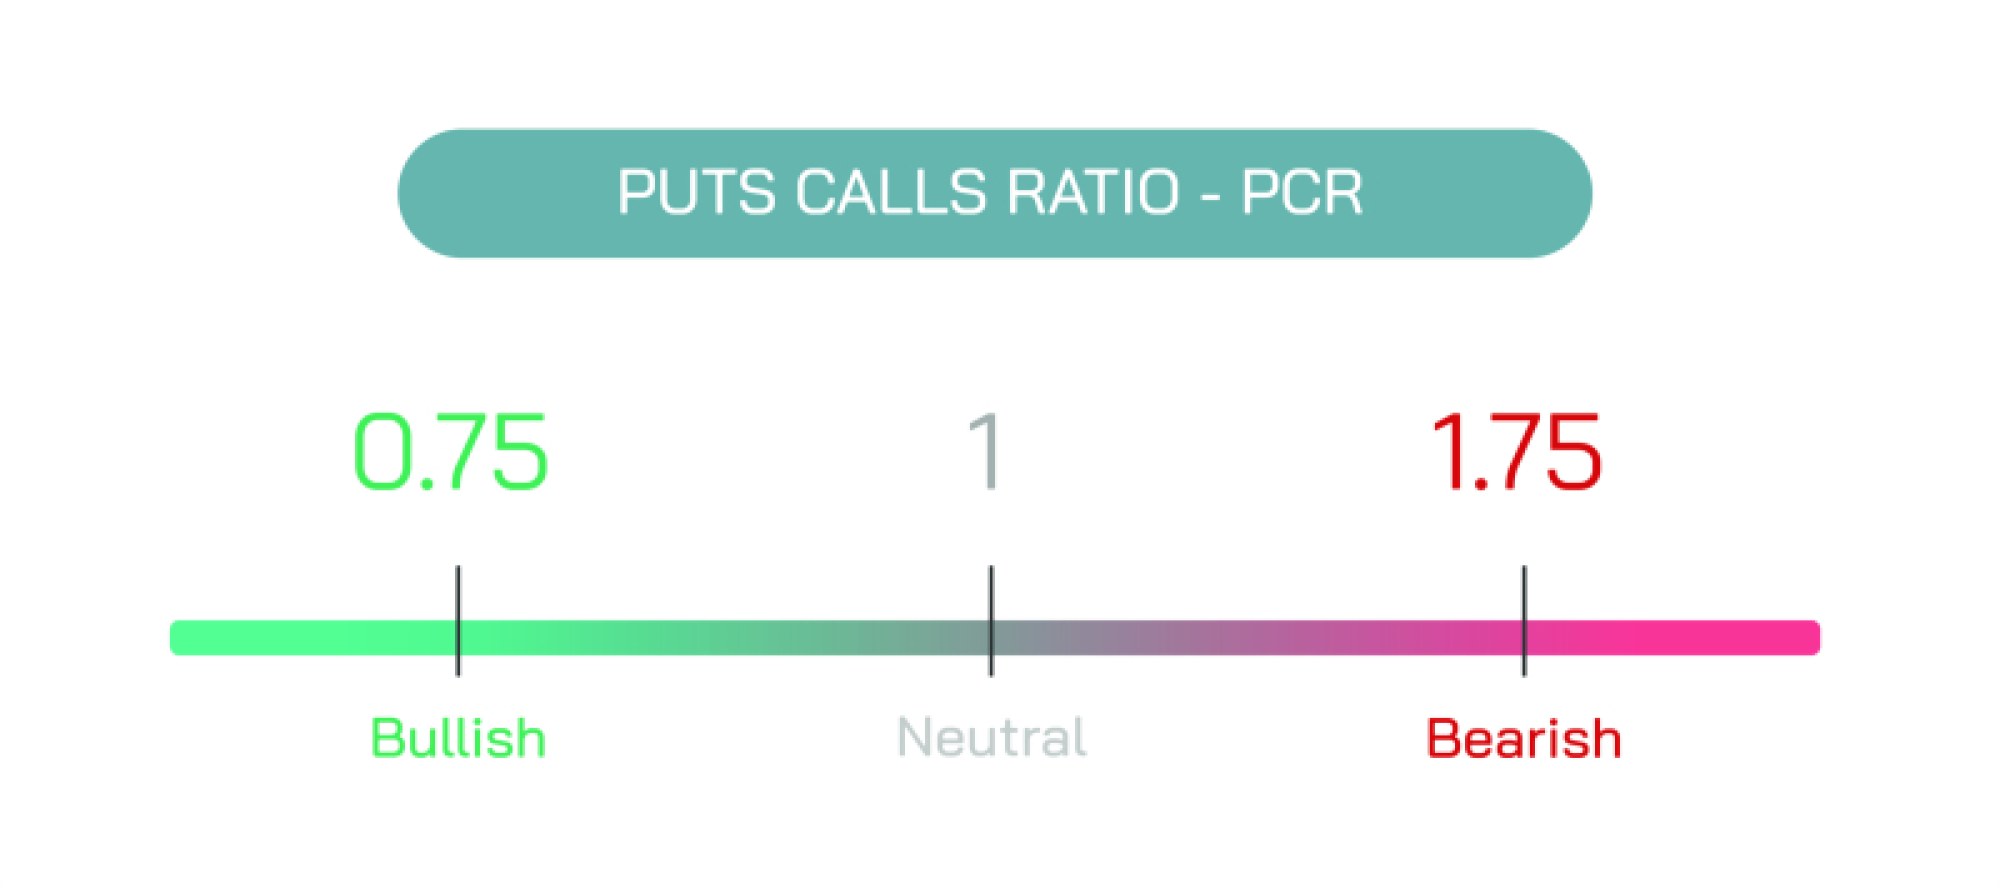
The moving average crossover and crossunder strategy is versatile and can be applied to different timeframes, from intraday trading to long-term investment analysis. By adjusting the period lengths of the moving averages, traders can fine-tune the strategy to suit short-term volatility or long-term trend analysis. The approach also incorporates broader market context, such as identifying support and resistance zones, evaluating price patterns, and assessing market sentiment. When combined with other technical tools, such as trend lines, volume indicators, and chart formations, the crossover and crossunder strategy provides a robust framework for anticipating price movements and validating trading decisions.
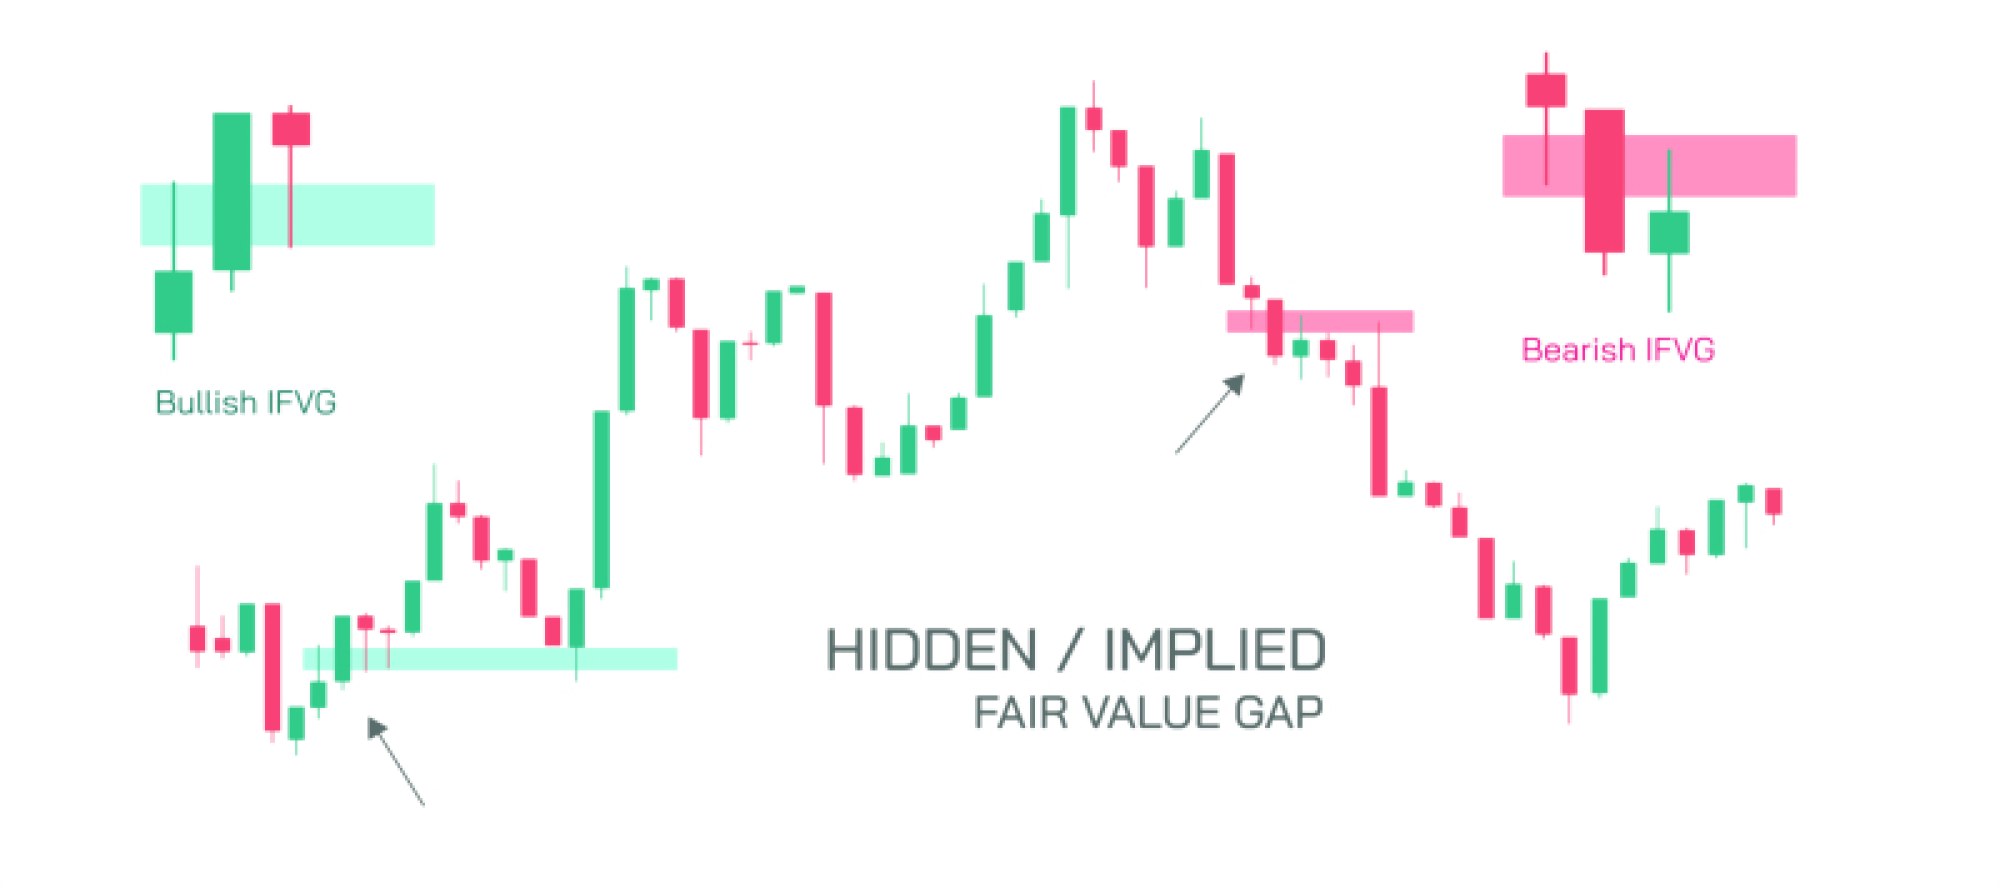
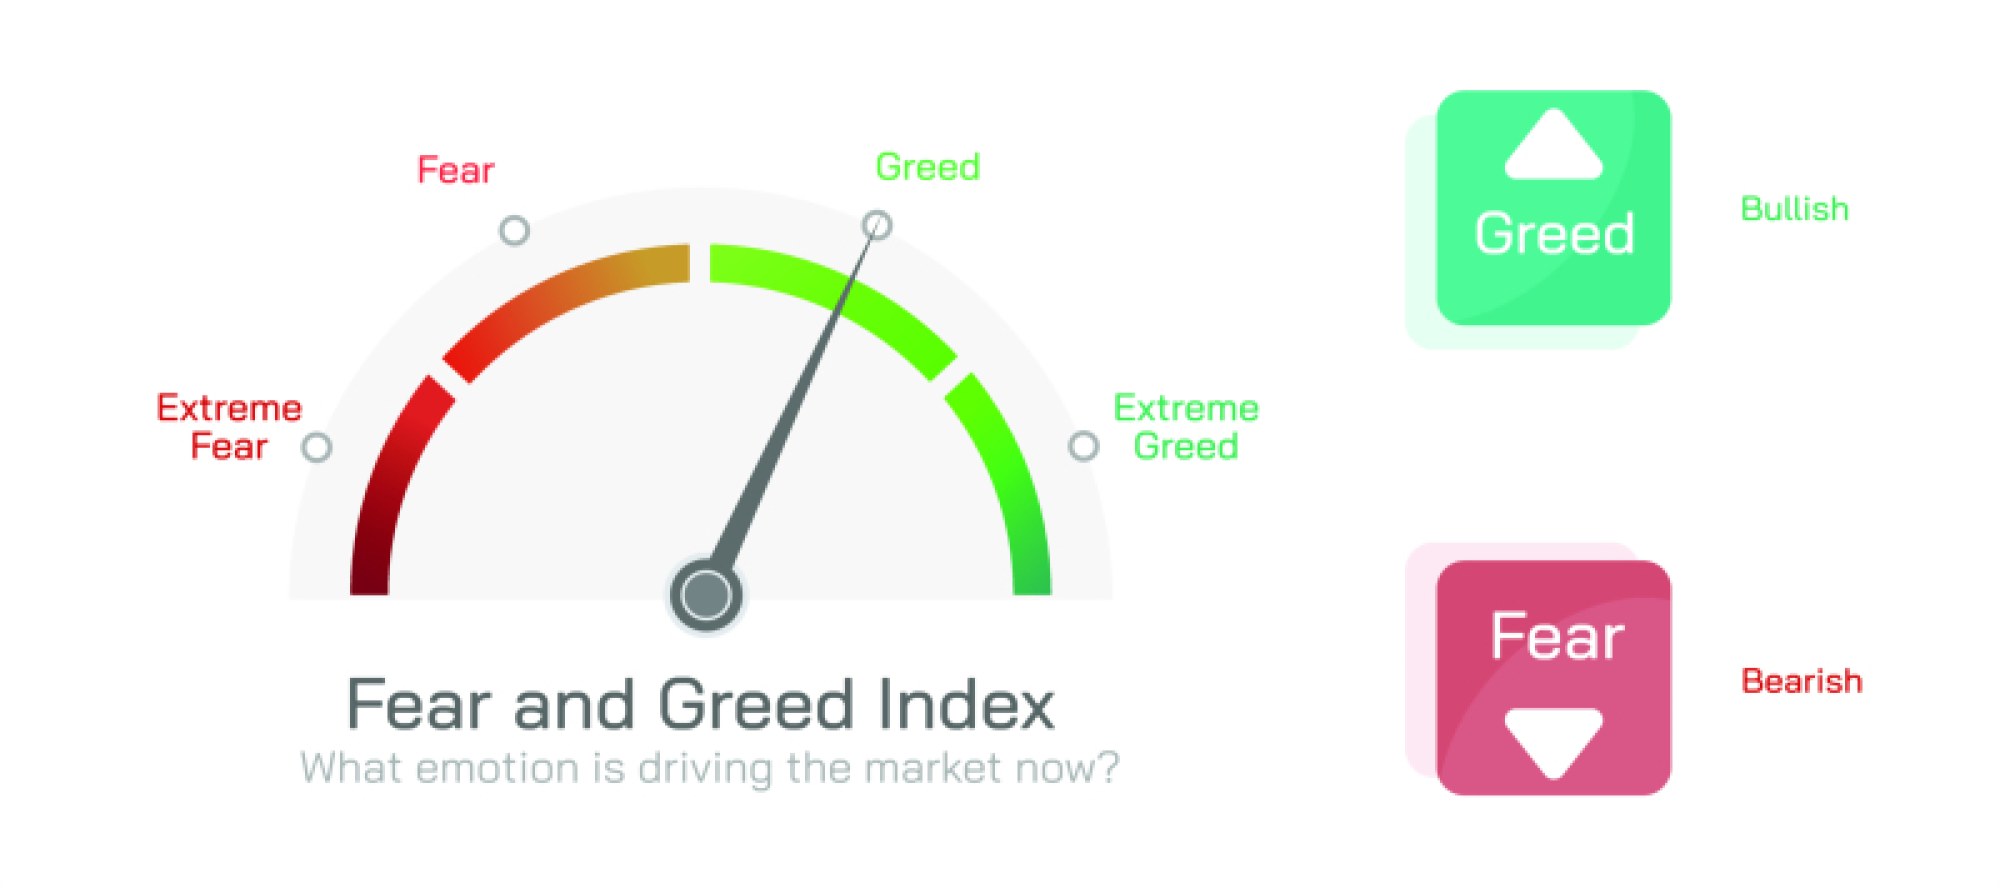
Understanding the psychological impact of moving average crossovers and crossunders is equally important. These signals often reflect shifts in trader behavior, indicating increasing buying pressure during bullish crossovers or growing selling activity during bearish crossunders. By observing these dynamics, traders gain insights into market confidence, potential reversals, and areas where liquidity may concentrate. Educational illustrations of the strategy typically highlight the interaction of the two moving averages on a stock chart, marking crossover and crossunder points along with trend direction, helping traders visualize momentum changes and prepare for informed trading actions.
Mastering the classic crossover and crossunder moving average strategy empowers traders to recognize emerging trends, avoid false signals, and make strategic decisions that align with market behavior. It enhances technical analysis skills, supports disciplined trading, and contributes to improved risk management. Through continuous observation and application, traders can leverage this strategy to navigate complex market patterns, optimize entry and exit timing, and achieve more consistent trading performance. By integrating crossover and crossunder signals into broader chart pattern analysis, market participants gain a deeper understanding of price movement, trend validation, and effective trading strategies that are applicable across a wide range of financial instruments.