Human Age Groups and Body Water Percentage Illustration: Development and Hydration Levels Explained
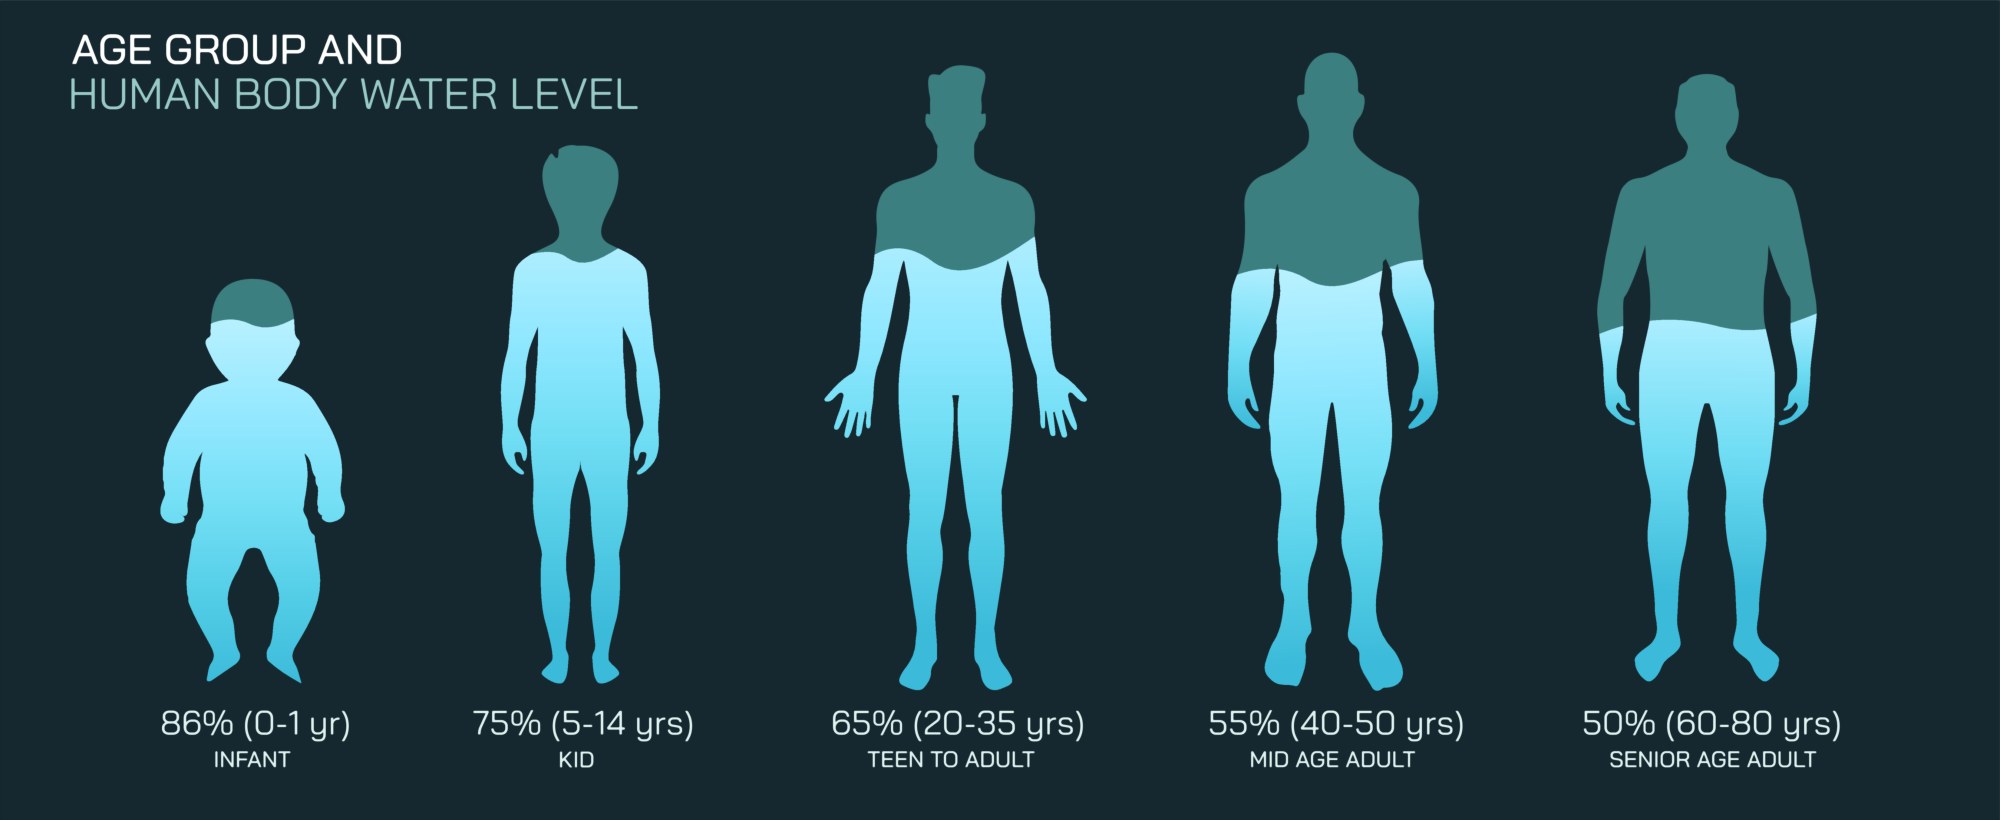
The percentage of water within the human body changes dramatically across the lifespan, and an illustration comparing age groups with body water distribution provides a visual way to understand how hydration needs evolve alongside growth, development, and aging. Although we often imagine the human body as mostly water, the proportion of water relative to total body mass varies depending on age, sex, and body composition. A chart or diagram showing water percentages from infancy through old age emphasizes that hydration plays an essential role not only in maintaining biological function but also in supporting developmental processes, metabolism, and cellular integrity. By placing these changes along a timeline of human life—newborn, infant, child, adolescent, adult, and elderly—illustrations transform abstract percentages into meaningful biological milestones.
At the earliest stage of life, newborn babies have the highest proportion of body water, typically around 75–80% of total body weight, and illustrations often depict this using bright colors or enlarged fluid proportions on body silhouettes. The high water content reflects rapid growth, a predominance of metabolically active tissues, and the large volume of extracellular fluid necessary to support developing organs. Newborns require frequent feeding because their bodies lose water quickly due to a high metabolic rate and limited kidney function. A hydration diagram may pair these features with organs such as the kidneys and skin, showing high surface area and limited concentration ability that make water balance delicate during early infancy.
As the illustration moves to the infant and toddler stage, body water content typically shifts to 65–70%. This decrease is driven by changes in body composition—particularly the gradual increase in fat stores and muscle tissues as children become more physically active and begin to grow rapidly. The extracellular fluid fraction reduces as intracellular water becomes the primary reservoir due to expanding muscle cells. Hydration diagrams for this age group often emphasize play, physical growth, and developing thermoregulation, showing that infants and toddlers are still vulnerable to dehydration because they produce heat quickly, sweat more during activity, and cannot yet manage their own hydration habits.
In childhood, the body water percentage stabilizes near 60–65%. Illustrations often show anatomical balance between lean tissues and fat distribution that reflect steady physical development. Because school-age children are active and may not always detect or communicate thirst effectively, hydration reminders are important. Some charts highlight sweat glands, kidneys, and blood volume to show how water supports circulation, temperature control, cognitive focus, and immune health. The emphasis shifts away from rapid physiological change toward consistent hydration for growth, learning, and metabolism.
During adolescence, water percentage depends more strongly on gender, body composition, and hormonal shifts. The illustration typically shows two diverging lines: one representing males and the other females. In boys, the growth of muscle mass and bone density increases intracellular water, so their body water percentage often remains in the 60–70% range. In girls, a natural increase in body fat percentage, especially in hips and thighs, reduces total water proportion slightly, often to 52–60%. The diagram usually highlights the role of puberty, hormones, and muscle development while linking hydration to physical performance in sports, rapid skeletal growth, and the metabolic demands associated with transitioning toward adulthood.
In adulthood, average water percentage settles at levels influenced largely by gender and body composition. Adult men typically maintain 55–65% water due to higher lean muscle mass, while adult women generally fall within 50–60% due to higher fat composition. Visualizations of this stage often depict stable hydration balance supported by healthy kidney function, regular sweating patterns, and consistent water intake. At this age, dehydration risk tends to be behavioral rather than physiological—busy schedules, caffeine and alcohol intake, strenuous work, or physical exercise can all increase water loss without always prompting sufficient thirst signals.
Once the illustration reaches older adulthood and the elderly stage, there is a notable decrease in total body water, often dropping to 45–50% or even lower depending on health and muscle mass. This decline reflects age-related loss of lean tissue, reduced muscle mass (sarcopenia), increased body fat percentage, decreased kidney efficiency, and diminished thirst perception. A well-designed diagram for this stage frequently overlays potential risks: dehydration due to low thirst awareness, slower bodily water regulation, reduced sweat response, and vulnerability to heat stress or illness. Visuals may include medical equipment, medication bottles, or a hospital setting to emphasize how decreased body water increases susceptibility to complications from fever, infection, diuretics, or chronic disease.
Disaggregated anatomical illustrations deepen the message by showing how water distribution changes inside the body, not only overall. Intracellular fluid generally accounts for about two-thirds of total body water, while extracellular water—including plasma and interstitial fluid—makes up the remainder. In newborns, extracellular fluid proportion is dramatically high; over time, intracellular fluid becomes dominant as skeletal muscle enlarges and matures. This shift is frequently highlighted in pie charts showing internal reservoirs of water at different age stages, visually linking hydration to cellular development, metabolism, and organ growth.
Hydration-focused illustrations often emphasize water’s functional roles in every age group. These diagrams show water supporting nutrient transport, digestion, blood circulation, temperature regulation, brain function, joint lubrication, and detoxification. Icons representing sweating, breathing, urination, and metabolism appear across age categories to underscore how water is constantly lost and must be replenished. When mapped across the lifespan, these details make clear why hydration is vital not only during childhood growth and physical activity but also during aging as the body becomes more fragile and less efficient in maintaining homeostasis.
Some versions of this illustration integrate lifestyle influences to show variations within age groups. High muscle mass increases water content; high fat levels decrease it. Athletes retain more intracellular water; sedentary individuals retain less. Chronic illnesses, kidney conditions, medications, or heat exposure can shift water balance dramatically at any age. These elements reveal that hydration is not fixed by age alone but varies according to physiology, health status, and environment.
Ultimately, an illustration of human age groups and body water percentage transforms numerical hydration concepts into a biological story of change and adaptation. It shows a body that begins life full of water-rich, rapidly developing tissues, gradually matures into a stable adult system finely tuned for metabolic efficiency, and eventually enters an aging phase where hydration becomes increasingly difficult to regulate. By linking anatomical silhouettes, water percentages, and functional physiology, the illustration conveys a simple but powerful message: hydration requirements evolve throughout life because the structure of the human body evolves, and understanding this timeline is key to supporting health at every stage of growth and aging.