Mathematics Fraction Vector Illustration Showing Numerator, Denominator, and Fraction Representation Concept
Fractions are a foundational concept in mathematics, representing parts of a whole or ratios between quantities. Understanding fractions is essential for arithmetic, algebra, and advanced mathematical applications, as they allow precise expression of quantities that are not whole numbers. A vector illustration of fractions typically shows the numerator, denominator, and the visual representation of the fraction, providing learners with a clear understanding of how fractions are structured, interpreted, and applied in mathematical operations. By combining symbolic notation with visual cues, such illustrations make abstract numerical relationships tangible and intuitive.
At the core of the vector illustration is the fraction notation, where a number written above a horizontal line (the numerator) is divided by a number written below the line (the denominator). For example, in the fraction 3/4, the numerator “3” indicates how many parts are considered, while the denominator “4” indicates into how many equal parts the whole is divided. In vector diagrams, arrows or labels typically point to the numerator and denominator, clearly identifying each component. The fraction line itself is often highlighted to show its function as a division operator, reinforcing the idea that the numerator is being divided by the denominator.
The illustration often includes a visual representation of the fraction using shapes such as circles, rectangles, or bars divided into equal parts. In the example of 3/4, a circle or rectangle may be divided into four equal sections, with three sections shaded to represent the numerator. This visual aid helps learners see that the denominator determines the number of equal divisions of the whole, while the numerator indicates how many of those divisions are being considered. Color coding, shading, or patterning of sections often emphasizes the numerator, making the fractional part immediately apparent. By pairing symbolic notation with visual representation, the diagram bridges abstract mathematical symbols with concrete imagery, enhancing conceptual understanding.
Vector illustrations also often depict fraction equivalence and comparison. For example, 1/2 and 2/4 can be shown as bars or circles divided differently but representing the same portion of the whole. Arrows or lines may indicate that these fractions are equivalent, helping learners understand how multiplying or dividing the numerator and denominator by the same number does not change the value of the fraction. This component is particularly useful for teaching concepts such as simplifying fractions, finding common denominators, and comparing fractions. By visually demonstrating equivalence, the illustration makes it easier to grasp these important mathematical principles.
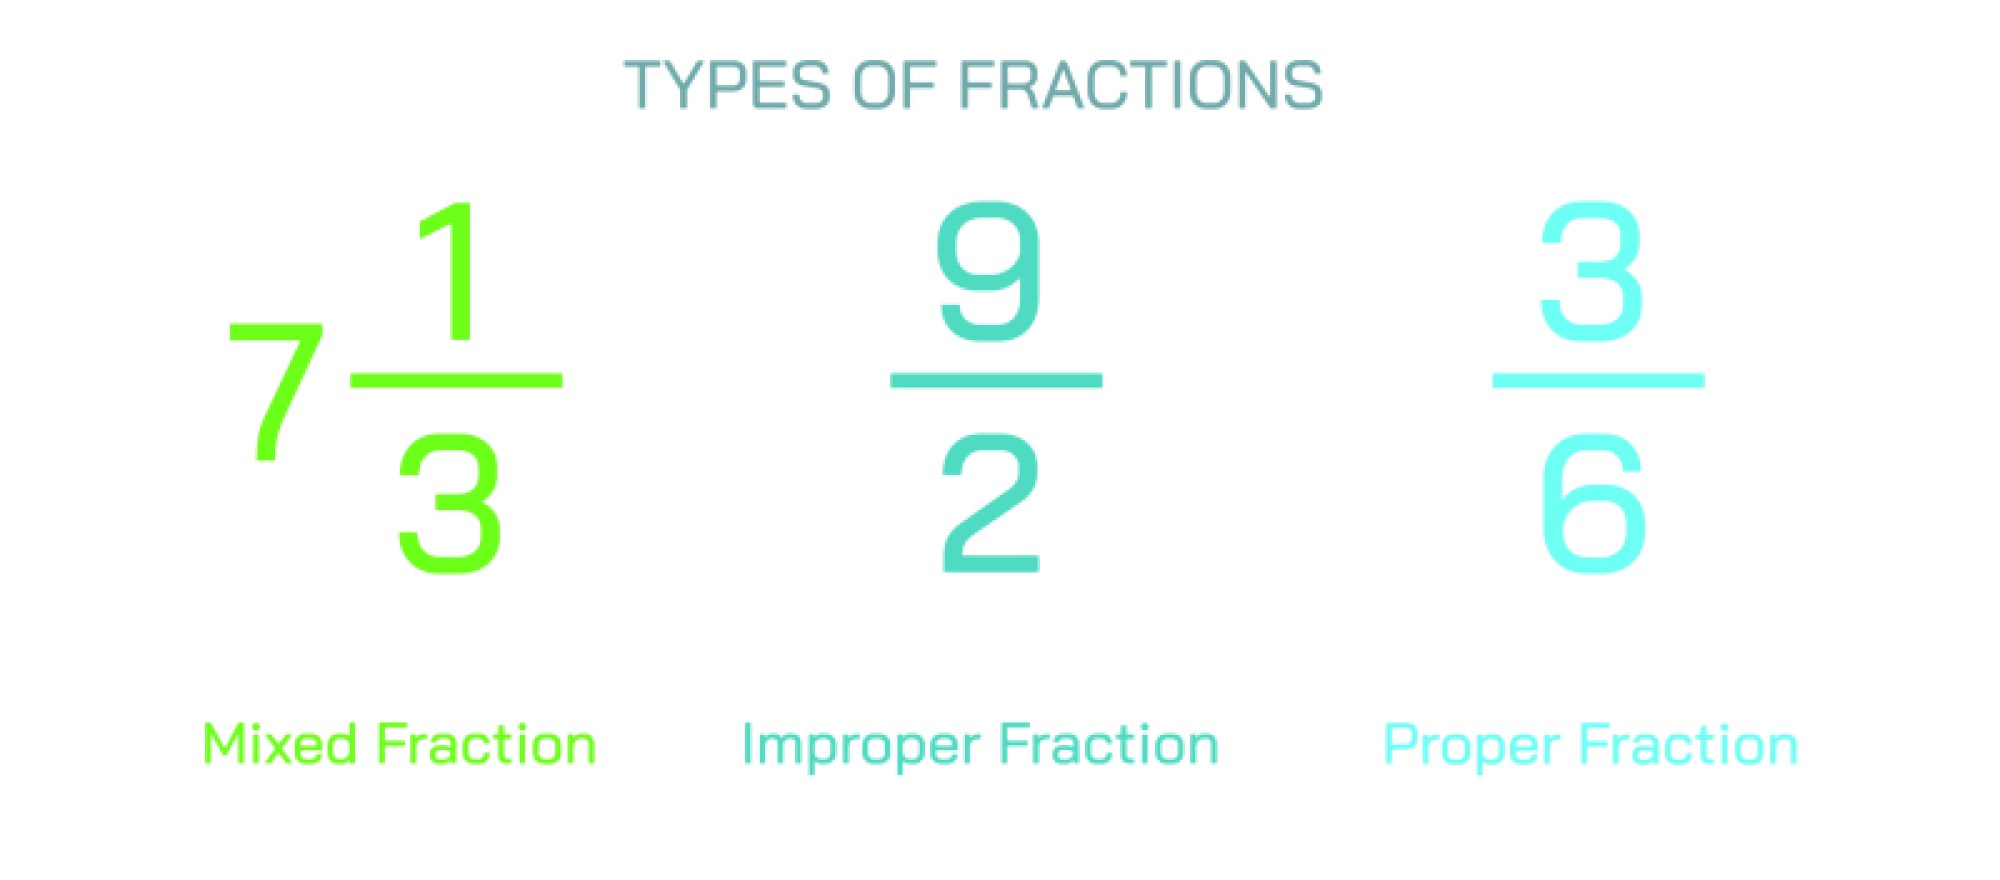
Another key feature in vector illustrations is the depiction of improper fractions and mixed numbers. An improper fraction, where the numerator exceeds the denominator (e.g., 7/4), can be shown as multiple whole shapes plus a fraction of another shape, with arrows indicating conversion into a mixed number (1 3/4 in this case). This visual method helps learners understand the relationship between whole numbers and fractions, providing a clear conceptual link between different representations of the same quantity. The diagram may use segmented shapes, distinct colors, or labeling to differentiate the whole portion from the fractional remainder.
Vector illustrations may also incorporate fraction operations, such as addition, subtraction, multiplication, and division. For addition or subtraction, separate shapes representing fractions with a common denominator can be shown side by side, with shading combined or removed to demonstrate the result visually. Multiplication can be illustrated using overlapping grids or areas, while division may use the concept of partitioning one shape into multiple fractional parts. By incorporating these operational illustrations, the diagram provides not only the structural understanding of fractions but also their functional application in calculations.
Number lines are another element often included in fraction illustrations. Fractions can be placed along a number line to indicate their relative magnitude, helping learners understand the size of a fraction in comparison to whole numbers and other fractions. Arrows may point from a fraction symbol to its position on the number line, reinforcing the concept that fractions represent a proportional distance between integers. This representation also aids in teaching fraction comparison, ordering, and estimation, as learners can see which fractions are larger or smaller and how fractions fit within the continuum of real numbers.
The vector illustration may also highlight real-world applications of fractions, such as portions of food, measurements in recipes, segments of time, or parts of a whole in data representation. Circles divided into slices (pie charts), bars, or rectangles representing portions of a whole can visually demonstrate these applications. By connecting fractions to practical scenarios, the illustration helps learners relate abstract numerical concepts to everyday experiences, reinforcing understanding and relevance.
By combining numerical notation, visual fraction representation, equivalence, improper fractions, mixed numbers, number line positioning, and real-world examples, a vector illustration of fractions provides a comprehensive framework for understanding this critical mathematical concept. It allows learners to see the numerator and denominator in context, grasp how fractions represent portions of a whole, and understand their applications in calculations and everyday situations. Color coding, labeled arrows, segmented shapes, and number line integration make the diagram both educationally rich and visually intuitive.
Ultimately, a vector illustration of fractions conveys that a fraction is more than a symbol—it is a representation of proportional relationships, numerical reasoning, and mathematical operations. By integrating symbolic, visual, and practical elements into a coherent diagram, the illustration transforms abstract ideas into accessible, comprehensible, and memorable representations, fostering deep understanding and fluency in working with fractions across a range of mathematical contexts.