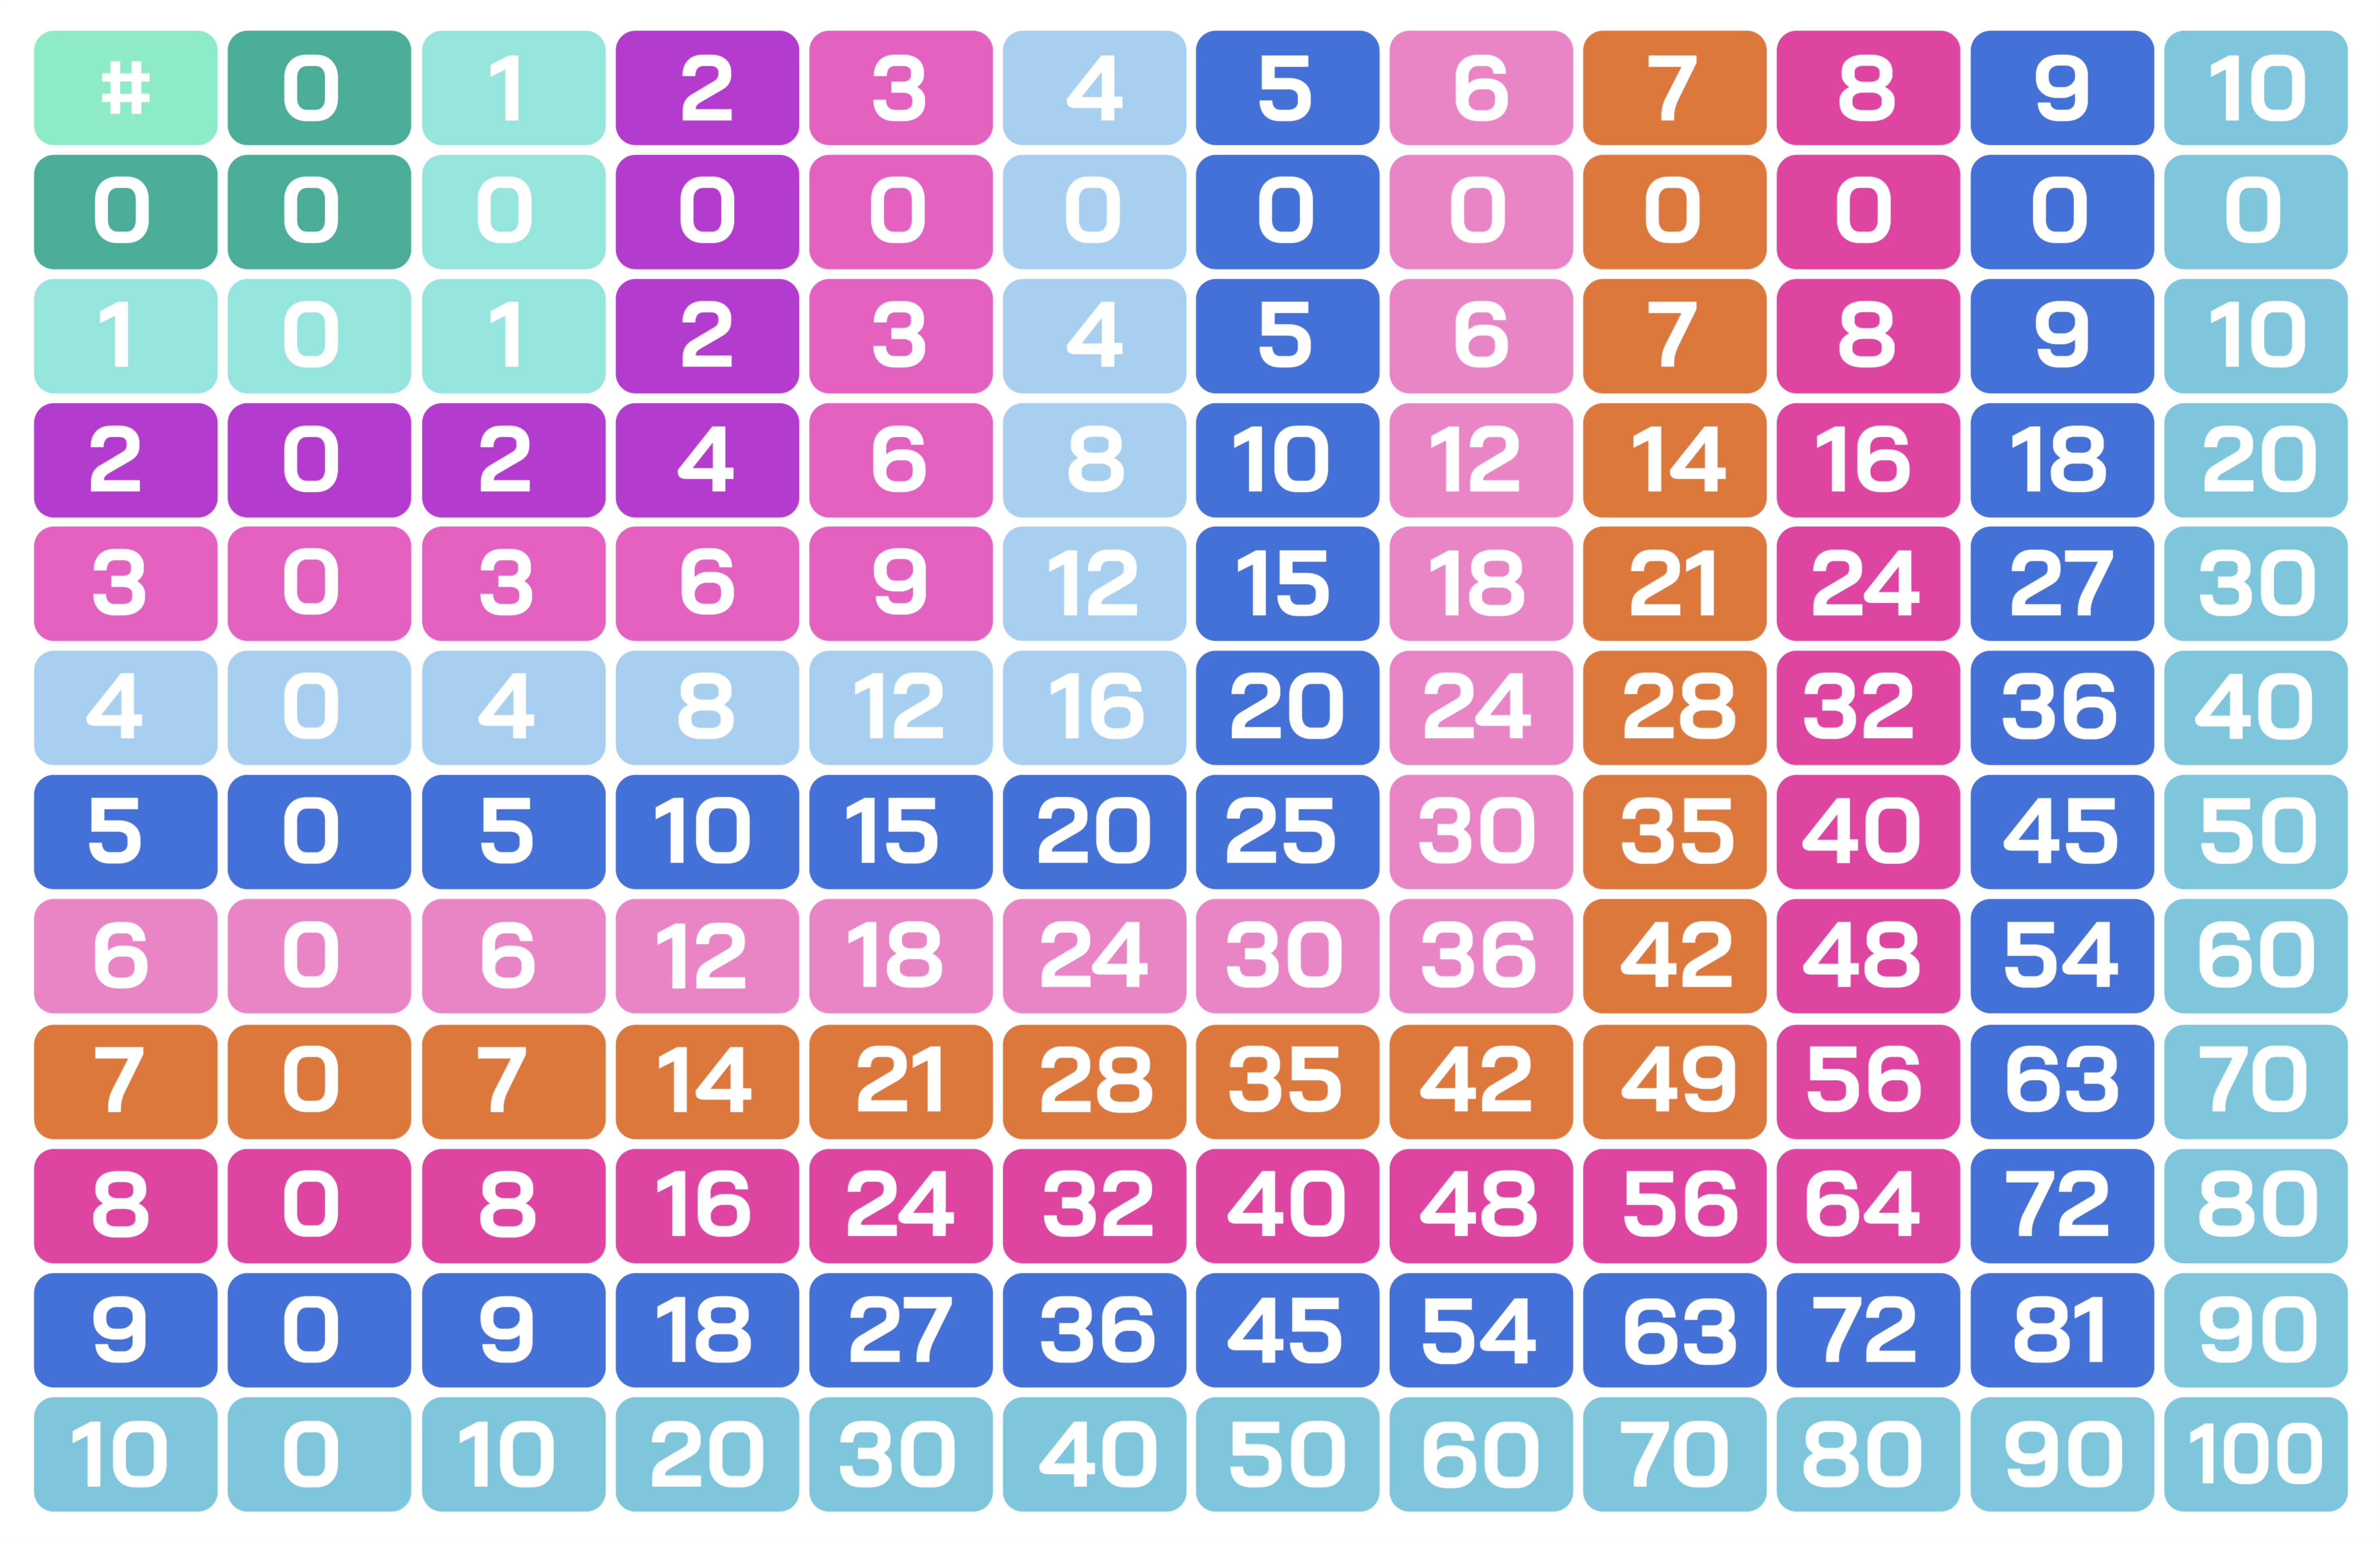
Multiplication Table from 0 to 10 – Vector Illustration for Education and Learning
A multiplication table from 0 to 10 represented as a vector illustration is one of the most valuable visual learning tools in early mathematics education. Its purpose goes far beyond listing numbers — it transforms multiplication from an abstract numerical operation into a clear, structured, and memorable pattern. When designed thoughtfully, the table becomes a foundation for how children and learners of all ages begin to understand number relationships, arithmetic fluency, mental calculation, and real-world problem solving. A multiplication chart forms the backbone of many later mathematical concepts, and representing it as a vector graphic elevates it into a clean, scalable, engaging teaching resource suitable for textbooks, classroom posters, educational apps, printable worksheets, learning dashboards, and interactive games.
The strength of a 0 to 10 multiplication table lies in its completeness. It includes the full spectrum of early multiplication: the zeros that illustrate the concept of total absence, the ones that reinforce identity properties, and the gradual progression up to tens which help learners see symmetry and patterns. The vector layout arranges these values into a grid where rows and columns meet, defining products visually at the intersection of two quantities. This simple structure teaches students that multiplication is not random — it is predictable, repeatable, and reciprocal. For example, when a student sees 4 × 7 and 7 × 4 in the grid occupying the same product value, symmetry becomes intuitive instead of memorized under pressure. Through vector clarity and clean organization, the table trains the learner’s brain to recognize multiplication as a structured pattern rather than a list of isolated facts.
The tabular format also builds mathematical confidence. Every row tells a story: the 2-times row shows doubling; the 5-times row introduces halfway to ten often used for estimation; the 10-times row reinforces place value; and the 3, 4, 6, 7, 8, and 9 rows develop automaticity. Vector illustration allows these rows to be color-coded or highlighted visually, helping the learner decode the structure of mathematics at a glance. Some designs use alternating colors for rows, rainbow gradients for motivational appeal, or soft educational palettes that keep attention without overwhelming the eye. No matter the style, the visual clarity of vector graphics ensures that the table stays readable in small or large dimensions.
One of the most important elements of a modern multiplication table illustration is visual engagement. Children learn better when graphics feel friendly and motivating rather than formal and intimidating. Rounded cells, smooth typography, visual separators, icons, or subtle thematic decorations (like stars, geometric shapes, classroom symbols, or friendly characters) can encourage curiosity rather than anxiety. At the same time, the vector format maintains neat alignment so that the grid never loses precision — making it ideal for both playful early-learning environments and academic mathematics settings.
A 0 to 10 multiplication table is also invaluable for advanced cognitive development, even beyond basic arithmetic. Repeated exposure helps learners:
• understand relationships between operations (multiplication and division)
• recognize patterns and number families
• estimate results in mental math
• build speed and fluency for higher grade mathematics
• prepare for algebraic reasoning and factor logic
What makes the vector format uniquely powerful is that it can be transformed into multiple learning modalities without losing quality. It can be turned into:
✔ printable classroom posters and charts
✔ interactive drag-and-drop learning activities
✔ animated multiplication games and recitation tools
✔ math flashcards and learning badges
✔ UI elements in educational apps and websites
✔ reward boards for classroom progress tracking
Because vector lines are infinitely scalable, the same graphic can become a pocket-size learning card one day and a large wall poster the next, without losing clarity or readability.
Typography and numeric proportion also matter in how well the multiplication chart supports memory. Large numbers with generous spacing help new learners who are still decoding characters. Balanced alignment between rows and columns reinforces order. Some versions highlight diagonal values to emphasize squares (1×1, 2×2, 3×3 … 10×10), making abstract terms like “square numbers” visually intuitive long before students reach algebra. Others add soft visual shading to teach the commutative property — showing that 3×8 and 8×3 point to the same outcome so that students internalize efficiency without memorizing two separate facts.
Because multiplication becomes a lifelong foundational tool — in measurement, budgeting, time, geometry, and advanced sciences — early confidence matters. A clean vector chart shapes the learning environment into a space where mathematics feels understandable rather than mysterious. When students repeatedly interact with a multiplication table that is aesthetically pleasing, intuitive, and approachable, their emotional relationship with math strengthens. Instead of memorization through pressure, they begin to predict results naturally by recognizing patterns — which is the true heart of mathematical thinking.
Ultimately, a multiplication table from 0 to 10 vector illustration for education and learning is not merely a chart of numbers. It is a springboard into numerical logic, school readiness, and academic confidence. When designed with care — through proportionate spacing, smooth shapes, child-friendly colors (or sleek academic tones depending on context), and crisp vector accuracy — it becomes a timeless tool that supports both early learners and advanced thinkers. It turns multiplication from a challenge into a visual language and reminds every student that mathematics is not something to be feared — it is something to be built, understood, and mastered step by step.