Quadratic Function Explained: Graph, Equation, and Parabola Properties in Mathematics
A quadratic function stands as one of the most important ideas in mathematics because it introduces a rich relationship between algebraic expressions and geometric shapes. Although it appears simple at first, it forms the foundation for vast areas of science, engineering, physics, economics, computer graphics, and data modeling. A quadratic function is recognized by its distinctive U-shaped graph, known as a parabola, and by the fact that it models situations where change does not happen at a constant rate but accelerates or decelerates over time. Whether describing the arc of a thrown ball, the shape of satellite dishes, the profit curve of a business, or the acceleration of objects under gravity, quadratic behavior surrounds real-world systems in numerous fields. Because of this broad applicability, understanding how the expression of a quadratic function links to the visual shape of its graph gives learners a powerful tool for interpreting patterns and predicting outcomes in dynamic environments where values rise or fall according to increasing or decreasing rates rather than steady motion.
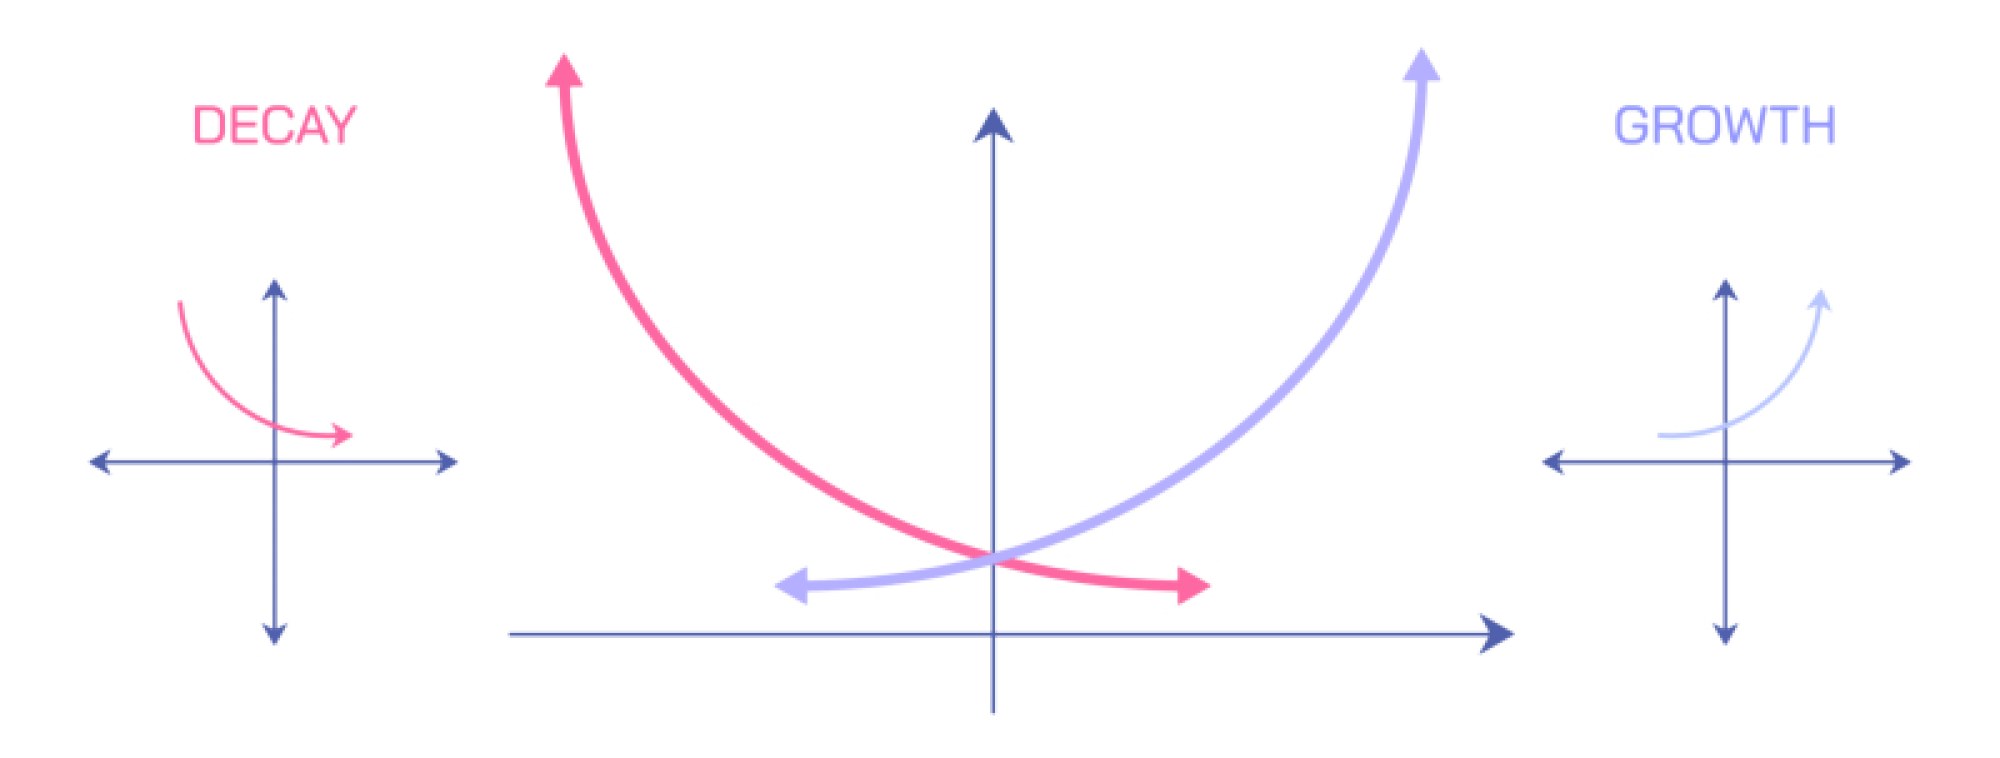
At the heart of the quadratic function lies the parabola, a smooth, curved shape that opens either upward or downward depending on the sign of the leading term in the function. When the parabola opens upward, its lowest point becomes the vertex, representing the minimum value of the function. When it opens downward, the vertex becomes the maximum value. This single point holds a special place because it marks the exact transition from decreasing to increasing values or from increasing to decreasing values along the curve. While linear functions change at a constant rate and therefore draw straight lines on a coordinate plane, quadratic functions create changing rates, making the slope steeper as one moves away from the vertex in both directions. This unique curvature illustrates acceleration visually and helps learners grasp non-uniform change in physical systems, economic data, and geometric phenomena. The axis of symmetry, an invisible vertical line passing through the vertex, divides the parabola into two mirror-image halves, reinforcing the idea that the behavior of a quadratic function is balanced around a central turning point. This symmetry plays a crucial role in solving mathematical problems because it allows predictable relationships between input and output values.
The graph of a quadratic function not only displays the location of the vertex but also reveals how stretched or compressed the parabola appears. The steepness of the parabola reflects how quickly values grow as they move away from the vertex. A steep parabola narrows sharply and demonstrates rapid increase or decrease, while a wide parabola opens more gradually, showing slower change across the domain. This variation stems from the magnitude of the leading coefficient in the function. A larger value increases the parabola’s steepness, whereas a smaller value makes it appear wider and softer in curvature. In many real-world models, this coefficient becomes a measure of intensity, such as the severity of acceleration, the aggressiveness of growth or decline, or the rate at which forces change with distance. Observing and analyzing the graph makes it possible to interpret such behavior even without calculating explicit numerical values.
Every quadratic function can be connected to particular points of interest on the coordinate plane, and the most commonly examined among these are the intercepts. The vertical intercept reflects the output value when the input value equals zero, and it indicates where the parabola crosses the vertical axis. This point helps anchor the parabola within the graph and functions as a quick reference for understanding the overall position of the curve. The horizontal intercepts, often called zeros or roots, represent the input values for which the output equals zero. These points show where the parabola intersects the horizontal axis and mark the solutions of the function when evaluating the scenario in which the dependent variable becomes zero. Sometimes a parabola touches the horizontal axis only once, creating a single repeated solution, while other times it never intersects the horizontal axis at all, meaning the function does not reach zero in real-number values. These cases reflect deeper geometric and algebraic interpretations, encouraging students to connect visual properties with symbolic understanding.
Different written forms of a quadratic function illuminate different aspects of its behavior. One standard way of expressing it emphasizes the algebraic composition and general structure of the relationship. Another method focuses on the vertex and highlights the significance of horizontal and vertical shifts, making it easier to identify the exact location of the turning point and understand how changes in symbolic constants affect the graph’s shape and position. A third representation emphasizes the factorable structure of the function, making the solutions and horizontal intercepts visible immediately. Each representation becomes useful in different contexts. Engineers modeling parabolic reflectors may prioritize features related to symmetry and the vertex, economists analyzing profit functions may examine maximum or minimum points, and scientists studying motion may focus on the intercepts that correspond to time-dependent scenarios such as impact or return to origin. In every case, the form chosen reflects the nature of the problem being solved, proving that algebraic flexibility expands mathematical power.
As students develop mathematical fluency, quadratic functions form a gateway to conceptual depth because they encourage reasoning on multiple levels. Algebraic reasoning explains how output values come from input values, graphical reasoning interprets these outputs visually, and contextual reasoning connects the mathematics to real-world interpretations and predictions. For instance, when modeling the height of an object thrown into the air, the vertex of the parabola identifies the moment of peak elevation, and the horizontal intercepts indicate the times at which the object begins its journey and then returns to the ground. In financial models, the vertex may show the optimal production level that maximizes profit, and the steepness of the parabola indicates how quickly profit declines when production deviates from that ideal point. Even in computer imaging, the curvature of a parabola becomes part of rendering curves, simulating gravity, and generating smooth transitions in animations. The ability of one mathematical structure to apply seamlessly to widely different domains illustrates the unifying nature of quadratic functions across intellectual disciplines.
Learning to analyze parabolas also shapes mathematical intuition by teaching that not all change is linear or predictable. In quadratic scenarios, progress can begin slowly and then expand rapidly, or it can grow fast at first and then level off or decline. The concept of curvature becomes a powerful mental model for thinking about acceleration, optimization, limits, and turning points. This mental model extends beyond the classroom and influences how people interpret information presented in graphs—from sports performance statistics to scientific research data. Quadratic reasoning deepens a sense of pattern recognition, demonstrates how multiple representations of information reinforce each other, and nurtures confidence when approaching more advanced mathematical content.
Ultimately, the study of quadratic functions highlights the beauty of mathematics as an interconnected language of structure and logic. A single curve, drawn from a simple algebraic expression, embodies symmetry, acceleration, optimization, prediction, and transformation. It teaches that numbers and shapes are inseparable partners in describing reality and that phenomena ranging from planetary motion to architectural designs can be understood through the same mathematical lens. Whether one appreciates quadratics for their geometric elegance or for their practical applications, they remain one of the most expressive and meaningful tools developed in mathematical history. They reveal how systematic reasoning transforms abstract symbols into vivid models of the world, demonstrating that even within a single curve lies a profound story of motion, equilibrium, and relationships.