Display Aspect Ratio Showing Screen Dimensions, Resolution, and Pixel Ratio Comparison
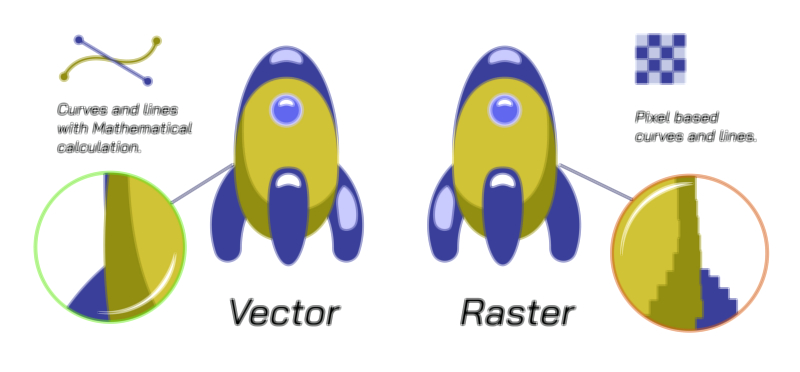
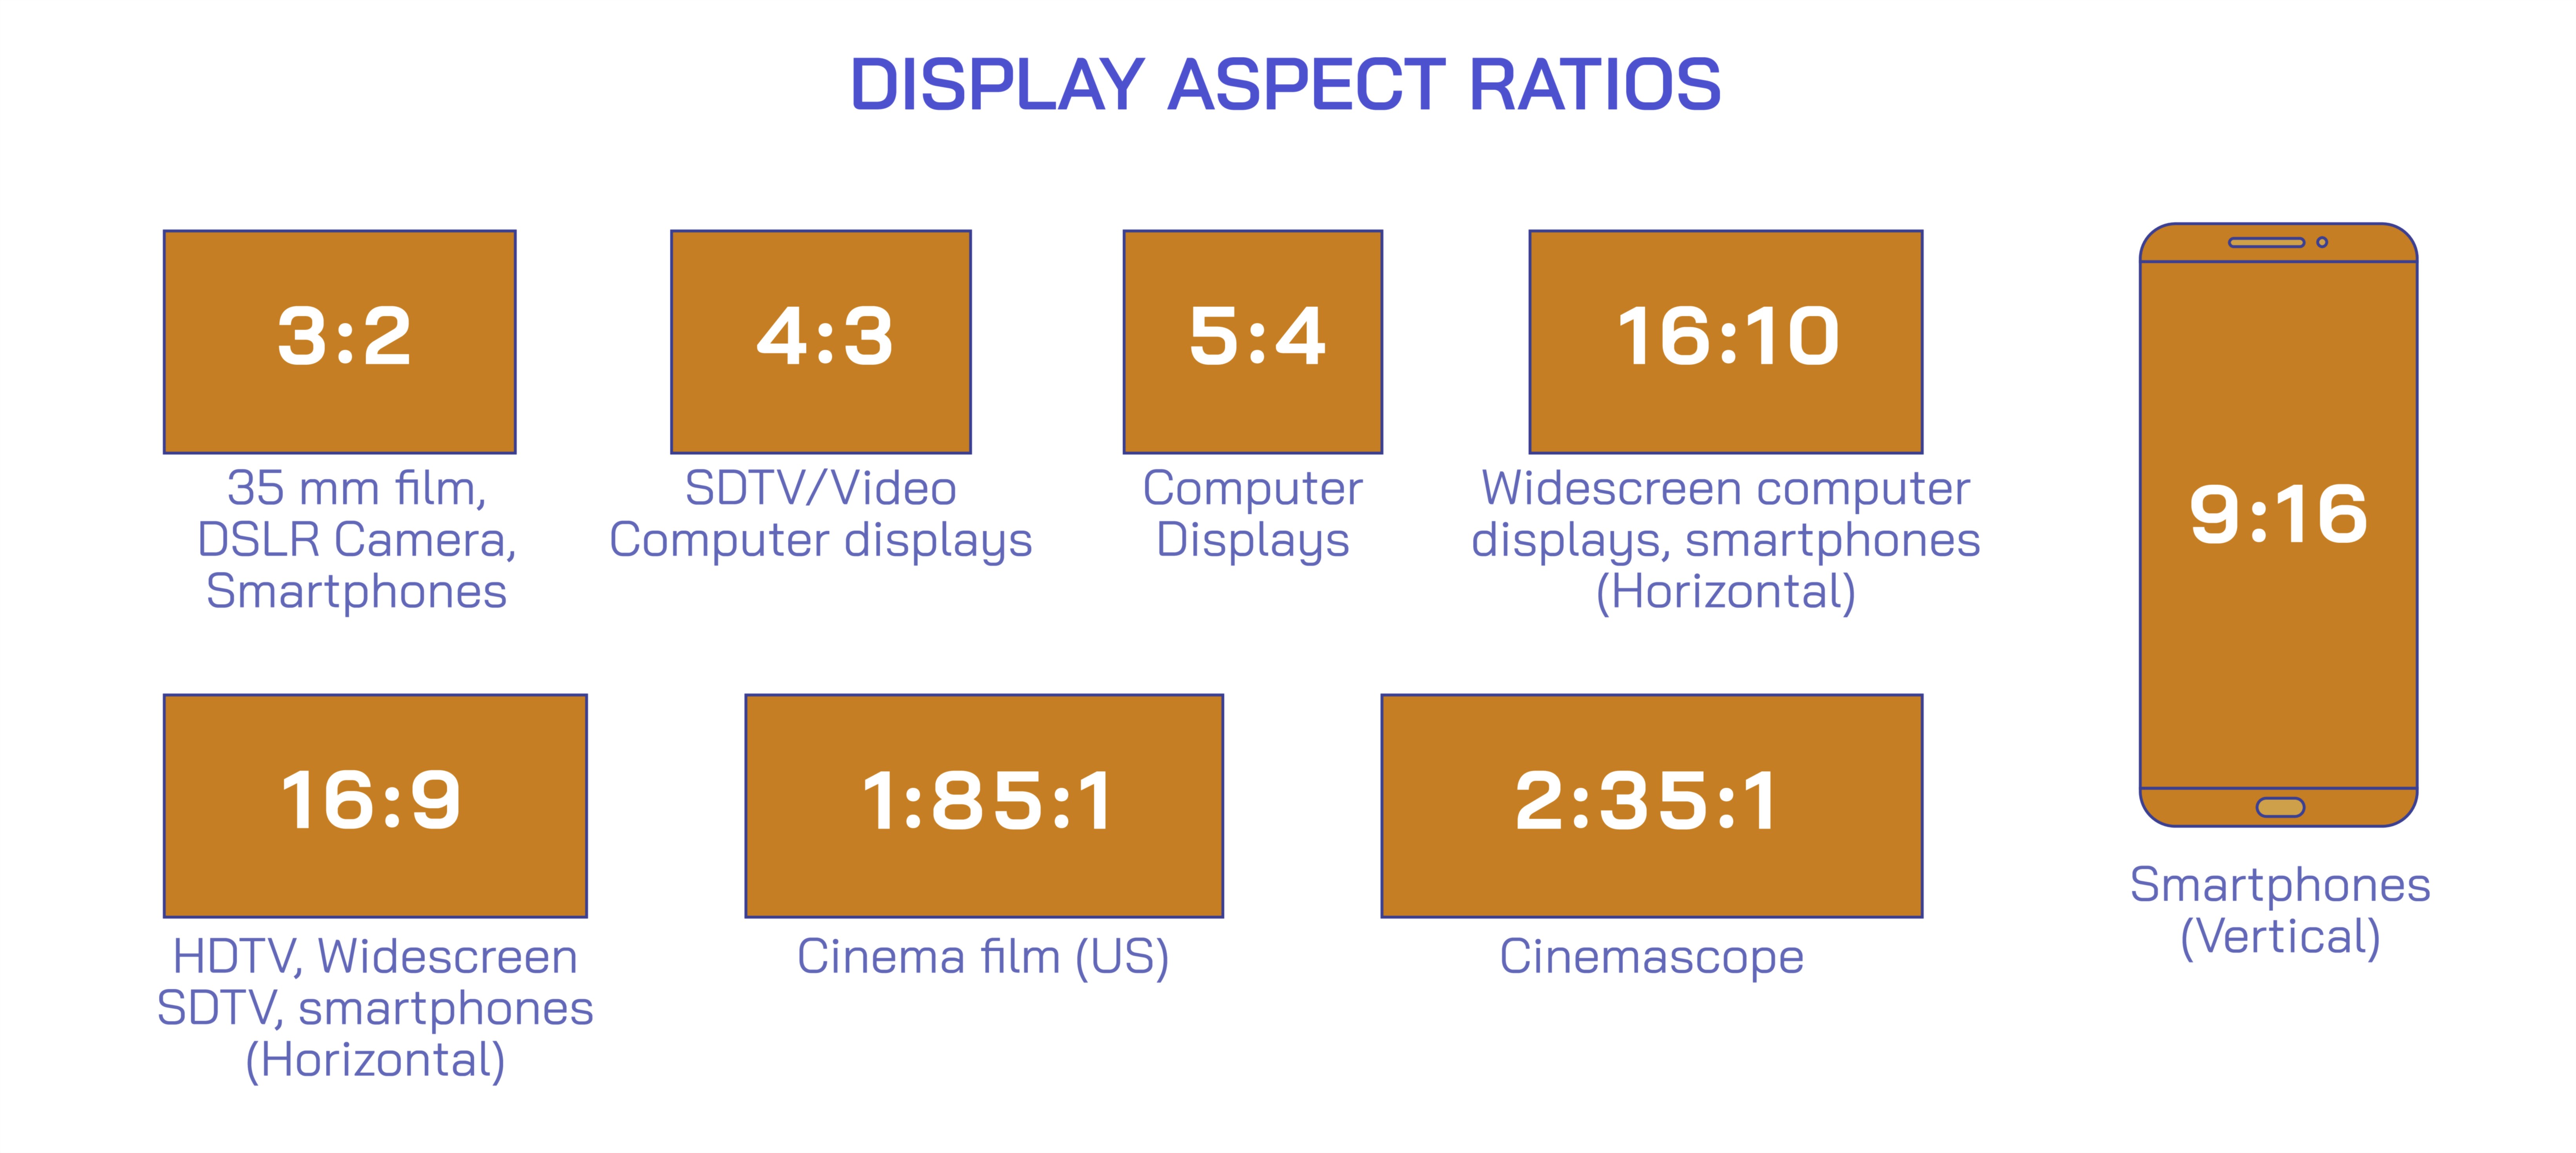
Display aspect ratio is a fundamental concept in digital imaging, video production, and screen technology, defining the proportional relationship between a screen’s width and height. A vector illustration of display aspect ratios typically depicts multiple screen formats side by side, highlighting their screen dimensions, resolution, and pixel ratio, providing an intuitive visual understanding of how screens differ and how images or videos are displayed without distortion. Such diagrams are widely used in technology education, design, and multimedia production to explain compatibility, scaling, and visual presentation across devices.
At its core, the aspect ratio is expressed as a ratio of width to height, written in the format W:H. Common ratios include 4:3, historically standard for televisions and early computer monitors, 16:9, prevalent in modern HDTVs, laptops, and smartphones, and 21:9, used in ultrawide monitors for cinematic or productivity purposes. In a vector illustration, each screen is depicted as a rectangle labeled with its ratio, with proportional dimensions scaled visually to show the differences in width relative to height. This allows viewers to immediately see that a 16:9 screen is wider than a 4:3 screen of the same height, emphasizing how content fills the display and how unused space or letterboxing may appear when mismatched ratios are used.
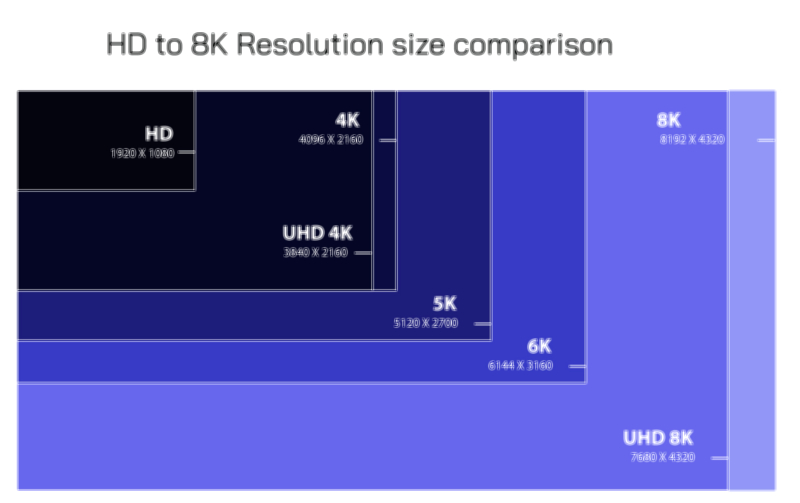
Screen dimensions in the illustration often accompany the aspect ratio to give context in terms of physical size, measured in inches or centimeters diagonally, or as pixel dimensions. For example, a 16:9 screen may have a resolution of 1920x1080 pixels (Full HD), whereas a 4:3 screen may be 1024x768 pixels. Vector diagrams frequently overlay gridlines representing pixels on the screens to demonstrate how resolution relates to aspect ratio. This helps viewers understand that higher resolutions allow for more detailed images but do not alter the inherent width-to-height ratio of the display. A 4:3 screen with high resolution still maintains the squarer proportions, while a 16:9 screen offers a wider, cinematic viewing area even at the same pixel density.
The pixel ratio, also called the pixel aspect ratio (PAR), represents the shape of individual pixels. Most modern displays use square pixels (1:1), but some older or specialized displays may have rectangular pixels. Vector illustrations often highlight pixel grids to show how non-square pixels distort images if aspect ratios are mismatched. For example, a video formatted for 16:9 may appear stretched or compressed on a 4:3 display if the pixel aspect ratio is not properly adjusted. By showing both the screen dimensions and the pixel grid, the illustration connects abstract numerical ratios to the physical manifestation on a screen, clarifying why understanding both resolution and aspect ratio is essential for accurate content display.
In addition to side-by-side screens, a vector illustration may include arrows or markers to show how content scales across different aspect ratios. For example, a 4:3 image placed on a 16:9 screen may display black bars (letterboxing) to preserve the original ratio, whereas a 16:9 video on a 4:3 screen may require cropping or stretching. By visualizing these adjustments, the diagram educates viewers on practical issues in video production, broadcasting, and digital media, highlighting the importance of choosing the correct aspect ratio for intended devices.
Vector illustrations may also annotate common device examples, such as smartphones, laptops, monitors, televisions, and projectors, to connect theoretical ratios with real-world applications. This helps users understand why widescreen monitors are preferred for modern media and why square or near-square formats were common in older computing systems. Color-coding or labeling may differentiate ratios visually, making it easier to compare multiple screens in a single diagram.
Finally, the illustration often shows the mathematical relationship between screen resolution and aspect ratio, emphasizing that while resolution measures the total number of pixels, aspect ratio determines how these pixels are arranged spatially. This distinction explains why two screens with the same pixel count can display content differently: one may appear stretched horizontally or vertically depending on its width-to-height ratio.
By integrating screen shapes, pixel grids, resolutions, and numerical ratios, a vector illustration of display aspect ratios provides a comprehensive view of how screens function in both technical and visual terms. It clarifies the relationship between physical dimensions, resolution, and pixel arrangement, enabling designers, engineers, and content creators to make informed decisions about display technology, video formatting, and multimedia presentation.