Cosine Function Showing Graph, Angle Relationship, and Trigonometric Curve in Mathematics
The cosine function is one of the fundamental trigonometric functions in mathematics, describing the relationship between an angle and the ratio of the adjacent side to the hypotenuse in a right-angled triangle. Beyond triangles, it also defines smooth periodic oscillations in waveforms, circular motion, and countless applications in physics, engineering, and signal processing. A vector illustration of the cosine function typically combines three interrelated perspectives: the graph of the function, the angle-to-ratio relationship in a unit circle, and the trigonometric curve over a domain of angles. Together, these visualizations make the abstract concept of cosine tangible, showing how angles translate into continuous values and how this periodicity forms the basis for oscillatory phenomena.
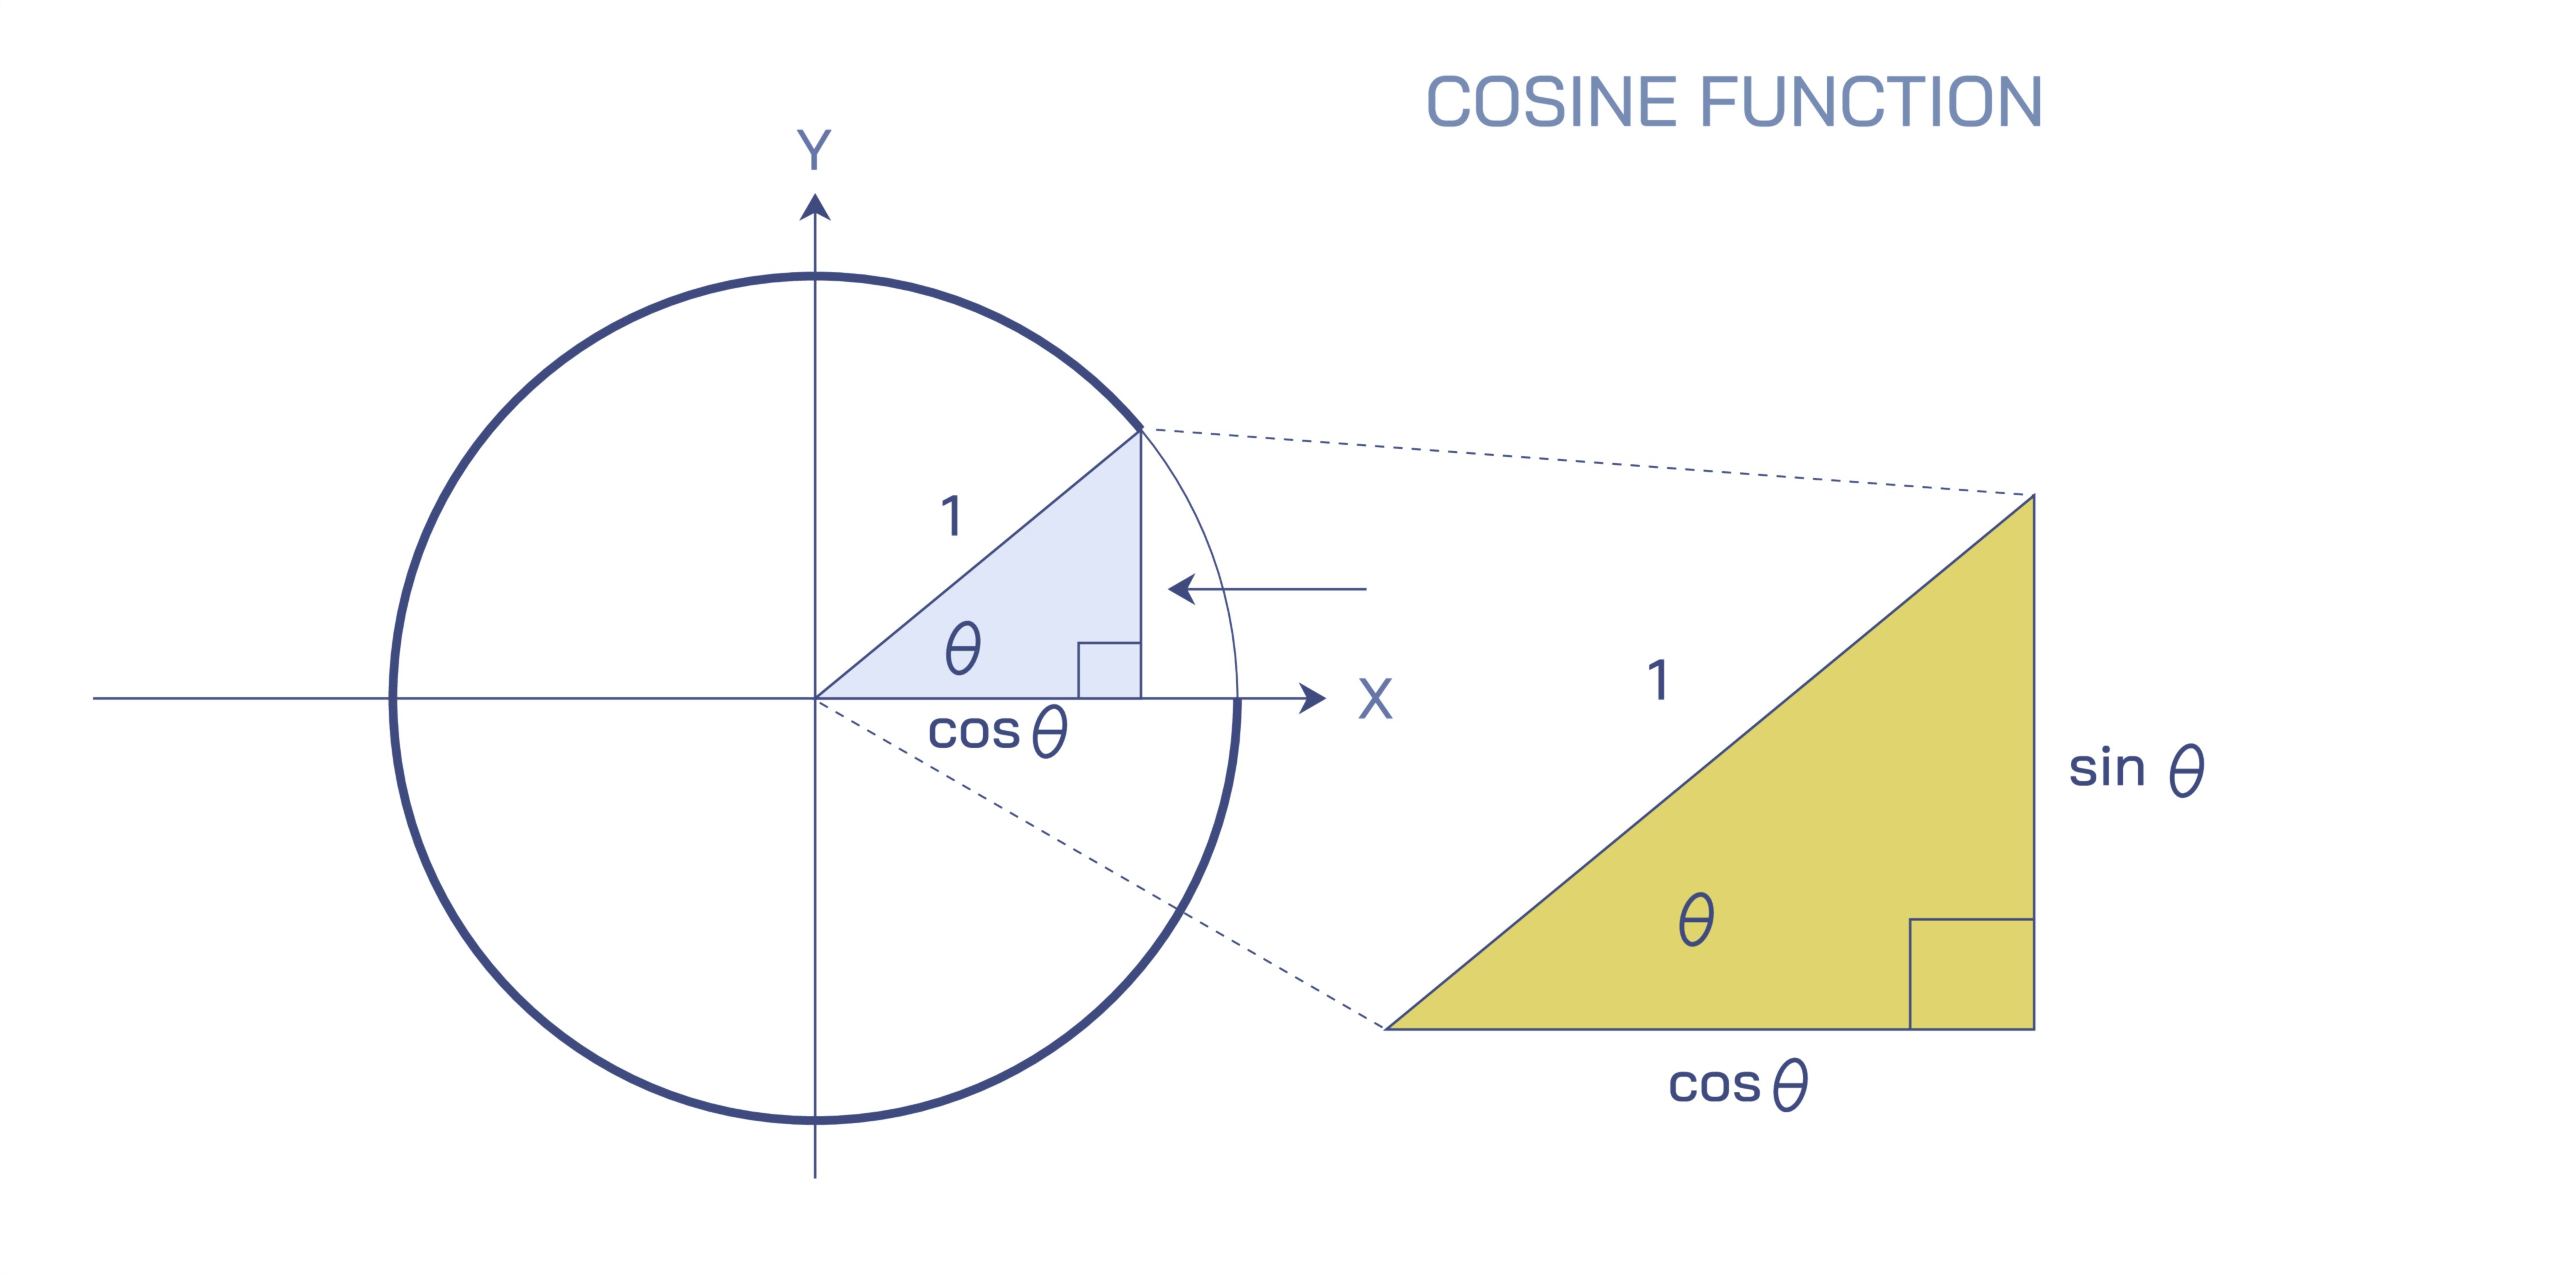
At the geometric level, the cosine of an angle is represented on the unit circle, where a circle with radius 1 is centered at the origin of a coordinate plane. For any angle measured from the positive x-axis, the x-coordinate of the point on the circumference corresponds to the cosine of that angle. Vector illustrations often depict a radius vector extending from the origin to the circumference, forming an angle θ with the x-axis. A horizontal projection from the tip of the radius to the x-axis highlights the value of cos(θ), showing visually how cosine captures the component of the radius along the horizontal axis. This relationship links rotation and linear projection, explaining why the cosine function naturally oscillates between +1 and -1 as the angle progresses around the circle. The unit circle view allows students and professionals to see cosine as a spatial, geometric quantity rather than just a number derived from a formula.
The cosine curve or graph plots these values against the angle θ along a horizontal axis. The curve oscillates smoothly, reaching a maximum of 1 at θ = 0°, 360°, etc., and a minimum of -1 at θ = 180°, forming a wave that repeats every 360° (or 2π radians). Vector illustrations often highlight the amplitude, period, and zero-crossings of the curve to clarify the behavior of the function. The amplitude is the distance from the centerline (y=0) to the peak or trough of the curve, always equal to 1 for the standard cosine function. The period is the distance along the horizontal axis for one complete cycle, showing how the function repeats periodically. Zero-crossings occur at θ = 90° and 270°, where the projection of the radius on the x-axis is zero. This periodicity is what makes cosine indispensable for modeling oscillatory phenomena, from simple pendulums to alternating current in electrical circuits.
0. In a vector illustration, this symmetry can be visualized by showing equal projections of the radius vector for positive and negative angles, emphasizing the reflective nature of the function. Phase shifts, which translate the curve horizontally, are commonly illustrated by moving the wave left or right to show how cosine can model delayed or advanced oscillations in real-world systems. These shifts are central to analyzing harmonic motion, alternating current signals, and Fourier decomposition in mathematics and engineering.
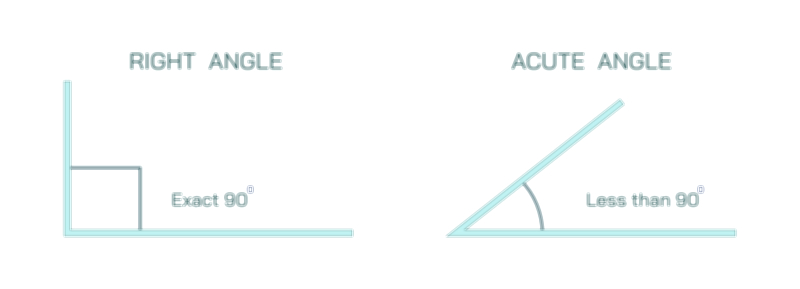
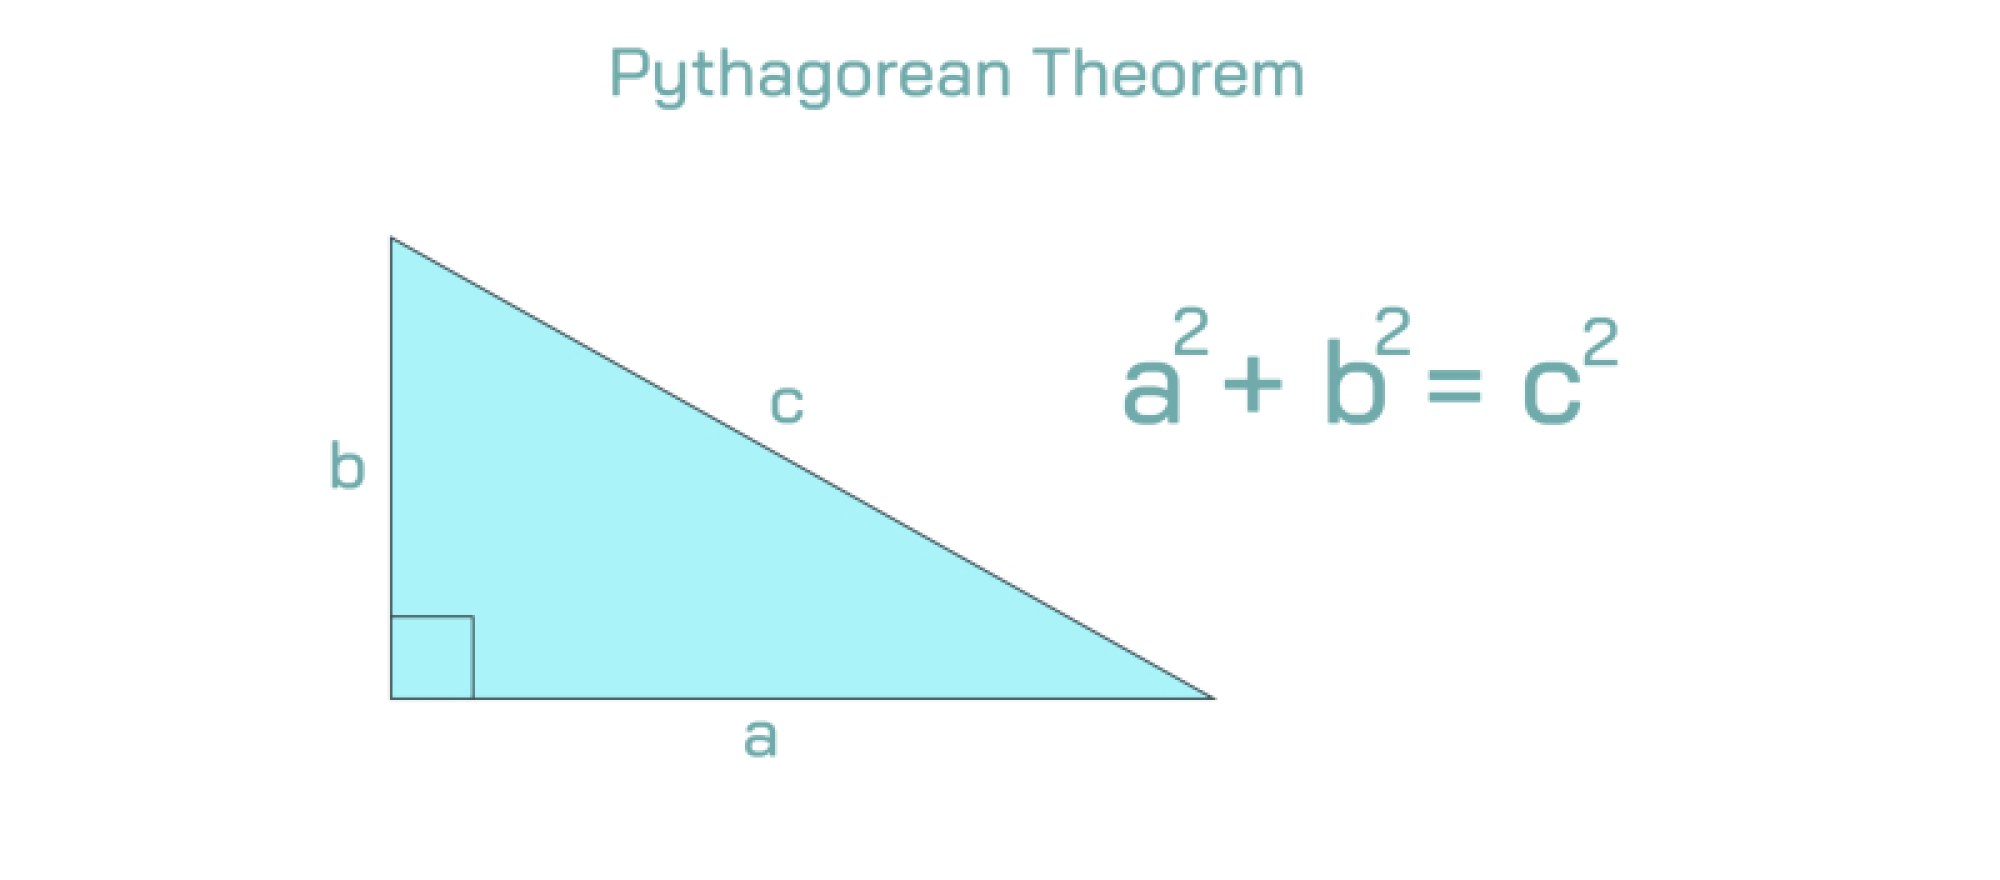
The vector illustration also often highlights the angle relationship in right triangles, connecting the unit circle interpretation to classical trigonometry. For a right triangle, cosine is the ratio of the length of the adjacent side to the hypotenuse. This simple ratio underpins the values of cosine at familiar angles, such as 0°, 30°, 45°, 60°, and 90°, which are often labeled on the unit circle or on the graph. By showing this angle-to-ratio correspondence alongside the oscillating curve, the illustration unites discrete geometric intuition with continuous mathematical representation, making it easier to see how cosine governs both linear triangles and periodic phenomena.
Applications of the cosine function extend far beyond pure mathematics. In physics, the horizontal component of motion in circular motion, oscillation of springs, and wave behavior are described using cosine. In engineering, signal processing, alternating current, and vibration analysis all rely on cosine to represent periodic changes. In computer graphics, cosine functions help model lighting angles and smooth rotations. A vector illustration may therefore include multiple representations — the triangle, the unit circle, and the wave — simultaneously, emphasizing the versatility and universality of the cosine function.
A complete vector illustration of the cosine function typically includes:
A unit circle with a radius vector forming an angle θ from the x-axis
Horizontal projection of the radius vector showing cos(θ)
A trigonometric curve plotting cos(θ) versus θ with marked amplitude, period, peaks, troughs, and zero-crossings
Angle markers on the unit circle and corresponding points on the curve to demonstrate the mapping from rotation to value
Symmetry indicators showing the even nature of the function
Through these combined elements, the illustration makes both geometric and functional interpretations of cosine explicit. The x-coordinate of a rotating vector, the ratio in a triangle, and the smoothly oscillating curve all describe the same underlying mathematical reality. This multidimensional visualization allows students, engineers, and scientists to grasp not only how the function behaves mathematically, but also why it is foundational for describing periodic, rotational, and wave phenomena in the natural and technological world.