Probability Distribution – Understanding How Outcomes Are Spread, Why Random Events Follow Patterns, and How Distributions Explain Uncertainty, Risk, and Real-World Decision Making in Statistics
A probability distribution is one of the most fundamental and powerful ideas in statistics because it describes not just whether something might happen, but how likely each possible outcome is. Rather than thinking of randomness as chaotic or unpredictable, a probability distribution reveals that random processes follow regular and measurable patterns when observed over many trials. Every uncertain phenomenon — from rolling a dice and rainfall measurement to stock market changes, exam scores, life expectancy, medical risk, machine performance, and customer behavior — follows some kind of probability distribution. It tells us how probability is spread across all possible results, whether those results are simple and discrete, like numbers on a dice, or continuous and infinitely detailed, like human height or temperature. The distribution becomes the blueprint of random behavior and allows mathematicians, scientists, economists, doctors, insurers, engineers, and researchers to analyze uncertainty in a way that produces meaningful predictions and real-world decisions. Understanding the nature of probability distributions helps turn raw data into patterns, patterns into insights, and insights into actions.
A probability distribution can be thought of as a map of uncertainty. If someone tosses a coin, the distribution assigns a probability of 0.5 to heads and 0.5 to tails. If we roll a fair six-sided dice, the distribution assigns 1/6 probability to each number from one to six. These are simple examples of discrete distributions, where the outcomes take countable values and each outcome has a specific probability. In real life, discrete distributions appear in many situations: the number of customers arriving at a store during an hour, the number of emails a person receives per day, the number of defective items in a batch of products, or the number of goals scored in a match. The distribution tells us not just what values are possible but also how frequently they occur on average. If we know that most days a store gets around ten customers but occasionally very few or very many, this information helps owners forecast staffing, supplies, marketing, and costs. The power of probability distributions becomes clear when discrete patterns reveal trends behind randomness and guide decision making.
Some random variables can take not just a limited number of values but infinitely many values across a range. These belong to continuous probability distributions, which describe phenomena that vary smoothly over real numbers rather than integers. Human heights, atmospheric pressure, speed of vehicles, study hours, reaction time, body temperature, and crop yield are continuous quantities. For these, probability is expressed across intervals rather than exact numbers. The distribution reflects how values cluster and spread: whether most people fall close to the average height or whether the spread is wide, whether fuel efficiency varies only slightly or greatly, whether test scores for a class are tightly grouped or widely scattered. Continuous distributions are essential because many measurements in nature and society are continuous rather than discrete. They provide a mathematical representation of tendencies and patterns in large datasets and enable estimates about future observations even when there is uncertainty.
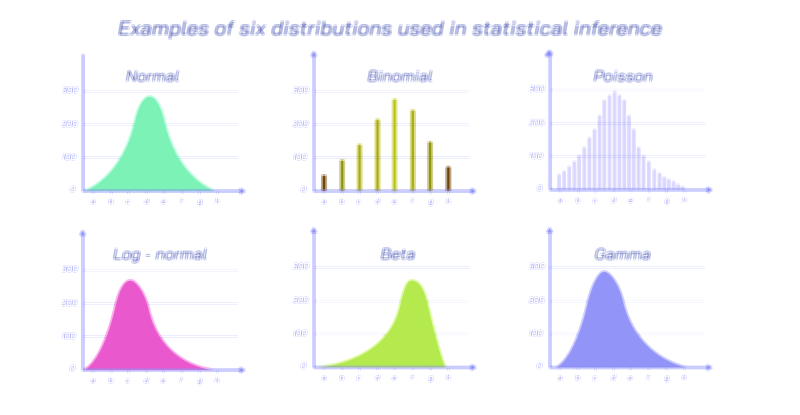
Among all probability distributions, the normal distribution is the most famous. Often shaped like a symmetric bell curve, the normal distribution appears in many natural and social processes because of the law of large numbers: small independent influences accumulate and produce variability that centers around an average. Whether analyzing students’ exam performance, blood pressure levels, manufacturing precision, or measurement errors in science, the normal distribution helps describe outcomes that are most likely near the mean and become increasingly rare as they deviate far from it. The standard deviation controls the spread of the bell curve — a smaller value results in a narrower curve with most outcomes near the average, while a larger value indicates wide variation. The intuitive shape of the normal distribution makes it the foundation of statistical inference, confidence intervals, hypothesis testing, and quality-control analysis. It also connects mathematics with everyday observations: most people are neither extremely tall nor extremely short, most workers take neither extremely long nor extremely short commutes, and most test scores fall somewhere near the center.
Other probability distributions help model events with different types of behavior. Some random processes deal with counts that occur over time or space rather than measured values. In such cases, the Poisson distribution is useful — for example, modeling the number of phone calls received by a helpline in an hour, the number of earthquakes occurring in a year in a region, or the number of misprints in a printed page. The Poisson distribution highlights the idea that certain events do not occur at regular intervals but follow predictable long-run averages. If we know a call center receives on average thirty calls per hour, we can estimate whether it is likely to experience fifty calls in a busy hour or ten calls in a quiet hour. Similarly, when measuring waiting time or time between events rather than counts of events, the exponential distribution plays a central role. It models the time until the next arrival, the time between machine failures, or the time between clicks on a website, making it essential in risk analysis, queueing theory, and reliability engineering.
Another important distribution is the binomial distribution, which is suitable when analyzing repeated yes-or-no outcomes. In a binomial model, each trial has only two possible results — success or failure — and the probability stays the same across trials. Whether evaluating the probability of patients responding to treatment, voters supporting a proposal in a poll, customers purchasing a product, or a basketball player scoring free throws, the binomial distribution helps make predictions about multiple repeated attempts with the same probability of success. When the probability of success is small and the number of trials becomes large, the binomial distribution transitions naturally into the Poisson distribution, showing that different probability models are deeply connected rather than isolated.
Not all random variables follow symmetric behavior. Some distributions are skewed, meaning one tail is longer than the other. Income levels, housing prices, and insurance claims are typically right-skewed because most people earn moderate amounts while a small number earn much higher incomes, producing a long tail on the right. In contrast, physical measurements like time to recovery or fatigue testing may show left-skewed behavior when most values are high but a few decline steeply. Probability distributions help reveal whether data are symmetric, skewed, heavy-tailed, or narrow — and this visual and numerical analysis is essential for identifying patterns in financial forecasting, medical diagnostics, business performance modeling, and environmental research. The distribution is the lens through which analysts examine uncertainty and variation.
Probability distributions also drive decision making under uncertainty, a core function of statistics. Insurance companies estimate risk and set premiums using distributions of accidents, health conditions, and life expectancy. Banks use statistical distributions to evaluate loan default risk and investment volatility. Weather services predict rainfall and temperature using probability distributions derived from years of historical atmospheric data. Manufacturing engineers determine acceptable tolerance ranges based on defect distributions. Data scientists train machine-learning models using distributions that describe patterns in images, language, and behavior. In each case, the distribution is the mathematical foundation behind decisions that must be made without certainty. Instead of guessing, experts quantify uncertainty and use it intelligently.
Another reason probability distributions are central to science is that they allow researchers to generalize from samples to entire populations. Because it is often impossible to measure every individual in a population, researchers rely on samples and statistical inference — a process entirely built on probability distributions. If we know that a random variable follows a certain distribution, we can estimate population parameters, build confidence intervals, test hypotheses, and make predictions with justified confidence. This is not magic; it is the systematic use of probability patterns that hold consistently across time and scale.
From an educational perspective, the idea of probability distribution teaches a conceptual truth: randomness is not disorder but structure disguised as uncertainty. When outcomes are viewed one by one, randomness appears unpredictable, but when data accumulate over time, patterns emerge and form stable distributions. This insight lies at the heart of statistical thinking — rather than asking whether an event will occur, we learn to ask how often it occurs on average or how likely it is within a range. Probability distributions turn random events into measurable behavior and random data into meaningful interpretation.
Ultimately, the idea of a probability distribution is far more than a mathematical definition. It is a way of understanding the world — a way of recognizing that uncertainty follows patterns that can be described, predicted, and used for informed decisions. Whether analyzing exam scores, predicting rainfall, designing machinery, evaluating medical outcomes, pricing insurance policies, setting investment strategies, or building artificial intelligence systems, probability distributions remain the core tools that transform variability into knowledge. By mastering their meaning, one gains the ability to interpret data, manage risk, understand change, and make decisions in a world where certainty is rare but statistical patterns are everywhere.