ØÉÅØɽØÉ©ØÉøØÉÜØÉøØÉóØÉźØÉóØÉŁØÉ▓ ØÉāØÉóØɼØÉŁØɽØÉóØÉøØÉ«ØÉŁØÉóØÉ©Øɦ ŌĆö ØÉāØÉ×ØÉ×ØÉ® ØÉäØÉ▒ØÉ®ØÉźØÉÜØɦØÉÜØÉŁØÉ©ØɽØÉ▓ ØÉäØÉØØÉ«ØÉ£ØÉÜØÉŁØÉóØÉ©ØɦØÉÜØÉź ØÉéØÉ©ØɦØÉ£ØÉ×ØÉ®ØÉŁ ØÉÆØÉ«ØÉ”ØÉ”ØÉÜØɽØÉ▓.
A probability distribution is one of the most essential and far-reaching concepts in statistics and mathematics because it describes how probability is spread over the possible outcomes of a random phenomenon. Instead of treating chance events as isolated or unpredictable occurrences, a probability distribution provides a structured way of understanding which outcomes are likely, unlikely or impossible. It gives a full map of uncertainty by assigning a probability value to each outcome or to ranges of outcomes if the variable is continuous. Every measurement or observation that involves randomnessŌĆösuch as exam scores, rainfall amount, stock market fluctuations, temperature, blood pressure, manufacturing defects, or waiting timesŌĆöbehaves according to some probability distribution. The distribution allows researchers, scientists, analysts, and engineers to interpret patterns, make predictions, design experiments, assess risks and make decisions based on evidence rather than intuition.
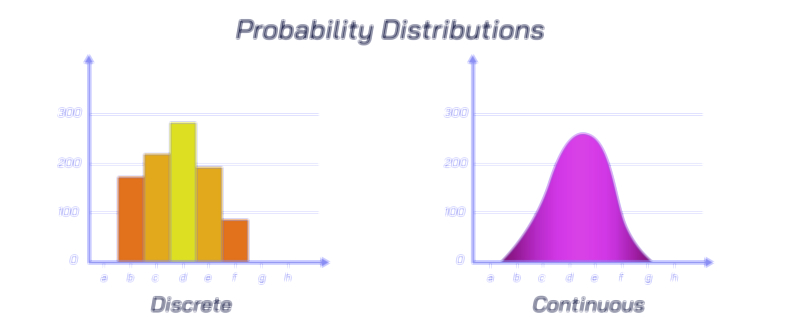
One of the key ideas behind probability distributions is that they depend on the nature of the random variable being studied. If the variable can take distinct, separate valuesŌĆösuch as rolling a die, counting customers in a shop or recording the number of goals scored in a matchŌĆöthe distribution is called discrete. In a discrete distribution, the probability assigned to each possible value can be listed or represented as separate individual points. If the variable can take infinitely many values within a rangeŌĆösuch as the exact height of a person, the time it takes for a computer to process a task or the precise voltage in a circuitŌĆöthe distribution is continuous. In that case, individual points have no measurable probability on their own; probability is assigned to intervals rather than single numbers. This distinction helps us understand that randomness behaves differently depending on whether outcomes are countable or measurable across a continuum. Despite the variation in behaviour between discrete and continuous systems, the probability distribution remains the tool that organizes uncertainty into a usable and interpretable form.
A probability distribution does more than describe chanceŌĆöit determines the pattern of likelihood in a random process. Some events follow distributions where outcomes in the center of the range are most common, while extreme outcomes are rare. Others show increasing or decreasing tendencies or randomness that clusters around certain values. For example, heights of people tend to cluster around an average, forming a bell-shaped pattern, while the number of cars passing through a tollbooth per minute may exhibit a pattern where zero or one car is more frequent but higher values appear occasionally. These patterns reveal the internal tendencies of the random process. Even though individual outcomes may vary widely, the shape of the distribution often remains stable over large numbers of observations. This regularity is what makes statistical forecasting possible and why probability theory helps make sense of complex real-world behaviour.
The concept of a probability distribution becomes more powerful when interpreted through expected patterns rather than single events. A common misconception in everyday thinking is that randomness means anything could happen and that outcomes should ŌĆ£balance outŌĆØ over short sequences. In reality, probability distributions describe how outcomes balance out statistically over long repetitions, not in isolated trials. For instance, flipping a fair coin does not guarantee a 50/50 split between heads and tails in the first few flips, but over thousands of flips the distribution of heads versus tails stabilizes around the theoretical distribution predicted by probability. This stabilizing behaviour applies widelyŌĆöfrom genetic inheritance patterns to sports statistics to the reliability of machinesŌĆöand allows information from past observations to predict and quantify future uncertainty.
A probability distribution also encodes important features of the random variable, such as its central tendency (where values cluster), variability (how spread out they are), skewness (whether the tail of the distribution is longer on one side) and kurtosis (how sharply values peak near the average). These characteristics help analysts compare different sources of data and evaluate how stable, risky, predictable or extreme the variability in a system might be. For example, two investment portfolios could have the same average return, but one might have a distribution with far greater spread, meaning a higher chance of both big gains and big losses. In manufacturing, a narrow distribution of product measurements indicates precision and quality, while a wide distribution indicates inconsistency. In medicine, distributions reveal patterns across populationsŌĆösuch as identifying what range of blood pressure is healthy and what values indicate risk. In every case, the distribution becomes a mirror that reflects the behaviour of the system under uncertainty.
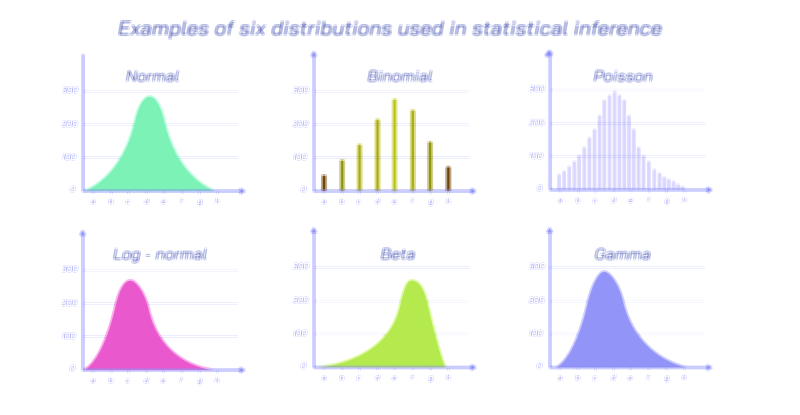
A striking part of probability distributions is that they appear repeatedly across nature and human behaviour. The normal distribution, recognizable as the bell-shaped curve, occurs naturally in situations where many small independent factors influence an outcome, such as test scores, biological characteristics, experimental errors and psychological traits. The uniform distribution arises when all outcomes are equally likely, such as a perfectly balanced roulette wheel or a fair random number generator. The binomial distribution describes repeated trials with two outcomes, such as success or failure in medical treatment studies or defect analysis in production lines. The Poisson distribution describes the number of random events occurring over time intervals, such as calls to a customer service center or errors on pages of printed text. The exponential and gamma distributions describe waiting times and lifespans of machines or chemical processes. Even heavy-tailed distributions, such as the Pareto distribution, describe wealth concentration and extreme events like natural disasters. These recurring shapes reveal that probability distributions are fundamental building blocks underlying real-world randomness.
The educational importance of understanding probability distributions goes far beyond mathematics. It enhances decision-making by replacing guesswork with structured reasoning. In public health, distributions predict disease spread and evaluate the effectiveness of interventions. In weather forecasting, they describe uncertainty in rainfall, temperature and storm risk. In business, they help determine pricing, insurance premiums, inventory optimization and market behavior. In machine learning and artificial intelligence, probability distributions are used to model uncertainty, train algorithms, estimate likelihoods and generate predictions. In scientific experimentation, distributions determine whether results are statistically meaningful rather than due to random chance. In quality control, they detect deviations that signal manufacturing defects early. The distribution is therefore a universal tool that bridges theory and application across disciplines.
The beauty of probability distributions lies in transforming randomness into structure. A single observation of a random event may appear meaningless, but a pattern emerges when many observations accumulate. The distribution provides that pattern and makes randomness measurable, analyzable and predictable. Without distributions, disciplines like economics, meteorology, psychology, biology, computer science, epidemiology and engineering would lose their predictive power. By describing how uncertainty behaves, probability distributions empower us to make decisions in an uncertain world, quantify risk, model complex systems and understand how chance interacts with natural laws.
A probability distribution is not merely about computing probabilities; it expresses the story of a random variableŌĆöwhere it tends to be, how much it fluctuates, where rare events occur and how uncertainty unfolds over time. It teaches that randomness is not chaos but a structured phenomenon that becomes intelligible when viewed through patterns rather than individual events. The distribution stands at the heart of statistics, enabling science to function, predictions to be made and knowledge to advance in an unpredictable world.