Human Body Fat Under 20% vs Over 30% Showing Muscle Definition, Fat Distribution, and Body Composition
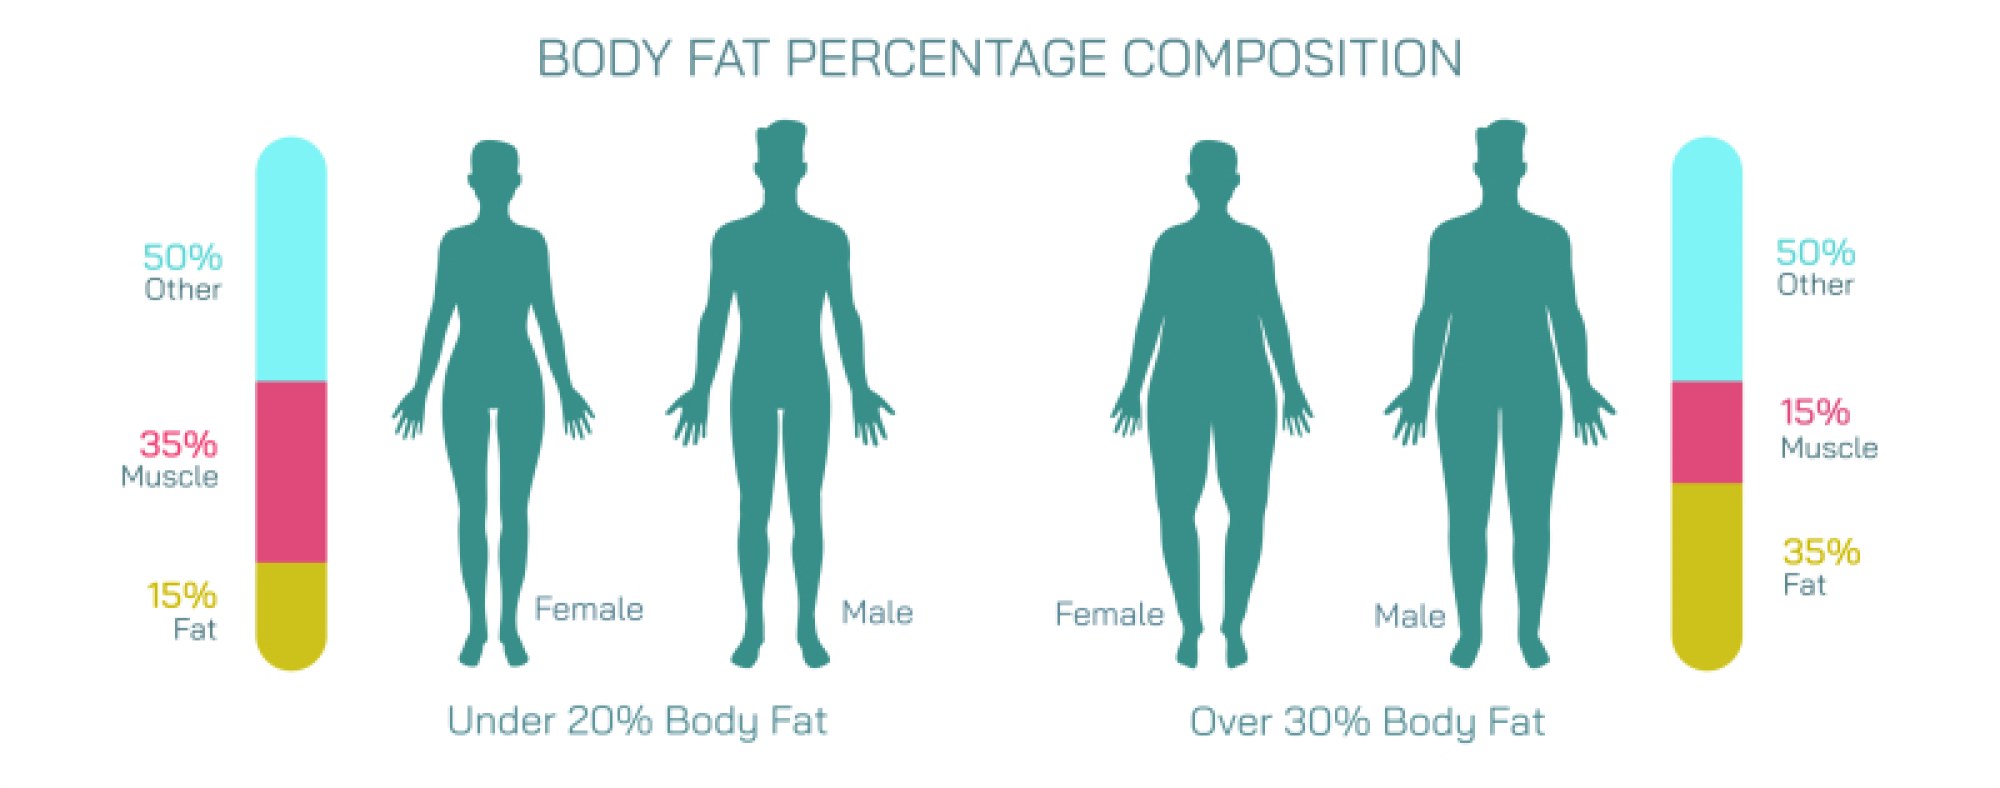
Body composition is one of the most influential determinants of how the human body looks, performs, and functions, and one of the clearest ways to understand it is by comparing body fat levels under 20% with those over 30%. Although most people think of body fat in visual terms—lean or overweight—the difference extends far deeper than appearance. Body fat percentage reflects the relationship between fat mass and lean mass, the latter consisting of muscle, bone, water, and organ tissues. When viewed through this lens, the contrast between bodies below 20% fat and those above 30% fat tells a biological story involving metabolism, hormones, nutrition, activity patterns, genetic tendencies, and long-term health risks. Visual diagrams comparing low and high fat percentages typically show major contrasts in muscle definition, distribution of fat deposits across the body, and the structural balance of tissues beneath the skin. These visible variations mirror internal shifts in physiology that shape energy regulation, functional strength, endurance, mobility, and metabolic resilience.
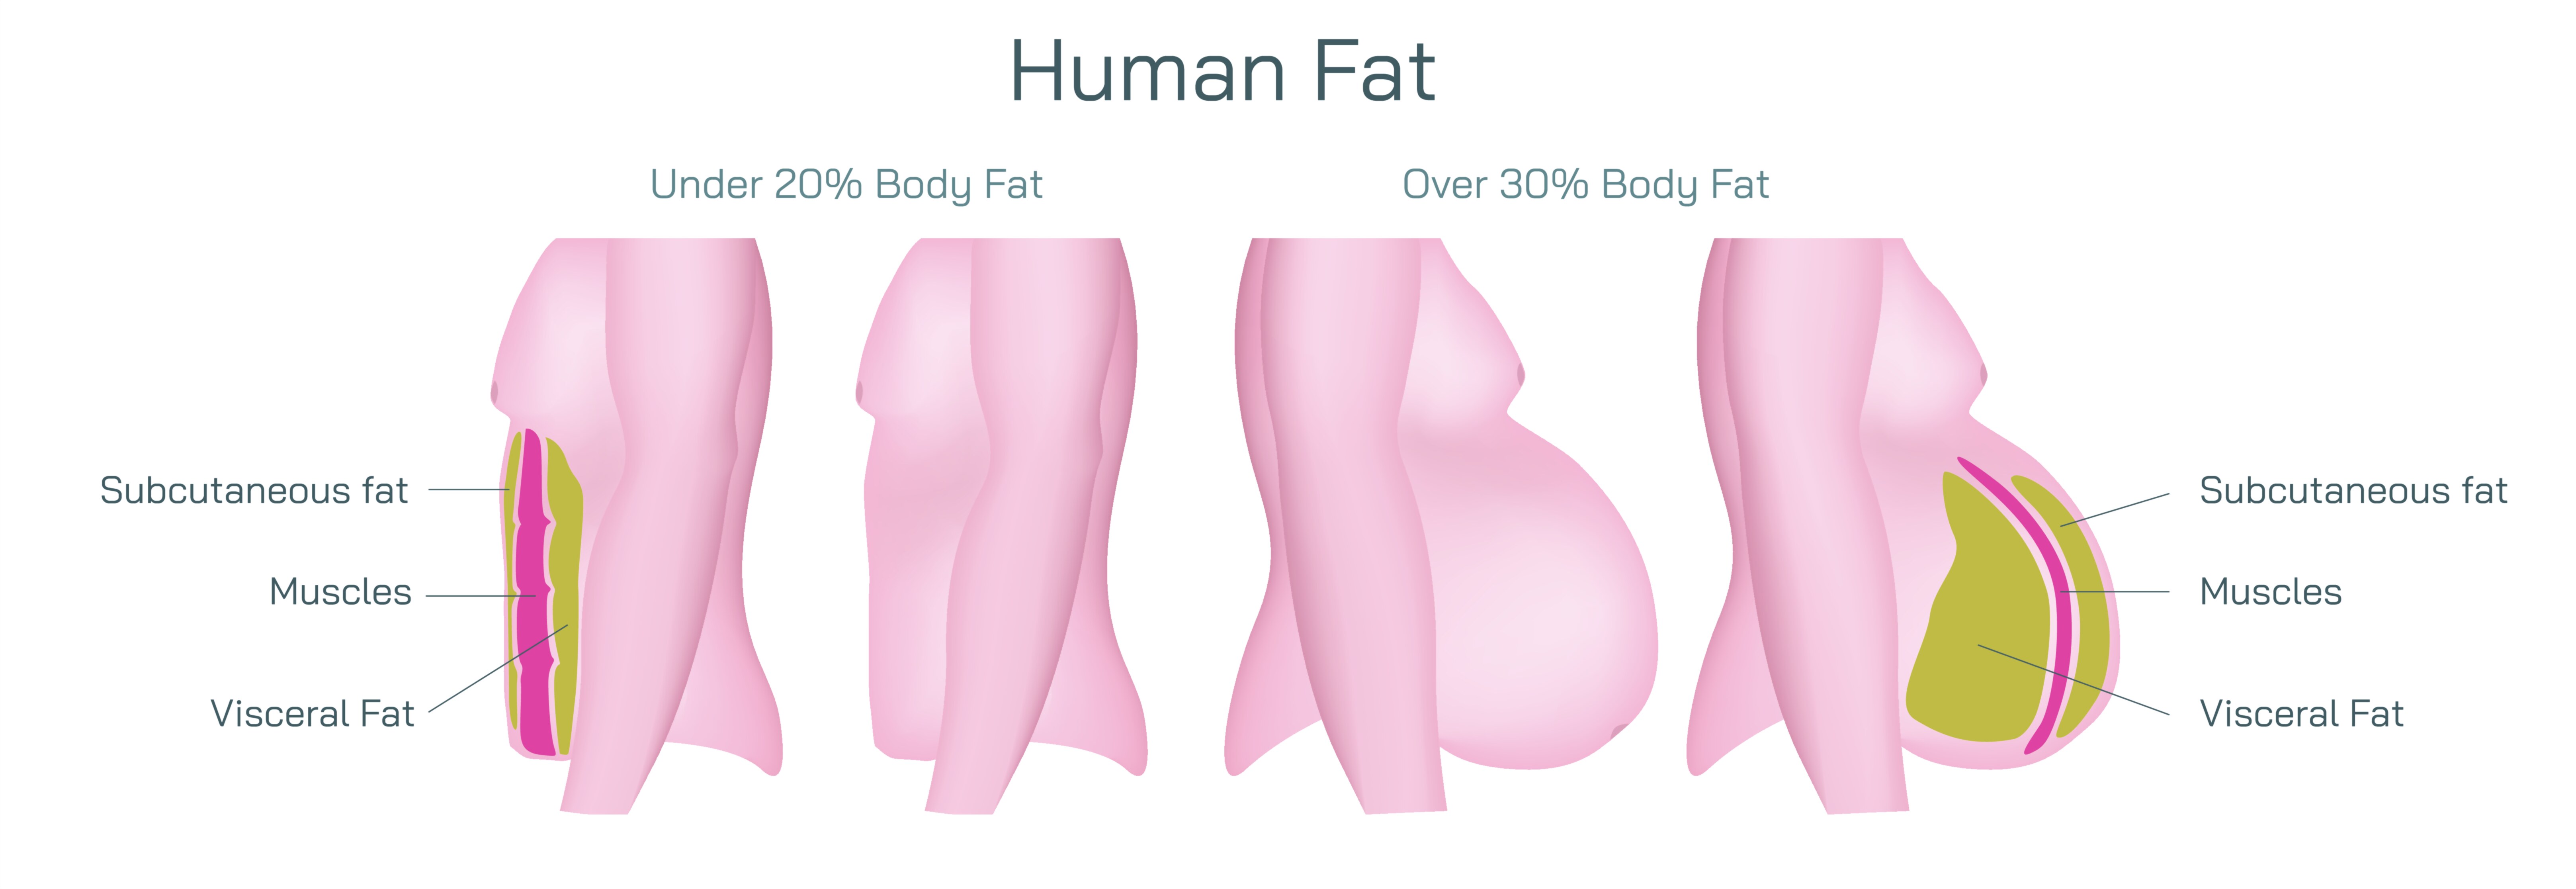
When the body fat percentage is under 20%, the physical appearance usually shows clear muscle definition because subcutaneous fat—fat stored just beneath the skin—is relatively thin. Without a thick fat layer covering the muscles, the natural contours of the body become visible: the shoulders appear more rounded and sculpted, the arms show distinct separation between deltoid, bicep, and tricep muscles, and the abdomen may reveal varying degrees of muscle segmentation depending on hydration, lighting, and individual anatomy. The thighs display defined quadriceps and hamstring lines, while the lower back and glutes take on a firm, supportive structure. In both men and women, a body fat level beneath 20% does not simply reflect a loss of fat; it reflects a higher ratio of lean muscle to fat. Because muscle is metabolically active tissue, individuals in this range generally experience greater calorie expenditure even at rest, more efficient glucose metabolism, better athletic performance, and improved physical endurance. The fat that remains at this level tends to be distributed in a balanced way, supporting natural energy reserves without obscuring muscular detail. Cellular activity in adipose tissue is stable, insulin signaling tends to be efficient, and inflammatory markers stay relatively low when lifestyle habits are supportive of overall health.
In contrast, when body fat exceeds 30%, the visual and physiological landscape shifts significantly. Muscle definition gradually fades as a thicker layer of subcutaneous fat overlays muscle groups, smoothing out contours that were once visible. The abdomen becomes one of the first areas where the difference becomes evident: the waistline widens, and the stomach projects outward or becomes softer to the touch due to the accumulated fat between the skin and abdominal muscles. Fat distribution patterns depend on biological sex and genetics, but common tendencies appear—women often accumulate more fat in the hips, thighs, and glutes, while men tend to store more fat in the abdominal and chest regions. Regardless of distribution pattern, the increase above 30% highlights a decrease in the proportion of lean mass relative to fat mass. Muscle tissue remains present but is less active and often less trained, while the adipose tissue compartment expands not only visually but also metabolically. Enlarged fat cells release more inflammatory molecules, insulin sensitivity decreases, and the body’s energy storage becomes more difficult to regulate. Although individuals in this range may still possess strong muscles beneath the surface, excess fat makes them less visible and can impair movement efficiency and joint health over time.
A striking difference between the two body compositions lies in fat distribution type, specifically the balance between subcutaneous fat and visceral fat. Under 20% body fat, visceral fat—the fat surrounding internal organs—is typically low, helping maintain a healthy waist circumference and stable metabolic function. When body fat exceeds 30%, visceral fat tends to increase, even when it is not externally obvious. This deeper fat wraps around organs in the abdominal cavity, affecting liver function, blood pressure, insulin regulation, and hormone signaling. Even in individuals who do not appear very large on the outside, visceral fat accumulation can significantly increase risk for metabolic conditions such as Type 2 diabetes, cardiovascular disease, non-alcoholic fatty liver disease, and chronic inflammation. For this reason, the difference in abdominal appearance between leaner and higher-fat bodies reflects not only subcutaneous fat thickness but also deeper biological layers that influence long-term health.
Muscle definition is another crucial point of contrast. With body fat below 20%, the density and tone of muscle become easy to observe, especially in weight-bearing and frequently used muscles such as the legs, back, shoulders, and abdominal region. This visibility typically indicates a physically active lifestyle that supports muscle growth and maintenance. Strength training, resistance exercise, and sufficient dietary protein help build and preserve muscle mass, contributing to a firm and sculpted appearance. Conversely, when body fat climbs above 30%, muscle is physically present but buried beneath insulating fat layers that soften or round out the silhouette. The absence of visible muscle definition does not automatically signal weakness—but it often reflects reduced muscle activation or training intensity. Reduced muscle mass relative to fat mass lowers metabolic rate, reduces physical performance capacity, and increases the likelihood of fatigue during daily tasks.
Functional mobility also shifts across the body fat spectrum. Individuals below 20% body fat with higher lean mass usually demonstrate greater agility, stamina, and postural control. Their joints bear less fat weight and benefit from the protective and stabilizing forces of well-developed muscle tissue. Over 30% body fat, joints—especially the knees, hips, and lower back—experience greater loading forces from both body weight and altered movement patterns. Fatigue may set in more quickly during aerobic activity, and posture may shift due to weakened core engagement and stored weight distribution.
Many internal biological processes evolve with body composition as well. Lower fat levels under 20% commonly correlate with balanced hormone regulation and efficient metabolic function, though extremely low body fat in either sex can eventually affect reproductive hormones, immunity, and thermoregulation. In contrast, excess fat above 30% can elevate circulating estrogen (even in men), increase inflammatory cytokines, and disrupt hunger and satiety hormones such as leptin and ghrelin. These shifts create feedback loops that encourage further fat storage and decreased energy expenditure.
Beyond appearance and metabolism, psychological and lifestyle differences often accompany these compositions. Maintaining body fat below 20% may require consistent exercise, mindful nutrition, stress management, and adequate sleep. Meanwhile, body fat above 30% often reflects or contributes to patterns such as high stress, insufficient sleep, sedentary routines, or excessive calorie intake relative to energy expenditure. These patterns are not simply behavioral choices but physiological responses involving appetite regulation, energy efficiency, and coping mechanisms.
When the contrast between 30% body fat is illustrated visually—showing the muscle definition of lean tissue versus the softened contours of bodies with higher fat mass—the images represent more than aesthetic difference. They serve as snapshots of deeper physiological realities. Low body fat reflects greater lean mass ratio, efficient metabolic function, and low inflammation when maintained in a healthy way. High body fat reflects greater energy storage relative to lean tissue, more stress on musculoskeletal and metabolic systems, and increased biological vulnerability when the imbalance persists over time.
Ultimately, body fat percentage is not simply a number—it is a mirror of internal balance. Under 20%, the body prioritizes muscle-driven shape, metabolic efficiency, and mobility. Over 30%, the body prioritizes energy storage, even when that storage becomes excessive. Both ranges exist on a continuum rather than as opposing categories, and individuals can move from one end to the other through gradual, sustainable adjustments in lifestyle, nutrition, training, and health habits. Understanding the contrast between muscle definition, fat distribution, and body composition across these two ranges offers not a judgment of body appearance but a clear biological narrative about how tissue balance shapes physical ability, long-term health, and the lived experience of occupying a human body.