Direct Current (DC) and Alternating Current (AC) Showing Electrical Flow, Symbols, and Waveform Difference
Direct Current (DC) and Alternating Current (AC) are the two foundational forms of electrical energy used in modern technology, and a clear visual comparison of their electrical flow, standard symbols, and waveform behavior provides an intuitive understanding of how each type functions in circuits. Although both carry electrons through conductive materials to deliver power, they do so in radically different ways that influence everything from circuit design and safety to energy transmission and device compatibility. A vector illustration that compares DC and AC side by side transforms these abstract concepts into a clearly readable visual map that highlights how the motion of electrons, the representation on electrical diagrams, and the waveform patterns of voltage make each current uniquely suited to specific applications.
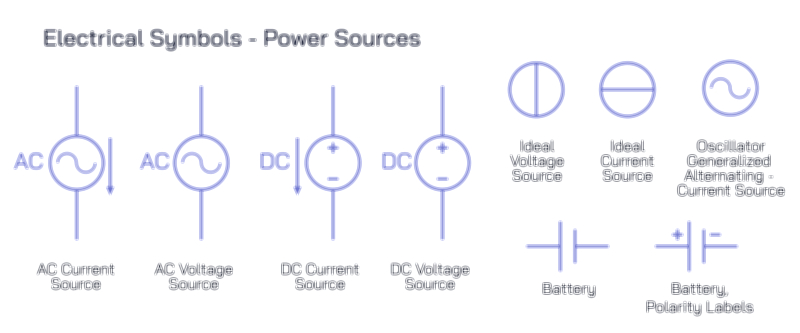
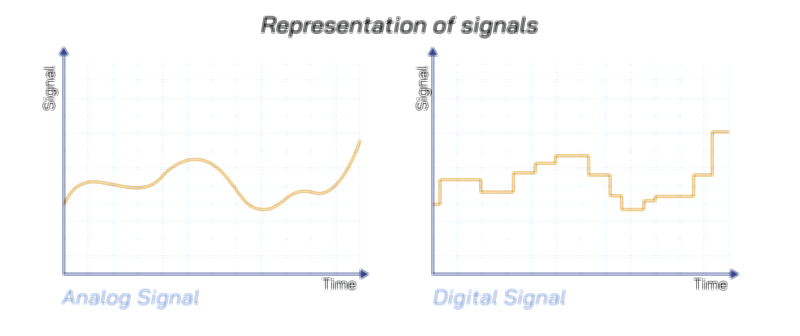
In Direct Current (DC), electrical charge flows steadily in one direction, from the negative terminal toward the positive terminal of a source. The magnitude of voltage remains constant over time, and the polarity never changes. This is visually represented by a straight horizontal line above a dashed line, symbolizing a stable voltage level with no oscillation. In a circuit diagram, DC power sources are commonly shown as battery symbols, represented by alternating long and short parallel lines that mark the positive and negative terminals. The unidirectional flow pattern makes DC ideal for electronics that require stable voltage — smartphones, computers, LED lighting, sensors, and microcontroller-based devices. A DC waveform shown on a graph appears as a steady, flat line, indicating that voltage does not fluctuate; it maintains a fixed level as long as the power supply is active.
In Alternating Current (AC), electrical charge reverses direction periodically, oscillating back and forth rather than traveling continuously one way. The voltage associated with AC rises and falls rhythmically, switching polarity many times per second. This alternating behavior is most clearly seen through its sinusoidal waveform, which resembles a smooth wave moving above and below a central axis. The electrical symbol for AC reflects this pattern: instead of straight lines, the AC indicator is a stylized sine wave, representing the repeating cycles of voltage reversal. Power plants generate AC naturally through rotating electromagnetic induction, making it the ideal form for long-distance electricity transmission. Because AC voltage can be raised or lowered easily with transformers, it dominates domestic and industrial power grids all over the world.
A direct comparison of DC and AC waveforms reveals their essential differences at a glance. On a time-voltage graph, DC is drawn as a straight, constant line, showing an uninterrupted and unchanging magnitude. AC appears as a repeating sinusoidal curve, rising to a positive peak, descending through zero, dropping to a negative peak, and returning again. AC’s repeating frequency — typically 50 Hz in many countries and 60 Hz in others — describes how many times per second the waveform completes a full oscillation. A visual overlay of the two helps learners immediately see why components in one system may behave differently in the other.
A comparison of electrical flow direction further clarifies the internal physics. In DC, electrons drift continuously in a single direction along the conductor. In AC, electrons oscillate back and forth, reversing direction with each cycle. Although electrons in an AC system do not travel forward steadily like in DC, they still carry energy effectively due to the repeated alternation of voltage. This difference matters when designing circuits: polarity-sensitive devices such as diodes, capacitors, and LED lighting must be wired according to DC orientation, while AC-powered devices must be able to handle constant polarity reversal. Motors, heating coils, and household appliances are typically engineered to operate efficiently from AC because the alternating field can drive mechanical rotation and generate heat evenly.
A well-organized educational illustration often places symbols, flow types, and waveforms in parallel rows — DC on one side, AC on the other — to make the comparison immediately interpretable. Under the DC column, the straight-line waveform, the battery or straight voltage symbol, and the one-directional electron flow arrow emphasize stability and fixed polarity. Under the AC column, the sine-wave symbol, alternating bidirectional flow arrows, and cyclical waveform reflect dynamic polarity reversal and oscillation.
These visual and conceptual distinctions explain why both types of current are essential rather than competitive. DC powers low-voltage electronics that require constant voltage stability and safe energy storage. AC powers the electrical grid and high-load devices where efficient long-distance transmission and transformer-based voltage control are essential. Each form plays a complementary role in daily life, and the transition between them is constant — phone chargers convert AC to DC for electronics, while renewable energy systems often convert DC from solar panels into AC for distribution.
A full vector illustration comparing DC and AC therefore does much more than show symbols and waveforms; it allows learners to understand why the electricity in a wall outlet behaves differently from the electricity in a battery, why household appliances plug into AC while portable devices run on DC, and why every modern power system relies on seamless conversion between the two. By making the differences in flow behavior, waveform appearance, polarity orientation, and circuit symbolization visually transparent, such an illustration becomes a powerful tool for students, engineers, electricians, and anyone trying to understand the fundamentals of electrical power.