Analog and Digital Graph — Signal Representation and Comparison
Understanding the Fundamental Nature of Analog and Digital Signals
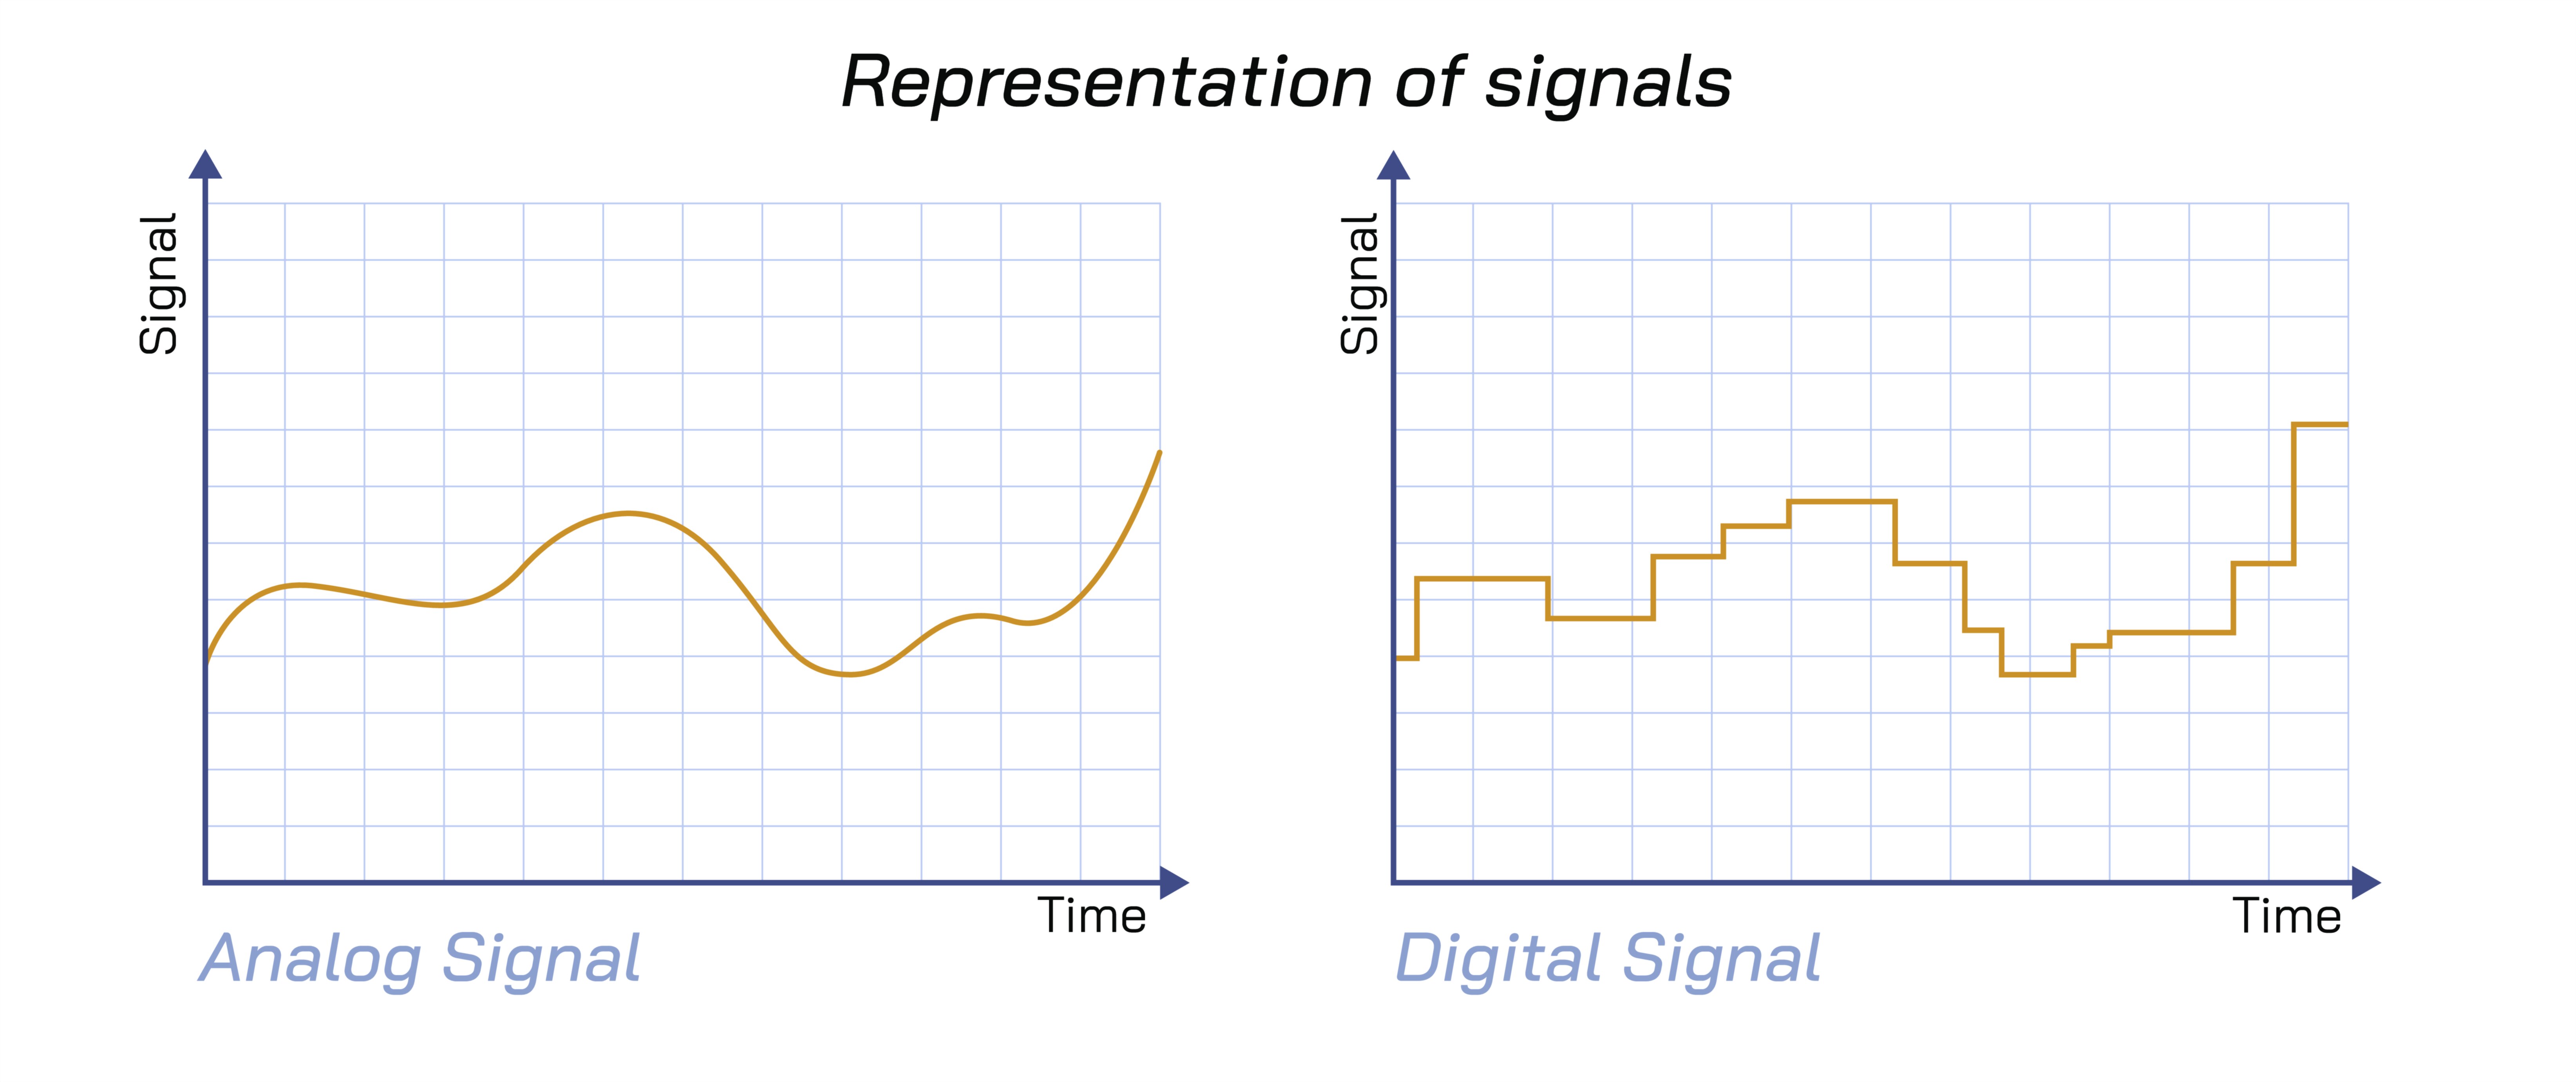
Analog and digital signals represent two distinct but equally important methods of conveying information across electronic systems, communication channels, and processing devices. An analog signal is continuous in both time and amplitude, meaning it flows smoothly without discrete steps and can take on any value within a given range. In contrast, a digital signal is discrete, existing only at specific intervals and assuming a limited set of amplitude values, typically represented as binary 0s and 1s. These differences in structure affect how signals are transmitted, processed, stored, and interpreted. A vector illustration comparing analog and digital graphs typically places a smooth sine wave representing analog signals beside a staircase-like or square waveform representing digital signals. This side-by-side visualization helps reveal the contrast between continuous variation and discrete quantization, showing how each format carries information under different constraints and requirements.
Analog Signals — Continuous Variation and Natural Representation
Analog signals mirror real-world physical phenomena because they vary smoothly and continuously, much like sound waves, temperature changes, or light intensity. Their continuity allows them to capture subtle variations without losing detail, making them ideal for applications where precision and natural representation are essential. For example, analog audio recordings preserve the entire waveform of a sound, capturing every nuance of tone, pitch, and harmonics. Similarly, analog sensors detect physical changes as continuous voltage or current levels, providing rich, detailed output. However, analog signals are inherently susceptible to noise, distortion, and interference during transmission or storage. Because every small disturbance alters the waveform, maintaining signal integrity over long distances or multiple processing stages becomes challenging. A vector illustration often depicts analog signals as smooth oscillating curves, emphasizing their flowing, uninterrupted nature. This visual reinforces the concept that analog signals express information with infinite possible values, making them realistic but harder to preserve with absolute accuracy.
Digital Signals — Discrete, Robust, and Machine-Friendly
Digital signals encode information into discrete steps, most often using binary digits that switch between two fixed levels. This quantized format makes digital signals extremely resilient against noise because small fluctuations or interference do not change the underlying binary information unless they cross specific thresholds. Digital representation also enables error detection and correction, allowing systems to identify and fix corrupted data during transmission. This reliability makes digital systems the cornerstone of modern computing, telecommunications, and multimedia processing. Although digital signals may lose some microscopic details during conversion from analog data, their robustness and compatibility with digital circuits make them ideal for long-distance communication, data storage, and computational tasks. A vector illustration typically shows digital signals as rigid steps or rectangular pulses, demonstrating how the waveform jumps between discrete values rather than flowing continuously. This visual distinction helps learners grasp the advantages of precision, repeatability, and noise immunity inherent in digital formats.
Conversion Between Analog and Digital Domains
Many modern systems require seamless interaction between analog and digital signals. This interplay is achieved using analog-to-digital converters (ADCs) and digital-to-analog converters (DACs). An ADC samples the continuous analog signal at fixed time intervals and quantizes the amplitude into discrete levels, transforming the waveform into digital data. The accuracy of this conversion depends on the sampling rate and bit depth: higher sampling rates capture more detail over time, while larger bit depths express amplitude with greater precision. DACs perform the reverse process, reconstructing a smooth analog signal from its digital representation. These conversions make it possible for devices like smartphones, audio players, medical instruments, and communication systems to process analog information within digital frameworks. In vector illustrations, this process is often shown by overlaying sampled points on an analog waveform, followed by a step-like digital graph that approximates the continuous curve. This visual highlights how digitization captures the essential features of the analog wave while translating it into machine-readable form.
Noise, Interference, and Signal Integrity in Both Formats
Noise—unwanted variations or disturbances—affects analog and digital signals differently. In analog signals, noise directly distorts the original waveform, reducing clarity and fidelity. Even minor interference can degrade audio quality, blur analog video, or corrupt sensitive sensor readings. As analog signals propagate, cumulative noise becomes increasingly difficult to remove. Digital signals, however, remain largely immune to subtle disturbances because only drastic changes that push the signal beyond threshold levels affect binary data. Error-correcting codes, synchronization pulses, and redundancy mechanisms further strengthen digital signals against corruption. Despite their resilience, digital systems can fail abruptly if noise becomes severe enough, whereas analog signals degrade gradually. A vector illustration comparing noise effects might show a smooth analog wave becoming slightly jagged, while a digital square wave maintains its shape except in extreme noise conditions. This comparison visually conveys why digital communication is preferred for reliability, even though analog signals often retain superior richness and natural expression.
Applications of Analog and Digital Signals in Modern Technology
Analog and digital signals coexist in nearly every technological system. Microphones, thermometers, and radio waves begin as analog variations that reflect real-world behavior. Digital processors, computers, and storage devices then convert these analog inputs into digital data for computation, editing, or transmission. Audio systems, medical equipment, industrial controls, and instrumentation rely heavily on mixed-signal designs that incorporate both domains. Digital communication networks—from Wi-Fi to 5G—encode information digitally but transmit it over analog electromagnetic waves. Even consumer electronics such as televisions, smartphones, and sensors operate using constant translation between analog and digital forms. Understanding both types of signals and their graphs allows designers, engineers, and students to appreciate how modern systems interpret, manipulate, and preserve information across physical and computational environments.
Illustrating Analog and Digital Signals Through Vector Graphics
A vector illustration comparing analog and digital graphs usually features clear, smooth sine waves representing continuous analog behavior alongside staircase or pulse-shaped waveforms illustrating digital steps. Additional elements may include sampling markers, quantization levels, amplitude labels, or time grids to highlight the distinctions between continuous and discrete representation. These graphical comparisons simplify complex concepts, helping viewers intuitively understand how analog and digital signals differ in form, function, and behavior. By visualizing these principles, learners gain deeper insight into why both signal types remain essential in today’s communication, computation, and sensory technologies.