Radioactive Decay Vector Illustration for Modern Physics and Science Education
Radioactive decay is one of the most compelling demonstrations of how nature manages instability at the atomic level, and a modern physics and science education vector illustration of this concept serves as a bridge between invisible nuclear processes and human understanding. Although decay occurs inside the nucleus where it cannot be directly seen, a detailed vector illustration allows educators and learners to visualize atomic instability, the transformation of one element into another, and the release of energy that accompanies these transitions. For a student encountering nuclear science for the first time, the phenomenon becomes far more intuitive when represented through clear and engaging graphics rather than abstract descriptions. Through soft gradients, particle arrows, directional flows, nucleus diagrams, and color-coded isotopes, a vector illustration can make the atomic world feel real and alive rather than imaginary or intimidating.
Understanding Instability and Transformation in the Atomic Nucleus
Every atom contains a nucleus made of protons and neutrons, and in stable isotopes, these particles exist in a balanced configuration. In radioactive isotopes, that stability is disrupted. There may be too many neutrons for the number of protons, too much energy stored inside the nucleus, or an arrangement of internal forces that creates tension rather than balance. A vector illustration captures this tension through visual cues: a nucleus drawn with uneven particle distribution, glowing outlines that imply stored energy, or layered shapes that highlight internal imbalance. When decay occurs, the illustration shows the release of a particle or burst of energy, symbolizing the nucleus shifting to a more stable identity. The learner sees decay not as destruction or disappearance but as a step toward stability, like a process of nature correcting internal imbalance.
A Visual Story of Alpha, Beta, and Gamma Decay
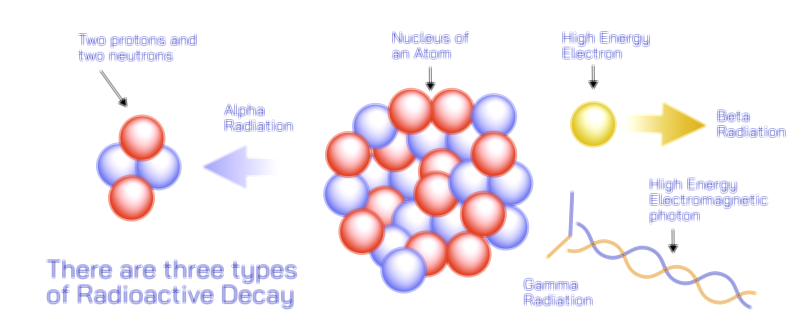
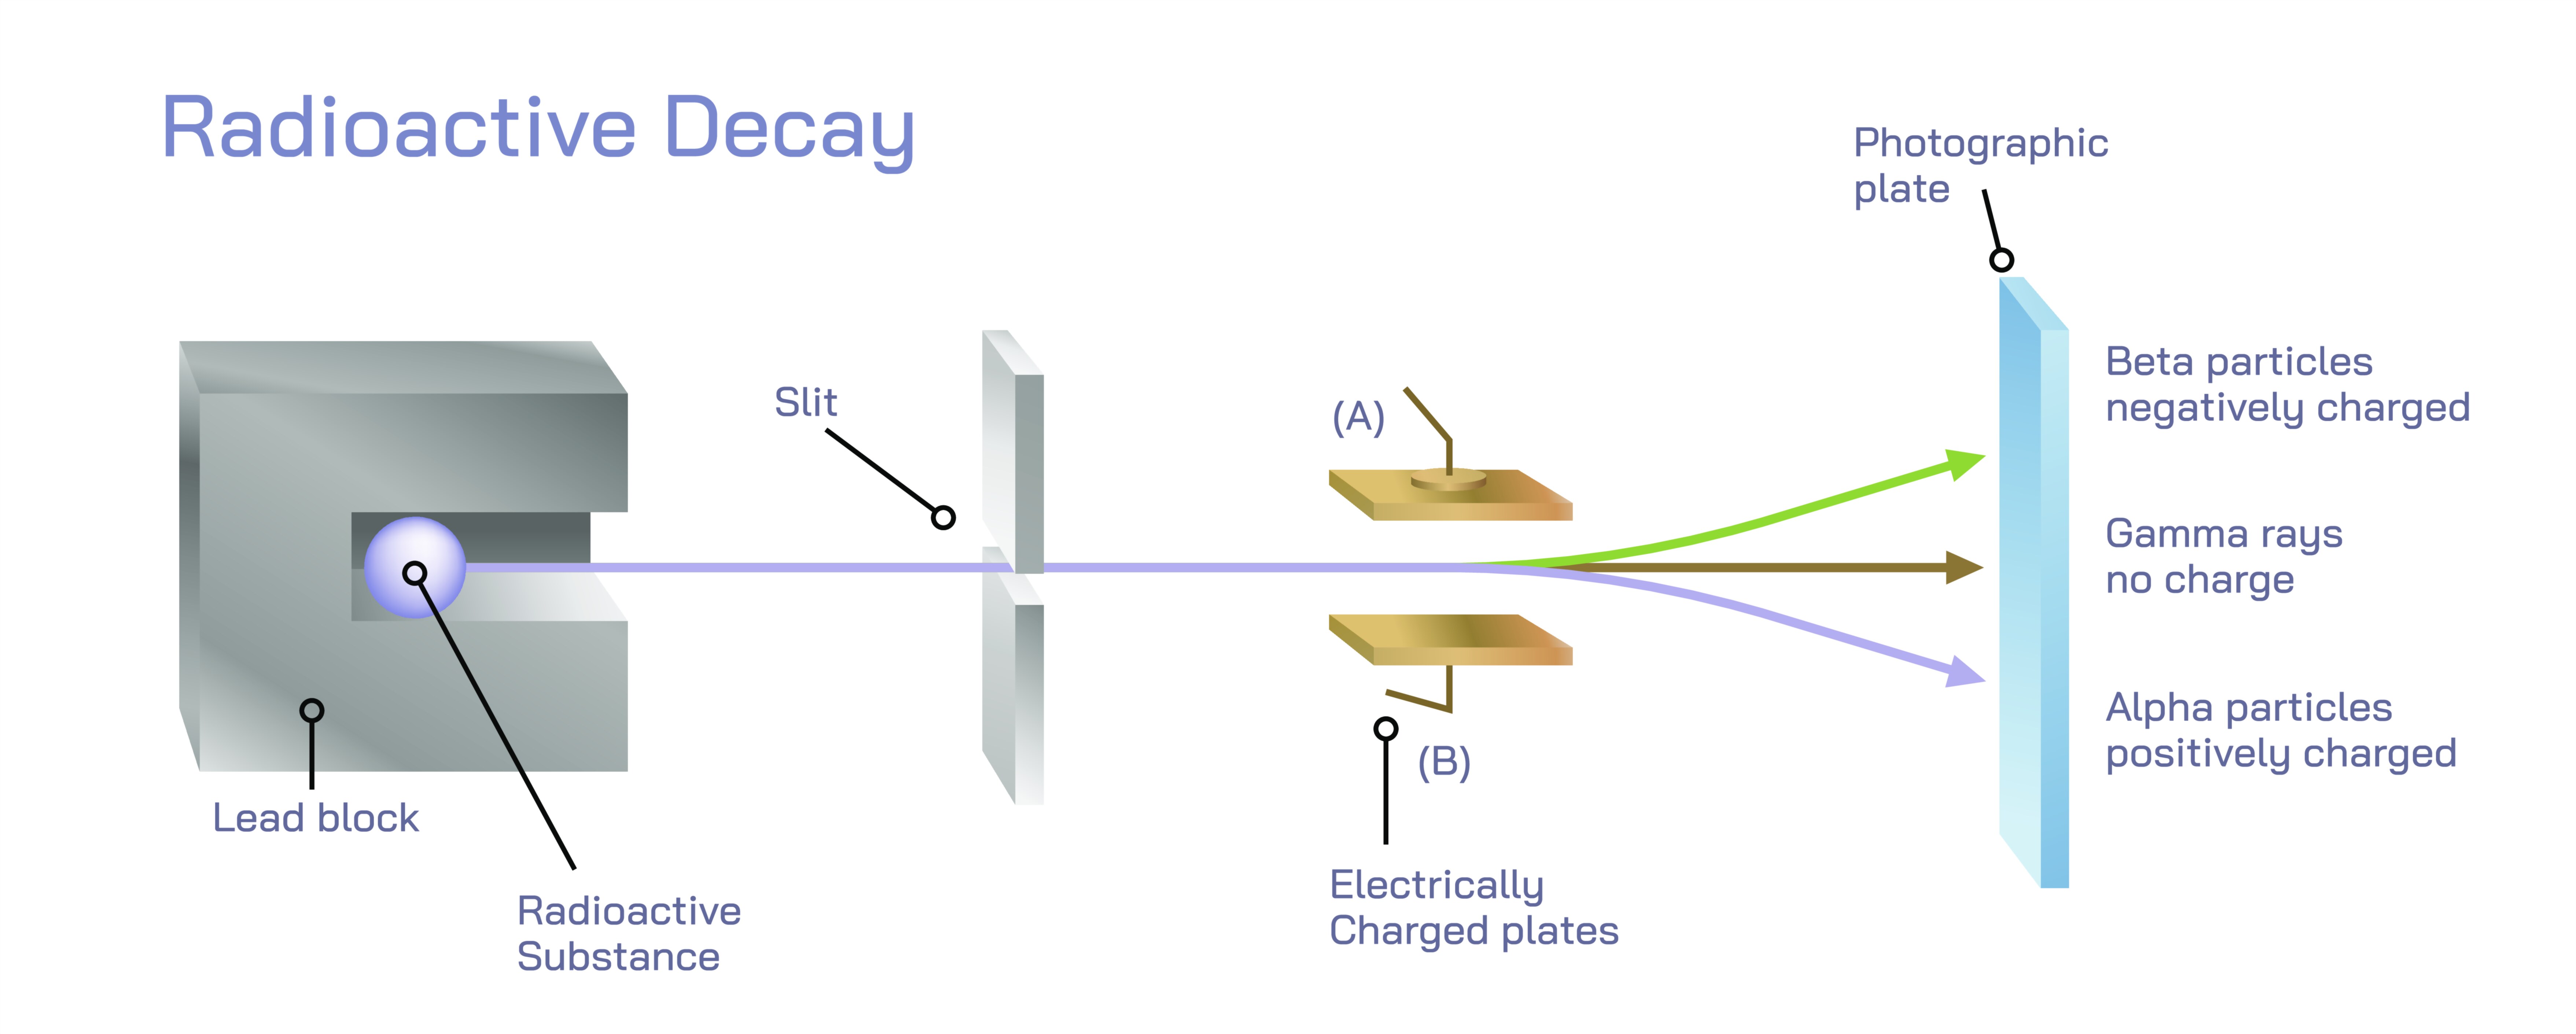
One of the strengths of a vector diagram is its ability to differentiate types of radioactive decay clearly without overwhelming the viewer. If alpha decay is illustrated, the nucleus can be shown expelling a compact cluster of two protons and two neutrons. The image communicates how the remaining nucleus changes into a different element, a transformation that helps students understand that isotopes do not simply break down — they transmute. For beta decay, the illustration reveals how a neutron, symbolically split through the graphic, becomes a proton while an electron is released. Even without mathematics, a student grasps the sense of internal rearrangement. In gamma decay, the nucleus maintains the same number of neutrons and protons, but radiant waves like shimmering lines or pulsing rings depict the release of stored nuclear energy. A learner understands immediately that this is not a change into a new element but a shift into a lower-energy state. By presenting these modes visually, the diagram helps students internalize the idea that decay is diverse in mechanism but unified in purpose: the nucleus seeks stability.
The Role of Time and Probability in Nuclear Decay
One of the most powerful contributions of a vector illustration is the ability to represent radioactive decay as a probabilistic rather than predictable event. A nucleus does not decay on command, yet groups of identical nuclei follow measurable timing patterns. A well-designed graphic demonstrates this by showcasing the idea of half-life: instead of depicting decay as instantaneous destruction, the illustration shows a population of atoms reducing gradually over time while half remain intact. This concept can be visualized through fading arrays of nuclei, diminishing color intensity, or a progressive timeline showing how the quantity decreases at regular intervals. Students who once believed decay to be unpredictable chaos realize that radioactive decay has structure and pattern at the scale of large numbers. They begin to understand why radiometric dating can trace the age of rocks, fossils, or archaeological artifacts with such reliability and why nuclear energy systems rely on predictable decay rates for constant power output.
Decay Chains and the Evolution of Elements
Another strength of a vector-based approach is the ability to map decay chains visually. Many isotopes do not achieve stability in a single transformation but pass through a sequence of decays that eventually lead to a stable element. A learner who sees a chain represented as linked nuclei — each with its own symbol, particle emission, and position on the periodic identity sequence — gains an intuitive understanding of how heavier elements transform over time. With each step illustrated, the viewer understands that the radioactive element is not disappearing but evolving. It is moving toward a final, balanced atomic form. In this way, an illustration communicates the idea that nature constantly moves matter toward stability and that the diversity of the elements we see today is the result of millions of years of nuclear transitions.
Energy Release and Its Meaning in the Natural and Technological World
A radioactive decay illustration not only depicts particles and isotopes but also carries the symbolic representation of energy. Students often wonder where nuclear energy comes from, and a diagram showing glowing pulses from the nucleus, outward wave propagation, or particle motion helps visualize the immense energy stored within nuclear bonds. With this understanding, learners can connect decay to real-world applications. They understand why geothermal energy originates from radioactive isotopes deep inside the Earth, why radioisotopes power deep-space exploration vessels, and why carefully selected isotopes are used in medical imaging and cancer therapy. The learner also sees why safety is necessary — not because decay is unnatural, but because the release of nuclear energy interacts strongly with matter. When represented visually rather than through warning symbols alone, the power of radioactive decay becomes intellectually engaging, not terrifying.
Educational Empowerment Through Visual Science
The greatest benefit of a radioactive decay vector illustration is not aesthetic; it is cognitive. Students who struggle to visualize the microscopic world of nuclei find clarity when the invisible becomes a series of understandable shapes and transitions. Teaching nuclear science without supportive visuals leaves many learners with an abstract sense of the topic, but visualizing decay turns the atom into a dynamic, evolving environment. It helps learners see that the universe is not frozen but constantly rewriting itself through transformation. When a student experiences this realization, nuclear physics becomes less an intimidating discipline and more a doorway to curiosity. A vector illustration of radioactive decay becomes a teaching tool that encourages further exploration into quantum mechanics, nuclear chemistry, astrophysics, environmental science, and medical technology.
In the end, radioactive decay is not merely a scientific topic but a story of natural stability, energy, and time. A radioactive decay vector illustration for modern physics and science education makes this story accessible to everyone — not just experts. Through shapes, color transitions, particle paths, and visual signals of instability and stabilization, the concept becomes approachable, memorable, and meaningful. A learner who studies the illustration does not simply memorize definitions; they understand that the nucleus is a living structure undergoing change and that the universe continuously reshapes matter through these hidden but powerful processes. Above all, the illustration communicates a timeless scientific truth: every element, every atom, and every particle is part of an ongoing journey toward balance, and radioactive decay is the quiet, natural pathway through which the universe reaches that harmony.