Probability of Coin Flipping – Outcome Patterns, Randomness, Predictability Through Statistics, and Real-World Meaning of Heads-and-Tails Events
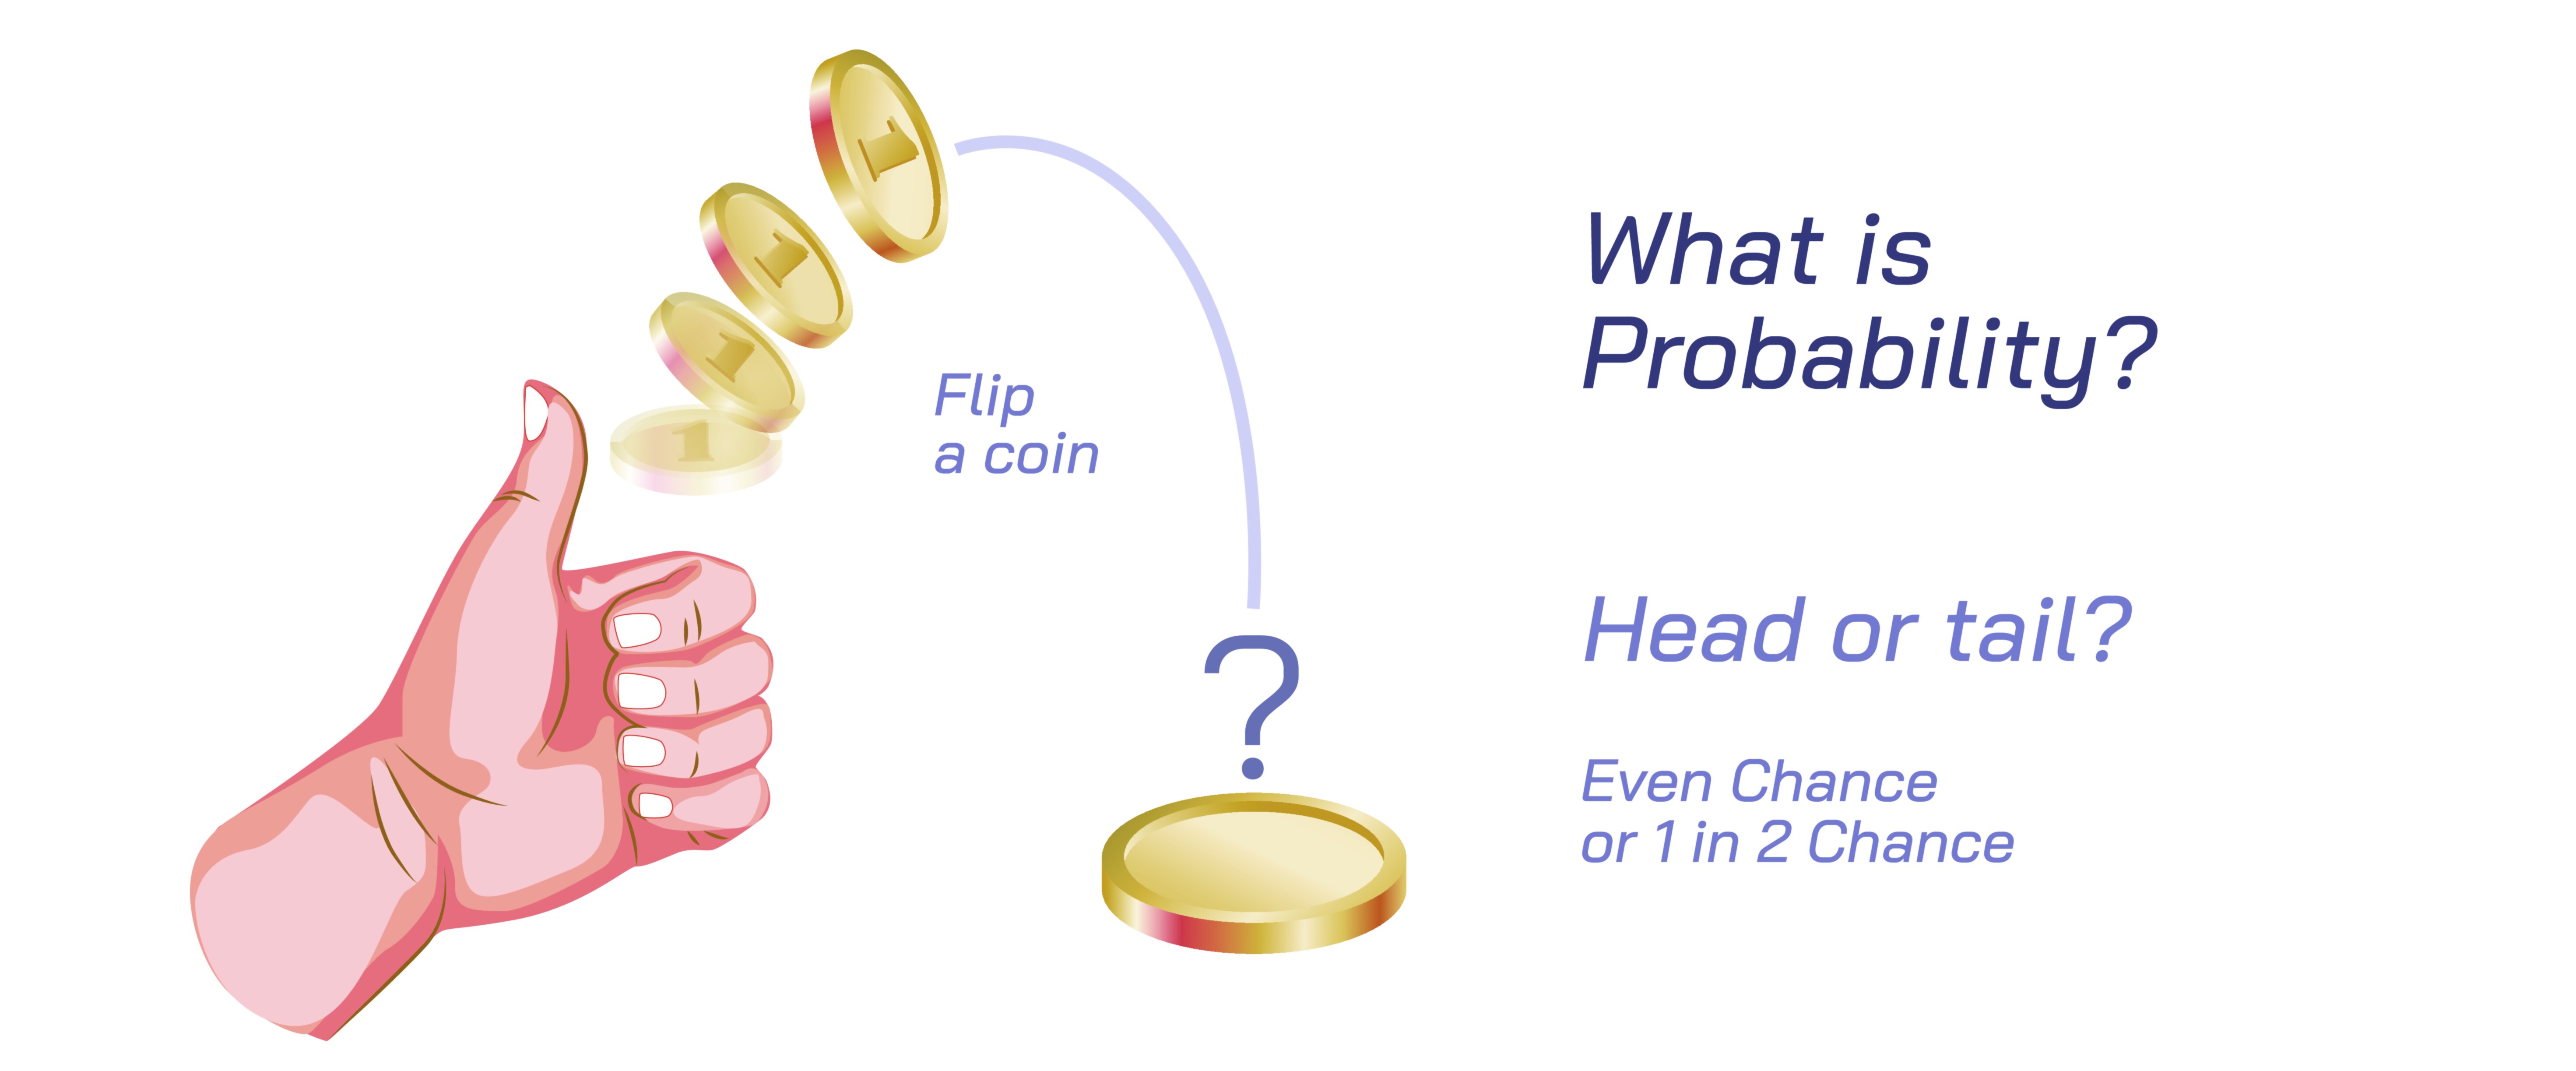
Coin flipping is one of the simplest and most widely recognized examples of probability in action, yet beneath its simplicity lies a deep structure that explains how randomness behaves, how outcomes can be predicted statistically, and how uncertainty follows measurable patterns rather than chaos. When a fair coin is flipped, there are only two possible outcomes — heads or tails — and each outcome is equally likely. This equal likelihood means that the uncertainty in each flip is complete: before the coin lands, no one can know which side will show. But when many flips are observed together, the outcomes follow highly consistent, repeatable patterns over the long run. This combination of unpredictability in the short term and stability in the long term makes the probability of a coin flip a perfect model for understanding chance and randomness in real life.
2. These probabilities remain constant no matter how many times the coin has been tossed previously. Even if a coin has landed on heads five times in a row, the probability of heads on the next flip remains exactly the same. The coin has no memory and no built-in tendency to correct patterns. This is one of the strongest lessons the coin-flip model teaches: probability does not promise that short-term results will mimic long-term expectations, and randomness naturally produces streaks and clustering. A run of many heads or many tails is not a sign of imbalance or cheating; it is a natural expression of real random variability.
Although each flip is independent and unpredictable, patterns emerge when many flips are examined together. If someone flips a coin twice, four possible outcome sequences exist: HH, HT, TH, and TT. In these two flips, results can vary greatly — sometimes people will get two heads, sometimes two tails, sometimes one of each. In such a small number of flips, randomness is pronounced and unpredictable. But as the number of flips increases, the proportion of heads and tails begins to approach equality. If a coin is flipped ten times, it might land on heads six times and tails four times, or seven times versus three times, or even nine to one. But if the coin is flipped one hundred times, most of the time the number of heads will fall somewhere near fifty. And if it is flipped one thousand times, it will almost always land very close to five hundred heads and five hundred tails. This steady stabilization reveals a central idea of probability: although individual events are uncertain, the average behavior across many events becomes predictable.
This long-term pattern is a demonstration of the law of large numbers. It explains why casinos profit consistently over time, why insurance companies can accurately predict risk even though individuals are unpredictable, and why weather forecasts rely not on exact certainty but on long-term probability analysis. A coin flip is an ideal model of fairness and randomness because both outcomes are symmetric and evenly balanced. With repeated trials, randomness organizes itself into a measurable proportion, revealing that probability describes what happens on average rather than what happens at any single moment.
Another important idea connected to coin flipping is how combinations of outcomes behave when probabilities are multiplied. For a single flip, two outcomes are possible. For two flips, four outcome sequences exist. For three flips, eight different sequences exist. As the number of flips increases, the possible outcome sequences expand exponentially. Yet despite this explosion in possible patterns, the likelihood of each complete sequence is still predictable: each sequence has the same chance of occurring. For example, the chance of getting HHH in three flips is the same as the chance of getting HTT or THH. However, if we look not at individual sequences but at total counts of heads and tails, the picture changes. There are more ways to obtain two heads and one tail than there are to obtain three heads or three tails. This is why two-heads-one-tail appears more often than three-heads-zero-tails when many experiments are repeated. Even at the level of simple coin flipping, probability teaches that some count outcomes are more common than others not because they are more likely individually but because more patterns lead to them.
Coin flipping also helps illustrate the difference between intuitive expectation and true probabilistic behavior. Many people assume that randomness should look like rapid alternation — heads, tails, heads, tails — but real randomness frequently produces streaks, repetition, and irregular clustering. A long run of the same outcome is not unusual; it is part of what randomness naturally generates. If a coin flipped ten times shows heads eight times, people may think something unusual has happened, but in reality such results are statistically ordinary. The human mind tends to search for patterns and often misinterprets randomness as intention or imbalance. The probability of coin flipping trains us to separate emotional intuition from mathematical truth: unpredictability in the short term does not contradict predictable balance in the long term.
Real-world decision making and risk management borrow ideas directly from simple coin-flip probability. In genetics, a 50 percent chance of inheriting a trait follows the same logic as heads or tails; any one pregnancy is unpredictable, but patterns across populations stabilize. In business, investment risk is analyzed the same way — single events vary wildly, but large collections of events follow stable distributions. In digital communication, random noise in a transmission is modeled as a sequence of coin-flip errors, and error-correcting codes are designed using probability principles rooted in independent binary outcomes. Machine learning, cryptography, reliability testing, actuarial science, and computer simulation all build probability models using the same structure as coin flipping: independent trials, each with established probabilities, accumulating into predictable distribution patterns over time.
The elegance of coin-flip probability lies not in the coin itself but in what the concept symbolizes. It demonstrates that randomness is not disorder but structure that cannot be seen until enough events accumulate. It teaches that true probability is not a claim about what will happen next but about what happens on average when uncertainty is observed again and again. It also reminds us that fairness, symmetry, and independence define how a random system behaves. Even though a single flip tells us nothing about the next flip, a hundred flips tell us much about the next hundred. And those insights extend to every field that deals with risk, variation, forecasting, data, and decision-making.
Ultimately, the probability of coin flipping describes a deeper truth about chance: uncertainty at the individual level becomes predictability at the collective level. Whether analyzing the fairness of a game, the success rate of a treatment, the reliability of a machine, the volatility of a stock, or the spread of outcomes in a large dataset, coin-flip logic provides the foundation. From a small spinning disc of metal tossed into the air, we learn how nature distributes outcomes, how patterns emerge from chaos, and how probability helps illuminate the balance between randomness and order that shapes everything around us.