ØÉīØÉÜØÉŻØÉ©Øɽ ØÉÅØɽØÉ©ØÉøØÉÜØÉøØÉóØÉźØÉóØÉŁØÉ▓ ØÉāØÉóØɼØÉŁØɽØÉóØÉøØÉ«ØÉŁØÉóØÉ©Øɦ ØÉōØÉ▓ØÉ®ØÉ×Øɼ ŌĆö ØÉāØÉ×ØÉ×ØÉ® ØÉäØÉØØÉ«ØÉ£ØÉÜØÉŁØÉóØÉ©ØɦØÉÜØÉź ØÉÆØÉŁØÉÜØÉŁØÉóØɼØÉŁØÉóØÉ£Øɼ ØÉéØÉ©ØɦØÉ£ØÉ×ØÉ®ØÉŁ.
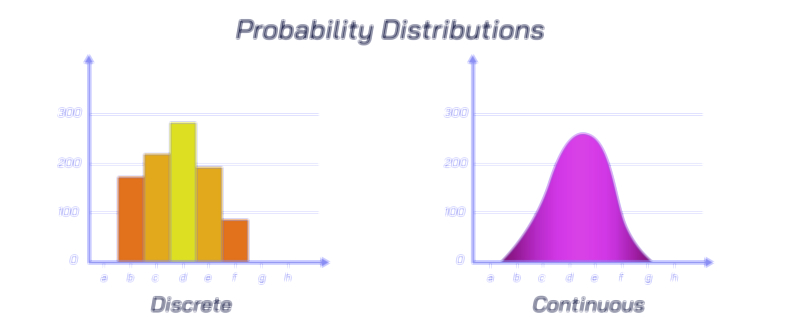
In statistics, probability distributions form the foundation for understanding how random variables behave, and the major distribution types represent recurring patterns through which uncertainty appears in nature, science, and human activity. Instead of treating randomness as a chaotic or unpredictable force, probability distributions group uncertainty into recognizable shapes that describe which outcomes are common, which are rare, and how likely events are to occur under varying circumstances. The major types of probability distributions each reflect different types of real-world processes: some describe the probability of counts, some describe time intervals, some describe measurement variability, and others describe binary outcomes or extreme events. Even though random variables vary endlessly across disciplines, their behaviour tends to follow a limited number of common probability distribution types, proving that randomness itself is patterned and mathematically predictable. Learning about the major types of probability distributions therefore provides insight into how uncertainty operates across data science, psychology, economics, engineering, meteorology, epidemiology, and countless fields that rely on statistical analysis for decision-making.
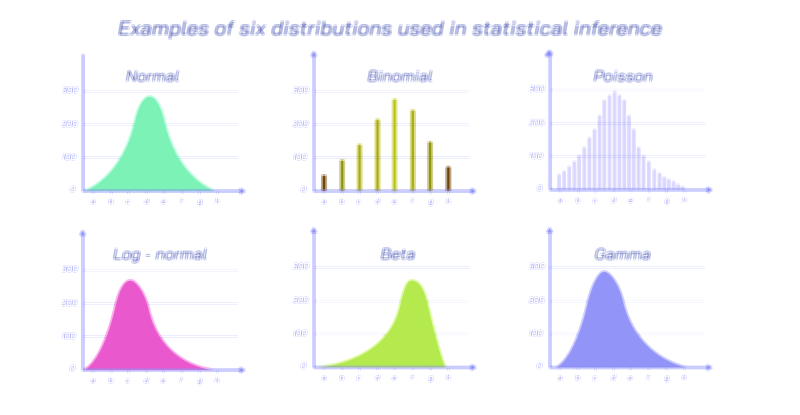
One of the most important and universal probability distributions is the normal distribution, often called the bell curve because of its smooth, symmetric shape. It describes situations in which many small, independent factors combine to determine an outcomeŌĆösuch as height, IQ scores, human performance, random measurement error, manufacturing precision, and natural biological traits. Most values cluster around the average, while extremely high or extremely low values become increasingly rare. The normal distribution plays a central role in inferential statistics because many hypothesis tests, confidence intervals, and sampling theories rely on its structure. It is not just a mathematical convenience; it reflects the way nature balances variability. Whenever different influences push and pull an outcome in small, independent ways, the result tends to follow a normal distribution. Because of this, the normal distribution becomes a benchmark against which deviations, skewness, and anomalies are measured.
Another major distribution type is the binomial distribution, which applies to random situations involving repeated trials with two possible outcomesŌĆötypically termed ŌĆ£successŌĆØ and ŌĆ£failure.ŌĆØ It describes processes such as the number of patients who recover after receiving a treatment, the number of manufactured items that pass inspection, the number of voters supporting a candidate out of a sample, or the number of goals scored by an athlete in a fixed number of attempts. The binomial distribution captures three essential aspects of binary outcomes: the number of trials, the probability of success, and how these combine to affect the likelihood of different result counts. This makes the binomial distribution indispensable in quality control, clinical trials, marketing analysis, and survey sampling. Through the binomial distribution, uncertainty becomes measurable because one can determine not only how likely success is on a single trial, but also how likely it is to observe a specific number of successes across many trials.
A closely related but fundamentally different distribution is the Poisson distribution, which describes the probability of counting random events over a fixed interval of time, space, or opportunity rather than over a fixed number of trials. Instead of asking how many successes occur in a fixed number of attempts, the Poisson distribution asks how many events occur in a given duration or areaŌĆöfor example, the number of phone calls received by a call centre in one hour, the number of cars arriving at a tollbooth per minute, the number of errors in a printed book, or the number of earthquakes above a certain magnitude in a year. The Poisson distribution captures randomness that occurs independently and at a steady average rate. It is vital in operations management, traffic engineering, insurance, epidemiology, and network system analysis. The Poisson distribution also leads to shock models and extreme event forecasting when extended to higher mathematical structures, proving its applicability from daily life all the way to natural hazard prediction.
Another crucial distribution type is the exponential distribution, which describes the amount of time between random events when those events occur continuously and independently at a constant average rate. It is widely used to model lifetimes of machines, rates of failure in electrical systems, radioactive decay, waiting times in service queues, and arrival intervals in telecommunications. The exponential distribution represents the memoryless property of some processes, meaning that the likelihood of an event occurring does not depend on how much time has already passed. This allows analysts to forecast waiting times, determine replacement schedules for equipment, and design efficient service systems. In reliability engineering, the exponential distribution forms the backbone of lifetime modelling and maintenance planning.
The uniform distribution represents another major type, describing situations where every outcome within a range has the same probability. This distribution arises in random number generation, lotteries, fair games, simulation models, and algorithms that require unbiased sampling. Unlike the bell-shaped pattern of the normal distribution, the uniform distribution forms a flat shape, representing complete equality of outcome likelihood. It plays a essential role in computer science and cryptography because simulating randomness often begins with uniform sampling before converting to more complex distribution types.
Among all probability distributions, the gamma distribution and its related family occupy a special place in modelling waiting times and reliability systems when processes involve multiple underlying stages. For example, the time until failure of a turbine may depend on several stress cycles rather than a single independent decay event. The gamma distribution can capture increasing or decreasing rates of failure, making it highly useful in survival analysis, climatology, hydrology, and biomedical research. Its flexibility makes it one of the most adaptable continuous distributions for modelling durations.
Another impactful distribution type is the lognormal distribution, which describes outcomes that emerge from multiplicative rather than additive processesŌĆöwhere growth or change is proportional to the current size rather than constant. Income and wealth distribution, stock prices, bacterial population growth, construction costs, and many environmental phenomena follow lognormal distribution behaviour. Instead of symmetric bell shapes, the lognormal distribution is skewed with a long right tail, meaning that extremely large values occur rarely yet have enormous influence. In finance and economics, this distribution is central to risk assessment, investment modelling, and forecasting price volatility.
Some major distributions are built specifically to study extreme events, such as the Pareto distribution and extreme value distributions. These describe systems where most occurrences are small, but rare, extreme values dominate outcomesŌĆöfor example, natural disasters, market crashes, insurance claims, and viral media popularity. These distributions serve as statistical tools for planning against worst-case scenarios, helping governments, engineers, and industries prepare for low-frequency but high-impact events. They demonstrate that unpredictability often follows identifiable mathematical patterns even when outcomes seem dramatic or catastrophic.
The significance of understanding major probability distribution types lies in how they convert randomness into structured information. In healthcare, distributions determine drug effectiveness and disease risks across populations. In manufacturing, they help maintain precision, reduce defects, and detect system failures early. In business, they inform inventory, staffing, pricing, and investment strategies based on risk and demand patterns. In artificial intelligence and machine learning, probability distributions allow models to learn from data, make predictions, handle uncertainty, and compute likelihoods. In physics and engineering, they describe thermal noise, particle movement, turbulence, and organic variability. Across all domains, the major distributions form a shared statistical language that expresses how uncertainty behaves.
Each distribution type offers tools for observation and prediction, but more importantly, they reveal a deeper truth: randomness is not formless chaos but structured variability. Whether outcomes are symmetric, skewed, binary, counting-based, time-based, uniform, or extreme, their behaviour follows recognizable statistical patterns that repeat in nature and human systems. Learning the major probability distribution types unlocks the ability to see patterns in uncertainty, quantify them, model them, and make informed decisions in an unpredictable world.